. 2013 Oct 14;27(1):19-31.
doi: 10.1016/j.devcel.2013.08.015.

Local Dkk1 crosstalk from breeding ornaments impedes regeneration of injured male zebrafish fins

Affiliations

Local Dkk1 crosstalk from breeding ornaments impedes regeneration of injured male zebrafish fins

Junsu Kang et al. Dev Cell. .

Abstract

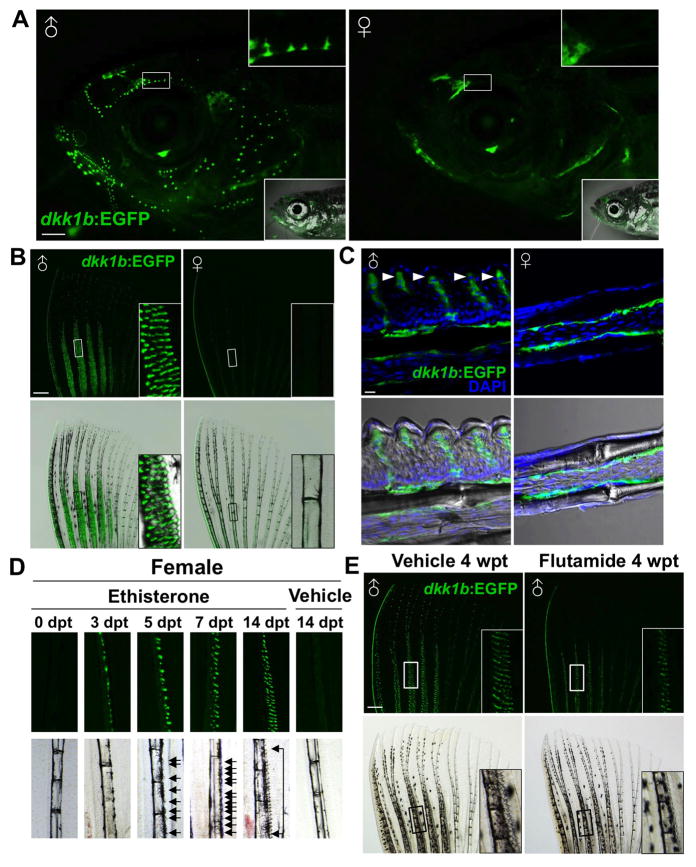
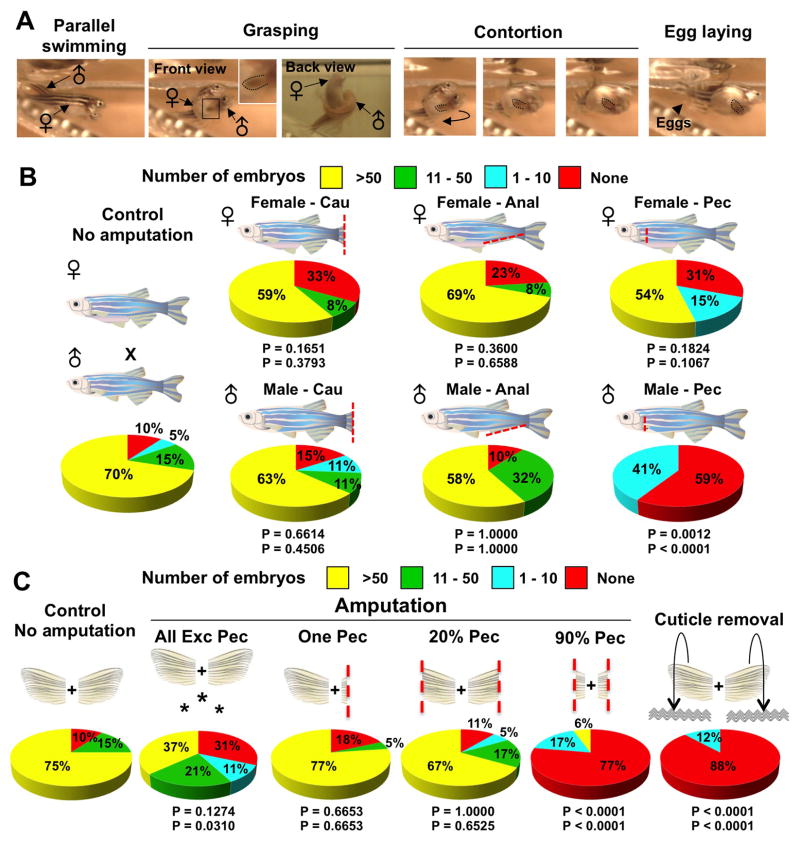
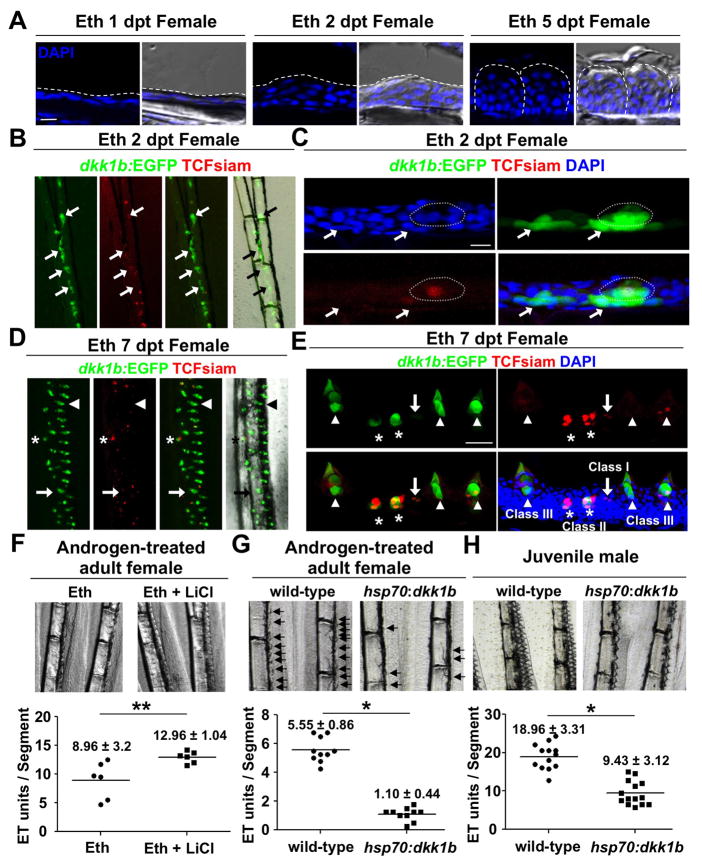
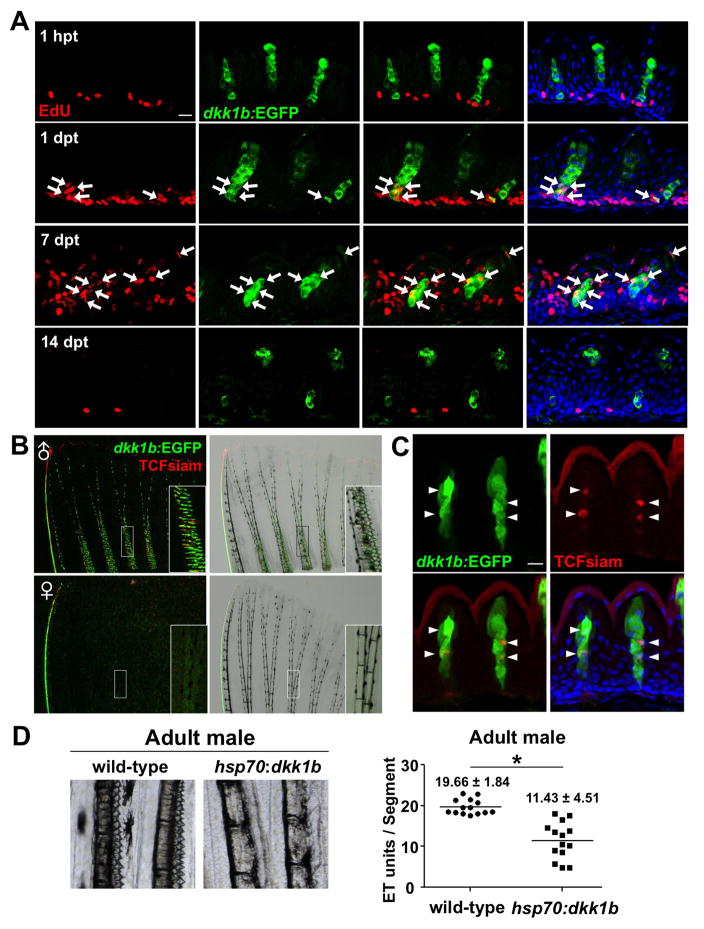
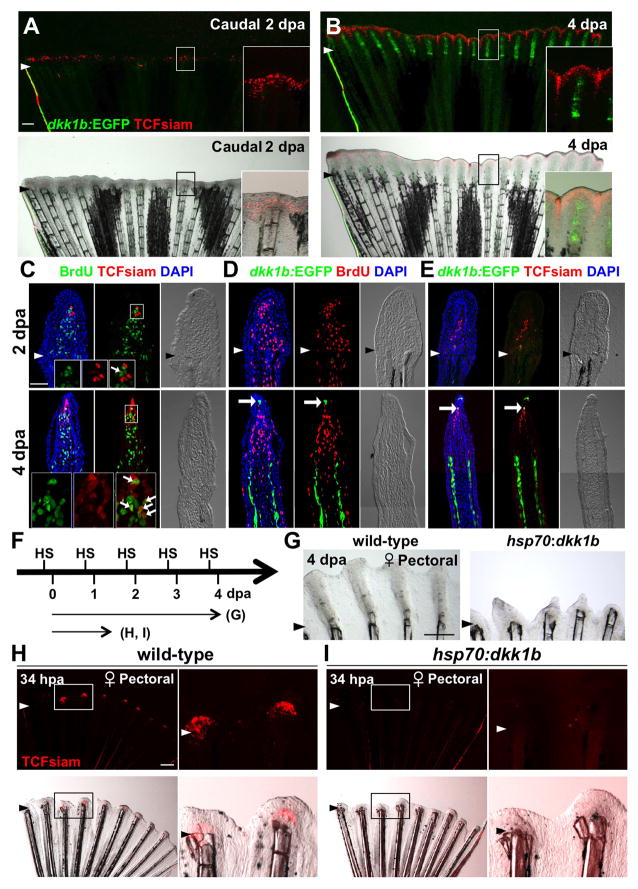
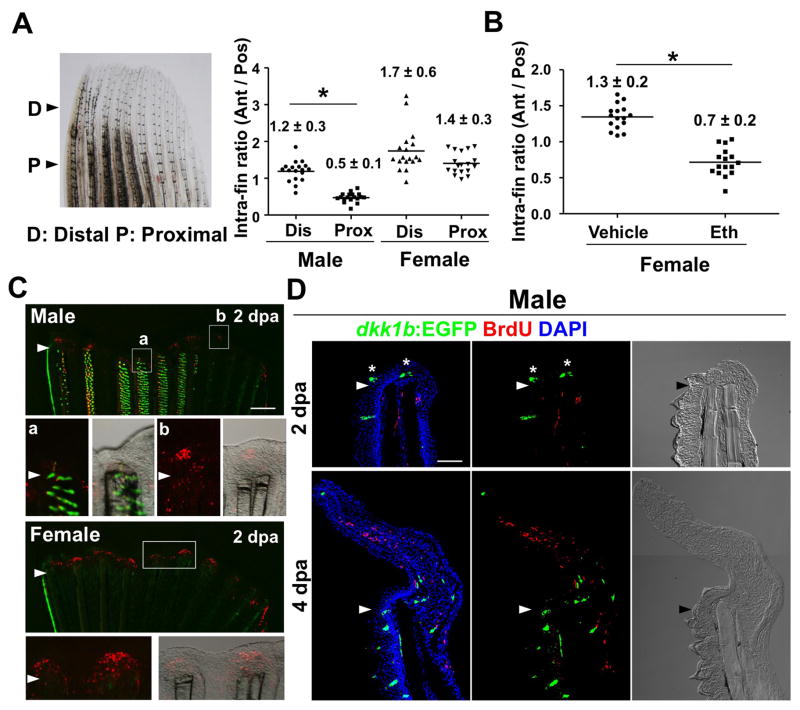
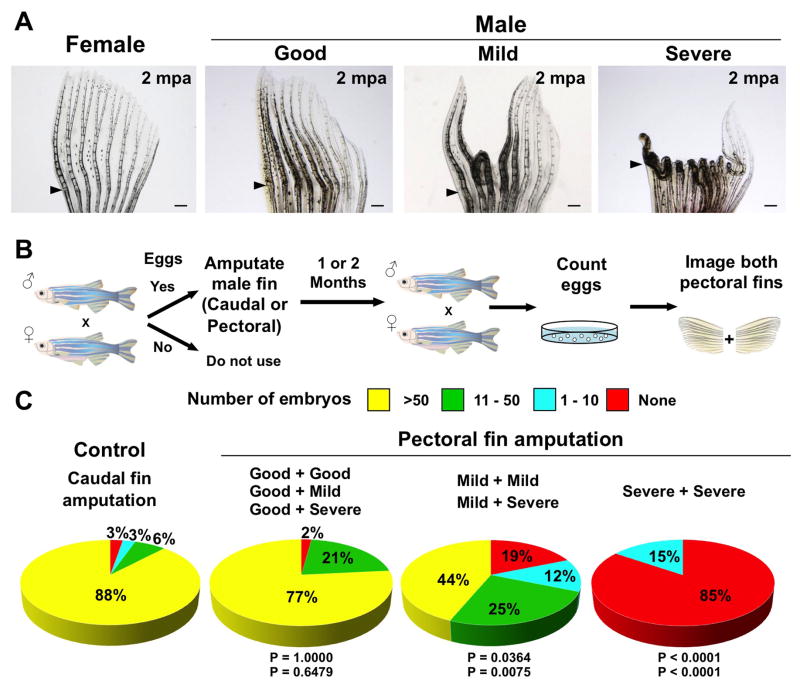
Precise spatiotemporal regulation of signaling activators and inhibitors can help limit developmental crosstalk between neighboring tissues during morphogenesis, homeostasis, and regeneration. Here, we find that the secreted Wnt inhibitor Dkk1b is abundantly produced by dense regions of androgen-regulated epidermal tubercles (ETs) on the surfaces of adult male zebrafish pectoral fins. High-speed videos and amputation experiments reveal that pectoral fins and their ETs are used for male spawning. Formation and vigorous turnover of ETs involve Dkk1b induction and maintenance, whereas Dkk1b is typically restricted from the regeneration blastema after an amputation injury. When amputation occurs through a region containing ETs, a Dkk1b-enriched wound epidermis forms and blastema formation is disrupted, compromising regeneration. Thus, homeostatic signaling by key breeding ornaments can interfere with injury-activated tissue regeneration. Our findings help explain sexually dimorphic fin regeneration in zebrafish and have implications for how regenerative potential might decline as development progresses or during species evolution.


Figures

Figure 1
Figure 1. The Secreted Wnt Signaling Inhibitor Dkk1b is Produced by Androgen-Dependent Male Epidermal Tubercles
(A) Sexually dimorphic dkk1b:EGFP expression in the heads of adult male (left) and female (right) zebrafish, present in constellations of epidermal tubercles. Insets in (top) enlarge area in white boxes. Insets in (bottom) indicate bright-field images. (B) dkk1b:EGFP expression in male and female pectoral fins. Only male fins contain prominent ET on anteromedial rays. Insets in (B) enlarge area in white boxes. Note that the exterior of the anterior fin ray also expresses dkk1b:EGFP. (C) Confocal images of longitudinal sections through dkk1b:EGFP pectoral fins, indicating male-specific ET domains (arrowheads). Both sexes display faint expression in the osteoblast compartment, although it is difficult to detect in some sections. (D) Fluorescent (top) and bright-field (bottom) images of adult female pectoral fin rays after Eth treatment for the indicated durations. dkk1b:EGFP is detectable at 3 days post-treatment (dpt), and ET (arrows) are detectable at 5 dpt. (E) Flutamide treatment decreased the number of ET in male dkk1b:EGFP pectoral fins and reduced their definition. Insets display enlarged areas from white or black boxes. Scale bars = 1 mm (A); 500 μm (B, E); 10 μm (C). See also Figure S1.
Figure 2
Figure 2. Male Pectoral Fins and ET are Important Breeding Structures
(A) Still images of zebrafish mating behavior acquired by high-speed video. 1) Parallel swimming. The male chases the female and attempts to align in a parallel position. 2) Grasping. The male positions one of his pectoral fins below the female abdomen, while placing his posterior trunk over that of the female. 3) Contortion. The male bends his body, arching away from the female. 4) Egg laying. These activities by the male stimulate egg release (arrowhead). Inset enlarges male pectoral fin. Doted lines indicate male pectoral fin. See also Movie S1. (B) Pie charts of mating test after complete fin amputations as indicated in cartoons. ‘Cau’, ‘Anal’, and ‘Pec’ indicate full (>90%) amputation of caudal, anal, and pectoral fins, respectively. n = 12 to 22 animals as described in Table S1. The top P value is calculated from Fisher’s exact test between the ‘no amputation’ control and the experimental group for the percentage of successful matings, with 1 or more embryos considered successful (None vs. >1 embryos). The bottom P value is calculated from Fisher’s exact test between the ‘no amputation’ control and the experimental group for the percentage of successful matings, with 10 or more embryos considered successful (0–10 embryos vs. >10 embryos). As zebrafish typically have 50–200 embryos per mating, a clutch size of 1–10 embryos is unusually small and of borderline success. (C) Pie charts showing results of mating tests after various fin injuries indicated by the above cartoons were given to male zebrafish. Asterisks denote experiments in which all fins except pectoral fins were amputated. n = 17 to 22 animals as described in Table S2. See also Movie S1. See 2B legend for description of P-values.
Figure 3
Figure 3. Induction of de novo ET Formation by Androgen and Wnt Signaling
(A) Section images of the dorsal side of a female pectoral fin after the indicated duration of androgen treatment. Dashed lines indicate the outer epidermal border (Left and Middle) or individual ET (Right). Note that local epidermal thickening is observed by 2 dpt. (B, C) Whole-mount (B) and section (C) images of female TCFsiam; dkk1b:EGFP pectoral fins after 2 days of androgen treatment. Arrows indicate dkk1b:EGFP expression in basal layers in forming ET. Dotted line outlines an ET precursor with one middle cell expressing weak TCFsiam. (D, E) Whole-mount (D) and section (E) images of female TCFsiam;dkk1b:EGFP pectoral fins after 7 days of androgen treatment. ET show stage-specific expression profiles. Putative newly forming ET express TCFsiam (Class I, arrow). Putative immature ET show both TCFsiam and dkk1b:EGFP expressions (Class II, asterisks). Mature ET express only dkk1b:EGFP or both TCFsiam and dkk1b:EGFP (Class III, arrowheads). Note that TCFsiam expression is weak in mature ET. (F) LiCl treatment increases ET formation in androgen-treated adult females. Data are mean ± standard deviation (s.d.), **P < 0.05 by two-tailed Student’s t-test (G, H) Ubiquitous overexpression of dkk1b blunts ET formation in androgen-treated adult females (G) and juvenile males (H). Arrows indicate developing ET in (G). Data are mean ± s.d., *P < 0.001 by two-tailed Student’s t-test Scale bars = 10 μm (A, C); 50 μm (E). See also Figure S2.
Figure 4
Figure 4. Male Pectoral Fin ET Undergo Vigorous Renewal
(A) Section images of male dkk1b:EGFP pectoral fin ET at 1 hour, 1 day, 7 days, or 14 days after EdU injection. Arrows indicate EdU+dkk1b:EGFP-expressing cells. Green: EGFP immunofluorescence; red: EdU immunofluorescence; blue: DAPI. (B) Whole-mount images of TCFsiam; dkk1b:EGFP pectoral fins. Males expressed both reporters in ET. (C) Section image of a male TCFsiam; dkk1b:EGFP pectoral fin ET. Arrowheads indicate TCFsiam+ cells. Cuticle shows red autofluorescence in these images. (D) Ubiquitous overexpression of dkk1b decreased the number of ET in male pectoral fins and reduced their definition. Data are shown as mean ± s.d., *P < 0.001 by two-tailed Student’s t-test. Scale bars = 10 μm (A, C). See also Figure S3.
Figure 5
Figure 5. Blastema Formation Involves Wnt Target Gene Activation and Dkk1b Attenuation
(A, B) Female TCFsiam; dkk1b:EGFP caudal fins at 2 and 4 dpa, shown as whole-mount images. TCFsiam is expressed in distal regions during regeneration. dkk1b:EGFP is not detectable at 2 dpa, but is evident in 4 dpa regenerates. Arrowheads indicate amputation plane. (C) Section images of female TCFsiam caudal fins at 2 (Top) or 4 dpa (Bottom). TCFsiam is expressed in a subset of cells in the distal portion of the blastema, some of which are BrdU-positive 30 minutes after treatment. Arrows indicate BrdU+ and TCFsiam+ cells. Amputation site in 4 dpa is proximal to imaged area. (D) Section images of female dkk1b:EGFP caudal fins at 2 (Top) or 4 dpa (Bottom). dkk1b:EGFP is not detectable at 2 dpa. At 4 dpa, it is expressed in a very small domain at the distal tip of the regenerate (arrow) and in more proximal areas of osteoblast patterning. Expression domains are adjacent to areas of low BrdU incorporation (red), but not to more proliferative blastemal mesenchyme. (E) Section images of female TCFsiam; dkk1b:EGFP caudal fins at 2 (Top) or 4 dpa (Bottom). dkk1b:EGFP+ cells at the distal tip of the 4 dpa regenerate colocalize with TCFsiam (arrow). (F) Experimental design for experiments testing effects of heat-induced overexpression of dkk1b during regeneration. (G) Whole-mount images of 4 dpa wild-type and hsp70:dkk1b female pectoral fin regenerates, indicating that overexpression of dkk1b inhibits regeneration. n = 6. (H, I) Whole-mount images of regenerates at 34 hpa, indicating that dkk1b overexpression blocks induction of TCFsiam in the newly formed blastema. n = 6. Scale bars = 500μm (A, G, H); 50 μm (C–E). See also Figure S4.
Figure 6
Figure 6. Evidence that Dkk1b-Producing ET Inhibit Blastema Formation after Fin Amputation
(A) Quantification of intra-fin ratio of regenerate lengths at 4 days post-amputation (dpa). The ratio of anterior ray length to posterior ray length was calculated separately for each animal as indicated. Regeneration of male anterior regions was inhibited when fins were amputated through proximal ET-containing regions (P and Pro, ‘Proximal’; 50% amputation), but not through distal regions (D and Dis, ‘Distal’; 10–20% amputation). n = 18, mean ± s.d.; *P < 0.001 by one-way analysis of variance (ANOVA) with Bonferroni’s posttest. (B) Quantification of intra-fin ratio in adult females after 14 days of treatment with Eth, followed by one day of washout. Conditions that stimulated formation of dense dkk1b:EGFP+ ET were sufficient to inhibit regeneration of female anterior fin regions. n = 16. Data are mean ± s.d. *P < 0.001 by two-tailed Student’s t-test. (C) Whole-mount images of TCFsiam; dkk1b:EGFP pectoral fins at 2 dpa. TCFsiam expression is detectable in female pectoral fin blastemas (Bottom) and male pectoral fins (Top, b). By contrast, TCFsiam expression is low or undetectable in anterior blastemas of male pectoral fins (Top, a). (D) Section images showing stunted male pectoral fin regeneration at 2 dpa, with dkk1b:EGFP+ ET within and just ventral to the wound epidermis (asterisk). By 4 dpa, regenerates are dysmorphic, typically angling ventrally away from dkk1b:EGFP+ ET before overcorrecting dorsally. Scale bars = 500μm (B, C); 50 μm (D). See also Figure S5.
Figure 7
Figure 7. Long-term Regenerative Defects Inhibit Male Spawning
(A) Whole-mount images of pectoral fins at 2 months post-amputation (mpa). ‘Good’ indicates that all fin rays between the first to sixth fin rays have completely regenerated. ‘Mild’ indicates that 1–3 fin rays between first to sixth fin rays show defective regeneration. ‘Severe’ indicates that at least 4 of 6 fin rays between first to sixth fin rays failed to regenerate normally. Arrowheads indicate amputation planes. (B) Cartoon summarizing experiments in which mating tests were performed 1–2 months after amputation. (C) Pie charts with results of mating tests 1–2 months after amputation of caudal or pectoral fins, with each pectoral fin scored after mating as in (B). Males that regenerated more effectively stimulated better laying than those with defective regeneration. n = 13 to 75 animals as described in Table S3. The top P value is calculated from Fisher’s exact test between the ‘no amputation’ control and the experimental group for the percentage of successful matings, with 1 or more embryos considered successful (None vs. >1 embryos). The bottom P value is calculated from Fisher’s exact test between the ‘no amputation’ control and the experimental group for the percentage of successful matings, with 10 or more embryos considered successful (0–10 embryos vs. >10 embryos). Scale bars = 500 μm (A)

References

    1. Akimenko MA, Mari-Beffa M, Becerra J, Geraudie J. Old questions, new tools, and some answers to the mystery of fin regeneration. Dev Dyn. 2003;226:190–201. - PubMed
    1. Andl T, Reddy ST, Gaddapara T, Millar SE. WNT signals are required for the initiation of hair follicle development. Dev Cell. 2002;2:643–653. - PubMed
    1. Antos CL, Tanaka EM. Vertebrates that regenerate as models for guiding stem cels. Adv Exp Med Biol. 2010;695:184–214. - PubMed
    1. Bely AE, Nyberg KG. Evolution of animal regeneration: re-emergence of a field. Trends Ecol Evol. 2010;25:161–170. - PubMed
    1. Blanpain C, Fuchs E. Epidermal homeostasis: a balancing act of stem cells in the skin. Nat Rev Mol Cell Biol. 2009;10:207–217. - PMC - PubMed

Publication types

MeSH terms

LinkOut - more resources