. 2013 Oct 17;9(1):40.
doi: 10.1186/1746-4811-9-40.

Cell surface and cell outline imaging in plant tissues using the backscattered electron detector in a variable pressure scanning electron microscope

Affiliations

Cell surface and cell outline imaging in plant tissues using the backscattered electron detector in a variable pressure scanning electron microscope

Mark J Talbot et al. Plant Methods. .

Abstract

Background: Scanning electron microscopy (SEM) has been used for high-resolution imaging of plant cell surfaces for many decades. Most SEM imaging employs the secondary electron detector under high vacuum to provide pseudo-3D images of plant organs and especially of surface structures such as trichomes and stomatal guard cells; these samples generally have to be metal-coated to avoid charging artefacts. Variable pressure-SEM allows examination of uncoated tissues, and provides a flexible range of options for imaging, either with a secondary electron detector or backscattered electron detector. In one application, we used the backscattered electron detector under low vacuum conditions to collect images of uncoated barley leaf tissue followed by simple quantification of cell areas.

Results: Here, we outline methods for backscattered electron imaging of a variety of plant tissues with particular focus on collecting images for quantification of cell size and shape. We demonstrate the advantages of this technique over other methods to obtain high contrast cell outlines, and define a set of parameters for imaging Arabidopsis thaliana leaf epidermal cells together with a simple image analysis protocol. We also show how to vary parameters such as accelerating voltage and chamber pressure to optimise imaging in a range of other plant tissues.

Conclusions: Backscattered electron imaging of uncoated plant tissue allows acquisition of images showing details of plant morphology together with images of high contrast cell outlines suitable for semi-automated image analysis. The method is easily adaptable to many types of tissue and suitable for any laboratory with standard SEM preparation equipment and a variable-pressure-SEM or tabletop SEM.


Figures
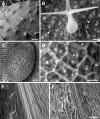
Figure 1
Figure 1
Critical point dried, uncoated A. thaliana tissues examined in the VP-SEM. (A) Mature rosette leaf showing overall leaf morphology and distribution of trichomes (t). (B) Higher magnification view of leaf showing trichome (t), bright cell wall outlines of pavement epidermal cells (arrowheads), and stomatal guard cells (s). (C) Developing seed (approx 7 days after flowering), and (D) higher magnification view showing 3D views of epidermal cell walls revealed by BSE imaging. Solid arrowheads = junction between epidermal outer periclinal and anticlinal cell walls, open arrowheads = junction between epidermal anticlinal walls and periclinal walls of epidermal and sub-epidermal cells, n = nucleus. Simultaneous capture and comparison of SE (E) and BSE (F) images of silique outer epidermis. White arrows show stomata charging in (E), black arrows in (F) show same stomata in the BSE image, arrowheads show cell outlines. Accelerating voltage 20 kV and chamber pressure 10 Pa (A-D) or 80 Pa (E, F). Scale bars = 20 μm (B, D), 50 μm (C), 100 μm (E, F) and 200 μm (A).
Figure 2
Figure 2
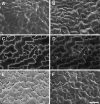
Effect of accelerating voltage on BSE imaging of cell wall outlines in critical point dried A. thaliana rosette leaf. The same area of a leaf was imaged at accelerating voltages 10 (A), 15 (B), 20 (C) or 30 kV (D). Arrowheads indicate cell wall boundaries, arrows indicate chloroplasts in mesophyll cells. Chamber pressure 10 Pa. Scale bar = 60 μm (A–D, bar shown in D).
Figure 3
Figure 3
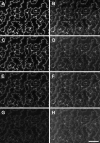
Effect of chamber gas pressure on imaging of cell wall outlines in critical point dried A. thaliana rosette leaf. BSE (A,C,E,G) and SE (B,D,F,H) images were collected from the same area of a single leaf, at 10 (A, B), 50 (C, D), 100 (E, F), and 200 Pa (G, H) chamber pressure, respectively. Brightness and contrast levels were not changed for BSE images. Accelerating voltage 20 kV. Scale bar = 60 μm (A–H, bar shown in H).
Figure 4
Figure 4
Reducing charging for imaging surface details and cell wall outlines in critical point dried A. thaliana rosette leaves under VP mode. Uncoated (A) and carbon-coated (B) leaf imaged at 10 kV accelerating voltage with the VP-SE detector for surface topography. (C-F) BSE (C, E) and SE (D, F) images were collected at 20 kV from the same area of leaf, either coated with carbon (C, D), or gold (E, F), respectively. Chamber pressure 10 Pa. Scale bar = 60 μm (AF, bar shown in F).
Figure 5
Figure 5
Effects of carbon or gold-coating on imaging of cell wall outlines in critical point dried A. thaliana rosette leaves under high vacuum. BSE (A, C) and SE (B, D) images were collected from the same leaf areas coated with carbon (A, B) or gold (C, D), respectively. Arrows indicate charging artefacts in SE image of carbon-coated leaf (B). Scale bar = 40 μm (AD, bar shown in D).
Figure 6
Figure 6
BSE and SE imaging of hydrated A. thaliana rosette leaves. The same area of leaf was imaged frozen on a Peltier-cooled stage with the BSE (A) or SE (B) detectors in VP mode (Accelerating voltage 20 kV and chamber pressure 10 Pa). Different leaves were imaged in extended pressure mode with water vapour as the imaging gas with the BSE (C) and SE (D) detectors. EP-SEM conditions were 82% humidity, 600–700 Pa chamber pressure, 2-3°C Peltier stage temperature, and 20–25 kV accelerating voltage. Scale bar = 40 μm (AD, bar shown in D).
Figure 7
Figure 7
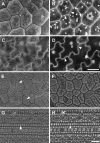
BSE imaging of epidermal cell surface features and internal organelles in a critical point dried A. thaliana seed (A,B), cotton flower petal (C,D), cotton leaf (E,F) and rice leaf (G, H). The same areas of tissue were imaged using 10 kV (A,C,E,G) or 20 kV (B, D, F, H) accelerating voltages (10 Pa chamber pressure). Arrowheads in (B) and (D) indicate cell outlines, in (E) indicate wax deposits on leaf surface, and in (G) and (H) silica deposits on the leaf surface. n = nucleus; s = starch granules. Scale bars = 20 μm (A–D; bar shown in D), 30 μm (EH; bar shown in H).
Figure 8
Figure 8
Effect of accelerating voltage on BSE imaging of cell wall outlines in critical point dried barley (A,D,G), wheat (B,E,H) and Brachypodium distachyon (C,F,I) leaves. The same leaf areas were imaged at 10 (A,B,C), 20 (D, E, F) and 30 kV (G, H, I), at 10 Pa chamber pressure. Arrowheads indicate cell wall outlines. Scale bar = 60 μm (A–I; bar shown in I).
Figure 9
Figure 9
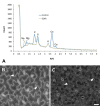
X-ray microanalysis of critical point dried A. thaliana leaves (carbon-coated) and effect of EDTA chelation on BSE signal. (A) EDS spectra from untreated leaves fixed in methanol ('control’) or leaves extracted with 1% EDTA overnight and fixed in methanol ('EDTA’). Note the lack of Mg and Ca peaks in EDTA-extracted leaves (both cations are extracted) and appearance of Na peak (most likely due to the Na present in the EDTA salt solution) in EDTA treated tissue. EDS spectra were collected from a 590x440 μm field (similar to images shown in B and C) at 20 mm working distance using 20 kV accelerating voltage and a spot size of 550 (1.7 nA probe current). Spectra were scaled to exclude lower atomic number elements including carbon (originating from the carbon coating). (B-C) BSE signal from cell wall junctions is relatively bright in untreated tissue (B) and weak in EDTA-extracted tissue (C); arrowheads indicate cell wall outlines. Scale bar = 20 μm (B,C; bar shown in C).
Figure 10
Figure 10
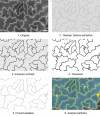
Processing of BSE images of A. thaliana leaf for analysis of cell size. A summary of the main steps in the procedure are shown here for an example image (provided as Additional file4). Not all the steps are shown here; a full description of the procedure and a macro are provided in Additional file 3. Scale bar = 30 μm in original image (1). Colours in step 6 ('Analyze particles’) indicate masks defining cell wall outlines (yellow) and cell areas (blue) in final processed image.
Figure 11
Figure 11
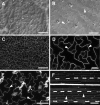
Imaging of epidermal cells with widefield and confocal microscopy. Cleared A. thaliana rosette leaves imaged by differential interference contrast (DIC) widefield microscopy (A, B). Fresh A. thaliana leaves imaged by CLSM using GFP targeted to the plasma membrane (C, D). CLSM imaging of propidium iodide stained fresh A. thaliana cotyledon (E). Autofluorescence of a fresh barley leaf detected after UV excitation in CLSM (F). Arrowheads indicate cell wall outlines. Scale bars = 30 μm (D), 50 μm (B, E), and 100 μm (A, C, F).

References

    1. Bougourd S, Marrison J, Haseloff J. An aniline blue staining procedure for confocal microscopy and 3D imaging of normal and perturbed cellular phenotypes in mature Arabidopsis embryos. Plant J. 2000;24(4):543–550. doi: 10.1046/j.1365-313x.2000.00892.x. - DOI - PubMed
    1. Truernit E, Bauby H, Dubreucq B, Grandjean O, Runions J, Barthelemy J, Palauqui J-C. High-resolution whole-mount imaging of three-dimensional tissue organization and gene expression enables the study of phloem development and structure in Arabidopsis. Plant Cell. 2008;20:1494–1503. doi: 10.1105/tpc.107.056069. - DOI - PMC - PubMed
    1. Wuyts N, Palaqui J-C, Conejero G, Verdeil J-L, Granier C, Massonnet C. High-resolution three-dimensional imaging of the Arabidopsis leaf enables the analysis of cell dimensions in the epidermis and mesophyll. Plant Methods. 2010;6(July):1–14. - PMC - PubMed
    1. Perez-Perez JM, Rubio-Diaz S, Dhondt S, Hernandez-Romero D, Sanchez-Soriano J, Beemster GTS, Ponce MR, Micol JL. Whole organ, venation and epidermal cell morphological variations are correlated in the leaves of Arabidopsis mutants. Plant Cell Environ. 2011;34:2200–2211. doi: 10.1111/j.1365-3040.2011.02415.x. - DOI - PubMed
    1. Fitzgibbon J, Beck M, Zhou J, Faulkner C, Robatzek S, Oparka K. A developmental framework for complex plasmodesmata formation revealed by large-scale imaging of the Arabidopsis leaf epidermis. Plant Cell. 2013;25(1):57–70. doi: 10.1105/tpc.112.105890. - DOI - PMC - PubMed

LinkOut - more resources