

The anatomy of a scientific rumor
- PMID: 24135961
- PMCID: PMC3798885
- DOI: 10.1038/srep02980
The anatomy of a scientific rumor
Abstract
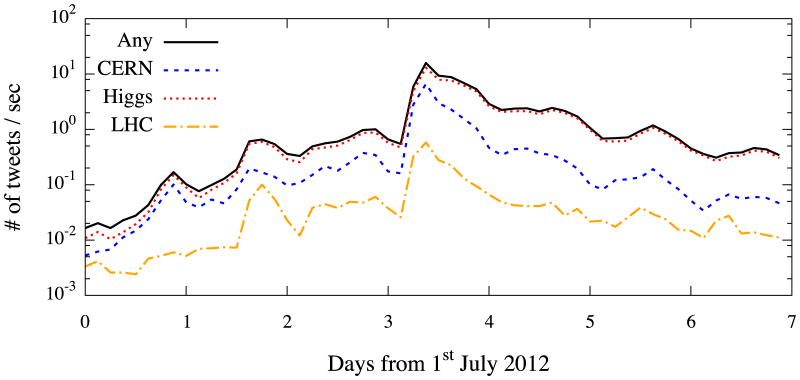
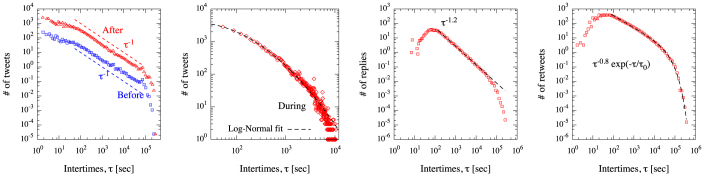
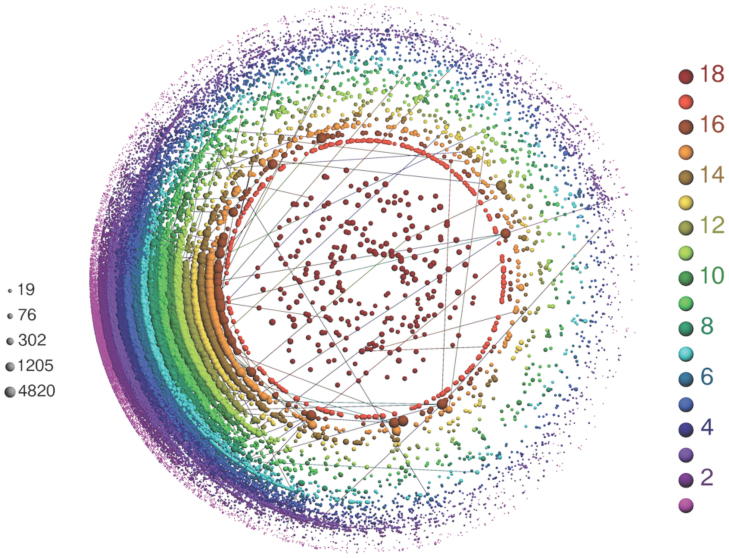
The announcement of the discovery of a Higgs boson-like particle at CERN will be remembered as one of the milestones of the scientific endeavor of the 21(st) century. In this paper we present a study of information spreading processes on Twitter before, during and after the announcement of the discovery of a new particle with the features of the elusive Higgs boson on 4(th) July 2012. We report evidence for non-trivial spatio-temporal patterns in user activities at individual and global level, such as tweeting, re-tweeting and replying to existing tweets. We provide a possible explanation for the observed time-varying dynamics of user activities during the spreading of this scientific "rumor". We model the information spreading in the corresponding network of individuals who posted a tweet related to the Higgs boson discovery. Finally, we show that we are able to reproduce the global behavior of about 500,000 individuals with remarkable accuracy.
Figures
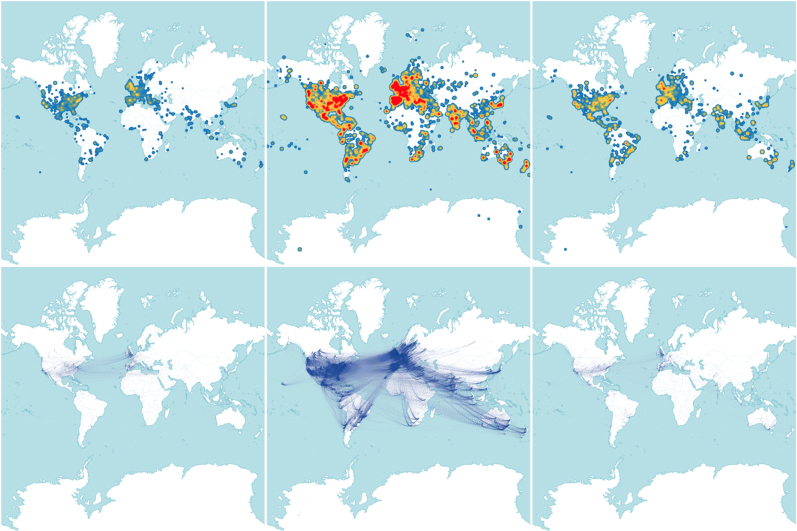
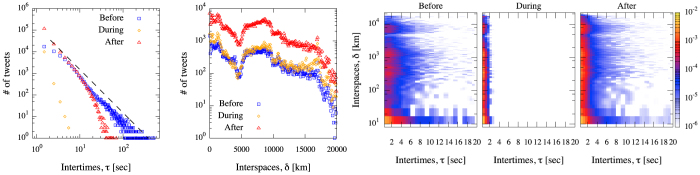
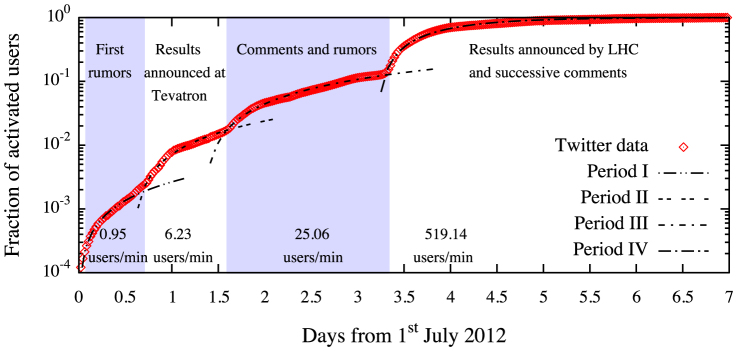
 for each period is reported at the bottom of the figure.
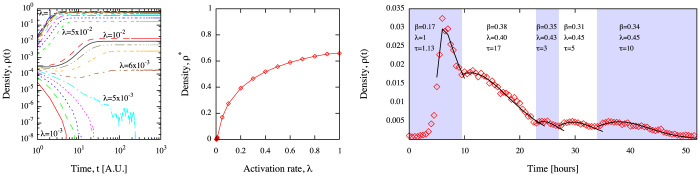
Similar articles
-
Rumor diffusion and convergence during the 3.11 earthquake: a twitter case study.PLoS One. 2015 Apr 1;10(4):e0121443. doi: 10.1371/journal.pone.0121443. eCollection 2015. PLoS One. 2015. PMID: 25831122 Free PMC article.
-
Classification of Twitter Users Who Tweet About E-Cigarettes.JMIR Public Health Surveill. 2017 Sep 26;3(3):e63. doi: 10.2196/publichealth.8060. JMIR Public Health Surveill. 2017. PMID: 28951381 Free PMC article.
-
Twitter use at the 2016 Conference on the Science of Dissemination and Implementation in Health: analyzing #DIScience16.Implement Sci. 2018 Feb 20;13(1):34. doi: 10.1186/s13012-018-0723-z. Implement Sci. 2018. PMID: 29458394 Free PMC article.
-
Tweet content related to sexually transmitted diseases: no joking matter.J Med Internet Res. 2014 Oct 6;16(10):e228. doi: 10.2196/jmir.3259. J Med Internet Res. 2014. PMID: 25289463 Free PMC article.
-
The profile of the Higgs boson: status and prospects.Philos Trans A Math Phys Eng Sci. 2024 Feb 5;382(2266):20230087. doi: 10.1098/rsta.2023.0087. Epub 2023 Dec 18. Philos Trans A Math Phys Eng Sci. 2024. PMID: 38104616 Review.
Cited by
-
COVID-19 and 5G conspiracy theories: long term observation of a digital wildfire.Int J Data Sci Anal. 2023;15(3):329-346. doi: 10.1007/s41060-022-00322-3. Epub 2022 May 27. Int J Data Sci Anal. 2023. PMID: 35669096 Free PMC article.
-
A process of rumour scotching on finite populations.R Soc Open Sci. 2015 Sep 16;2(9):150240. doi: 10.1098/rsos.150240. eCollection 2015 Sep. R Soc Open Sci. 2015. PMID: 26473048 Free PMC article.
-
Collective dynamics behind success.Nat Commun. 2024 Dec 19;15(1):10701. doi: 10.1038/s41467-024-54612-4. Nat Commun. 2024. PMID: 39702328 Free PMC article. Review.
-
The dynamics of information-driven coordination phenomena: A transfer entropy analysis.Sci Adv. 2016 Apr 1;2(4):e1501158. doi: 10.1126/sciadv.1501158. eCollection 2016 Apr. Sci Adv. 2016. PMID: 27051875 Free PMC article.
-
Layer-switching cost and optimality in information spreading on multiplex networks.Sci Rep. 2016 Feb 18;6:21392. doi: 10.1038/srep21392. Sci Rep. 2016. PMID: 26887527 Free PMC article.
References
-
- Higgs P. Broken symmetries and the masses of gauge bosons. Phys. Rev. Lett. 13, 508 (1964).
-
- Cabibbo N., Maiani L., Parisi G. & Petronzio R. Bounds on the fermions and higgs boson masses in grand unified theories. Nucl. Phys. B 158, 295–305 (1979).
-
- Langacker P. Grand unified theories and proton decay. Phys. Rep. 72, 185–385 (1981).
-
- Ellis J., Gunion J., Haber H., Roszkowski L. & Zwirner F. Higgs bosons in a nonminimal supersymmetric model. Phys. Rev. D 39, 844 (1989). - PubMed
-
- Amaldi U., De Boer W. & Fürstenau H. Comparison of grand unified theories with electroweak and strong coupling constants measured at lep. Phys. Lett. B 260, 447–455 (1991).
Publication types
MeSH terms
LinkOut - more resources
Full Text Sources
Other Literature Sources
