. 2013 Oct 18:3:2983.
doi: 10.1038/srep02983.

Unraveling the origin of exponential law in intra-urban human mobility

Affiliations

Unraveling the origin of exponential law in intra-urban human mobility

Xiao Liang et al. Sci Rep. .

Abstract

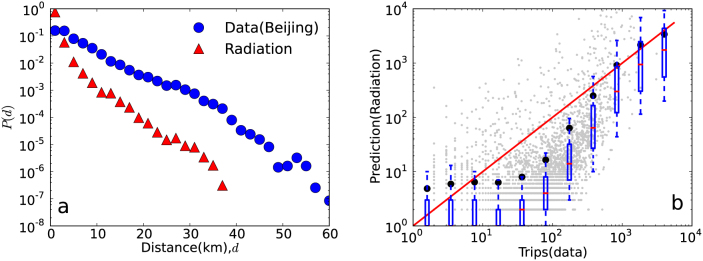
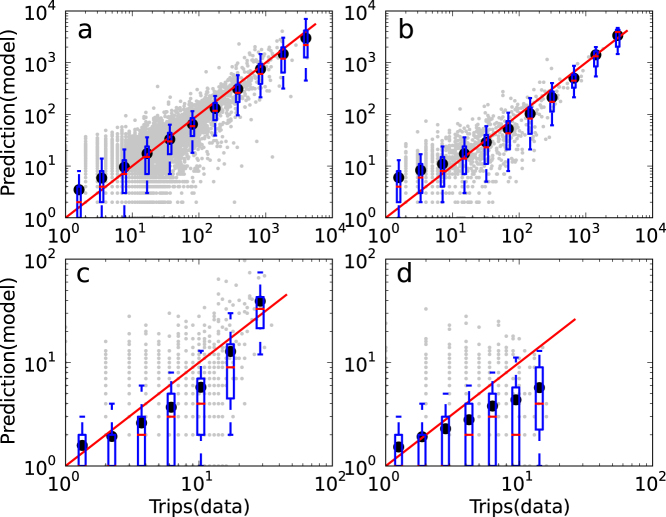
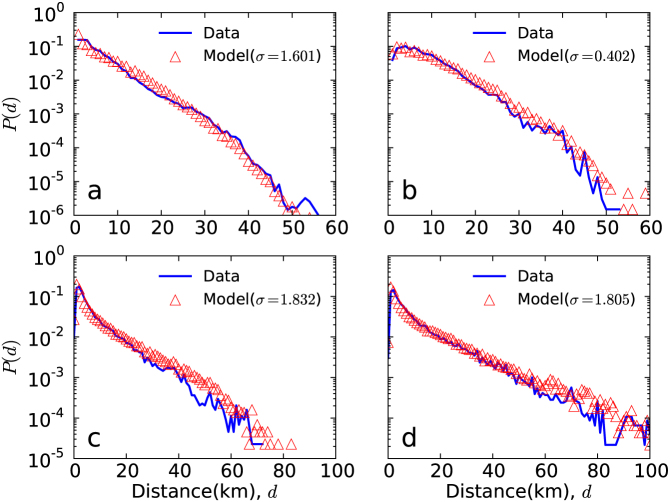
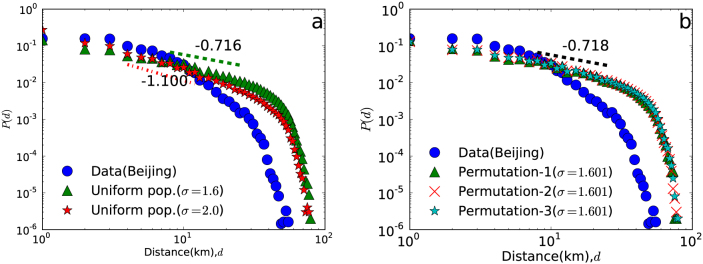
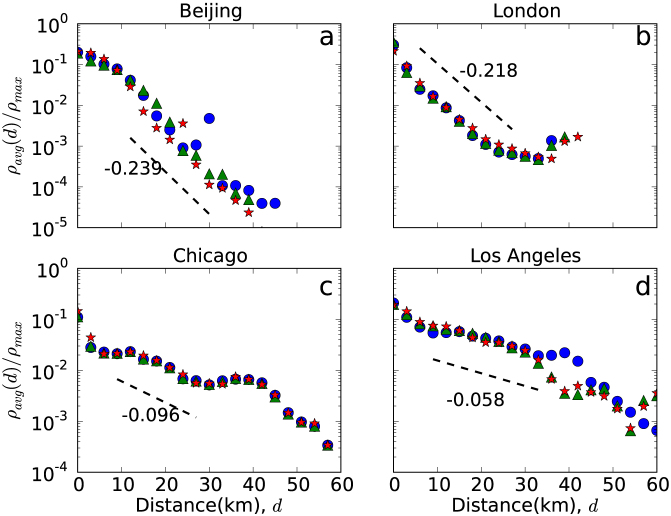
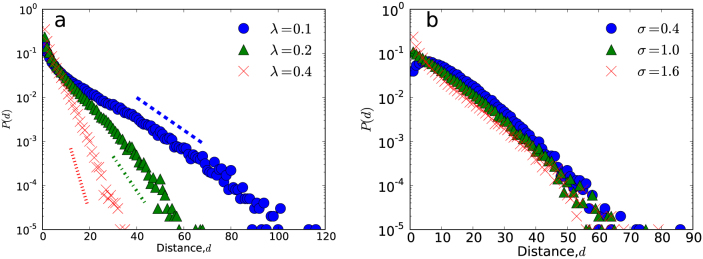
The vast majority of travel takes place within cities. Recently, new data has become available which allows for the discovery of urban mobility patterns which differ from established results about long distance travel. Specifically, the latest evidence increasingly points to exponential trip length distributions, contrary to the scaling laws observed on larger scales. In this paper, in order to explore the origin of the exponential law, we propose a new model which can predict individual flows in urban areas better. Based on the model, we explain the exponential law of intra-urban mobility as a result of the exponential decrease in average population density in urban areas. Indeed, both empirical and analytical results indicate that the trip length and the population density share the same exponential decaying rate.


Figures

Figure 1
Figure 1. The simulations by the radiation model in Beijing.
(a) The comparison of distance distributions between actual and simulated trips. (b) The prediction of traffic flows between regions. The grey points show the relationship between actual and predicted flux for ordered pairs of regions. The red line y = x stands for the actual flows equal with predicted ones. The black points are the mean values of predicted flux in the bins. The ends of whisker represent the 9th and 91st percentile in the bins.
Figure 2
Figure 2. The relationships between actual and predicted traffic flux.
(a)Beijing. (b)London. (c)Chicago. (d)Los Angeles.
Figure 3
Figure 3. The distributions of actual and simulated trip distances in the four cities.
The blue solid lines denote the actual traveling distance distributions. The red triangles represent the trip-length distributions simulated by our model. (a)Beijing. (b)London. (c)Chicago. (d)Los Angeles.
Figure 4
Figure 4. The simulated trip-length distributions with different spatial population distributions in Beijing.
(a) Uniform population distributions with different model parameters. (b) Randomized permutation of population numbers of cells.
Figure 5
Figure 5. The normalized average density versus the distance to urban centers.
For each city, three hot regions with high population densities are considered as urban centers. And the blue circles, green triangles and red stars denote the average densities, which are normalized by the maxima of densities, for selected urban centers respectively. The black dashed lines represent the decreasing rates of densities with distance.
Figure 6
Figure 6. The simulations based on negative exponential distributions of population density.
(a) Different population density distributions with the fixed model parameter σ = 1.6. The simulated distance distributions, corresponding to different λ (0.1, 0.2 and 0.4), decay exponentially with slope 0.085 (blue dashed line), 0.180 (green dash-dot line), 0.414 (red dotted line) respectively. (b) Different model parameters with the fixed population density distribution (λ = 0.2).

References

    1. Rozenfeld H. D. et al. Laws of population growth. Proc. Natl. Acad. Sci. U.S.A. 105, 18702–18707 (2008). - PMC - PubMed
    1. Yuan J., Zheng Y. & Xie X. Discovering Regions of Different Functions in a City Using Human Mobility and POIs. In: Proc. ACM SIGKDD 186–194 (2012).
    1. Zheng Y., Liu Y., Yuan J. & Xie X. Urban computing with taxicabs. In: Proc. Ubicomp 89–98 (2011).
    1. Balcan D. et al. Multiscale mobility networks and the spatial spreading of infectious diseases. Proc. Natl. Acad. Sci. U.S.A. 106, 21484–21489 (2009). - PMC - PubMed
    1. Colizza V., Barrat A., Barthelemy M., Valleron A.-J. & Vespignani A. Modeling the worldwide spread of pandemic influenza: baseline case and containment interventions. PLoS Med. 4, e13 (2007). - PMC - PubMed

Publication types