. 2013 Oct 17;4(10):e869.
doi: 10.1038/cddis.2013.397.

The G-protein-coupled estrogen receptor agonist G-1 suppresses proliferation of ovarian cancer cells by blocking tubulin polymerization

Affiliations

The G-protein-coupled estrogen receptor agonist G-1 suppresses proliferation of ovarian cancer cells by blocking tubulin polymerization

C Wang et al. Cell Death Dis. .

Abstract

The G-protein-coupled estrogen receptor 1 (GPER) has recently been reported to mediate the non-genomic action of estrogen in different types of cells and tissues. G-1 (1-[4-(6-bromobenzo[1,3] dioxol-5yl)-3a,4,5,9b-tetrahydro-3H-cyclopenta[c]quinolin-8-yl]-ethanone) was developed as a potent and selective agonist for GPER. G-1 has been shown to induce the expression of genes and activate pathways that facilitate cancer cell proliferation by activating GPER. Here we demonstrate that G-1 has an anticancer potential with a mechanism similar to vinca alkaloids, the commonly used chemotherapy drugs. We found that G-1 blocks tubulin polymerization and thereby interrupts microtubule assembly in ovarian cancer cells leading to the arrest of cell cycle in the prophase of mitosis and the suppression of ovarian cancer cell proliferation. G-1 treatment also induces apoptosis of ovarian cancer cells. The ability of G-1 to target microtubules to suppress ovarian cancer cell proliferation makes it a promising candidate drug for treatment of ovarian cancer.


Figures

Figure 1
Figure 1
Effect of G-1 on the proliferation of ovarian cancer cells. (a) Representative images of the morphological change in IGROV-1 cells before (top image, control) and after treatment for 16 h with 0.5 μM of G-1 (middle panel image) or 2 μM of G-1 (lower panel image). The bar graph shows the cell number before and after treatment with increasing concentrations of G-1 for 60 h. Each bar represents mean±S.E.M. Bars with different letters are significantly (P<0.05) different from each other. Scale bars, 50 μm. (b) Effect of G-1 on the cell-cycle progression of IGROV-1 cells. CTRL: DMSO (0.1% in the medium) control; G-1: cells treated with 2 μM of G-1 for 16 h. (c) Representative images show the morphology of SKOV-3 cells before (top image, control) and after treatment for 16 h with 0.5 μM of G-1 (middle panel image) or 2 μM of G-1 (lower panel image). Scale bars, 50 μm. The bar graph shows the SKOV-3 cell number before and after treatment with different concentrations of G-1 for 60 h. Each bar represents a mean cell number±S.E.M. Bars with different letters are significantly (P<0.05) different from each other. (d) Effect of G-1 on the cell-cycle progression of SKOV-3 cells. CTRL, DMSO (0.1% in the medium) control; G-1: cells treated with 2 μM of G-1 for 16 h
Figure 2
Figure 2
Effect of G-1 on the cell-cycle progression of IGROV-1. (a) Microtubule structure and distribution of phosphorylated histone H3 (Ser10) in IGROV-1 cells during the normal cell cycle. Top panels: distribution of microtubule shown by α-tubulin staining (red), lower panels: combination of microtubule marker (red) and phosphorylated histone H3 (green) in the IGROV-1 cells during the normal cell cycle. Nuclei were stained with DAPI. Inter, interphase; L-G2, late G2 phase; Pro, prophase; Meta, metaphase; Ana, anaphase; Telo+Cytk, telophase and cytokinesis. Scale bars, 10 μm. (b) Microtubule structure (red) and distribution of phosphorylated histone H3 (green) in IGROV-1 cells after treatment with 2 μM of G-1 for 16 h. Scale bars, 10 μm. (c) Percentage of cells staining positive for phosphorylated histone H3 (Ser10). Each bar represents the mean±S.E.M. Bars with different letters are significantly (P<0.05) different from each other. (d) Percentage of cells in different stages of the cell cycle. Each bar represents the mean±S.E.M. Bars with ‘*' are significantly (P<0.05) different from control
Figure 3
Figure 3
Effect of G-1 on the cell-cycle progression of SKOV-3 ovarian cancer cells. (a) Microtubule structure and distribution of phosphorylated histone H3 (Ser10) in SKOV-3 cells during the normal cell cycle. Top panels: distribution of microtubules shown by α-tubulin staining (red), lower panels: combination of microtubule marker (red) and phosphorylated histone H3 (green) in the SKOV-3 cells during the normal cell cycle. Nuclei were stained with DAPI. Inter, interphase; L-G2, late G2 phase; Pro, prophase; Meta, metaphase; Ana, anaphase; Telo+Cytk, telophase and cytokinesis. Scale bars, 10 μm. (b) Microtubule structure (red) and distribution of phosphorylated histone H3 (green) in SKOV-3 cells after treatment with 2 μM of G-1 for 16 h. Scale bars, 10 μm. (c) Percentage of cells staining positive for phosphorylated histone H3 (Ser10). Each bar represents the mean±S.E.M. Bars with same letter are not significantly (P<0.05) different from each other. (d) Percentage of the cells in different stages of the cell cycle. Each bar represents the mean±S.E.M. Bars with ‘*' are significantly (P<0.05) different from the control
Figure 4
Figure 4
Evidence for G-1 induction of apoptosis in IGROV-1 cells. (a) IGROV-1 cells were treated with or without G-1 (2 μM) for 48 h. Compared with the control (top panel), the morphology of IGROV-1 cells drastically changed in the G-1-treated groups (lower panel). The cellular borders in the treated groups disappeared. Scale bars, 40 μm. (b) Compared with the control group (top panel), G-1 treatment (2 μM, 60 h) induced dramatic DNA fragmentation (lower panel). Red is α-tubulin. Green is phospho-histone H3 (Ser10). Nuclei were stained with DAPI. Arrows point to the fragmented DNA. Scale bars, 10 μm. (c) Western blot analysis of molecules associated with cell apoptosis in the IGROV-1 cells treated with or without different concentrations of G-1 for 24 h. Results are from a representative experiment. Quantitative results from multiple experiments are presented in Supplementary Figure S1. (d) The MTT assay shows that G-1 treatment (2 μM, 48 h) significantly reduces cell viability. (e) IGROV-1 cells were treated with or without 2 μM of G-1 for 2–24 h. Caspase 3/7 activity assay shows that G-1-induced apoptosis in the IGROV-1 cells that are caspase 3/7 independent. (f) Localization of AIF (green) in IGROV-1 cells treated with or without 2 μM G-1 for 24 h. Notice the translocation of AIF from cytosol to the nuclear area after G-1 treatment. Red is α-tubulin. Nuclei were stained with DAPI. Arrows point to the nuclear-localized AIF. Scale bars, 10 μm
Figure 5
Figure 5
Evidence that G-1 induces apoptosis of SKOV-3 ovarian cancer cells. (a) The morphology of SKOV-3 ovarian cancer cells drastically changed in the G-1-treated groups (2 μM, 48 h; lower panel) compared with the control (top panel). Floating cells and apoptotic bodies in the G-1-treated SKOV-3 cells suggest that G-1 induces apoptosis in SKOV-3 cells. Scale bars, 20 μm. (b) Compared with the control group (top panel), G-1 treatment (2 μM, 60 h) induced dramatic DNA fragmentation in SKOV-3 cells (lower panel). Red is α-tubulin. Green is phospho-histone H3 (Ser10). Nuclei were stained with DAPI. Arrows point to the fragmented nuclei. Scale bars, 10 μm. (c) SKOV-3 cells were treated with different concentrations of G-1 for 24 h. Molecules associated with cell apoptosis were detected by western blot. Results are from a representative experiment. Quantitative results from multiple experiments are presented in Supplementary Figure S2. (d) SKOV-3 cells were treated with different concentrations of G-1 for 48 h. Cell viability was detected with MTT assay. (e) SKOV-3 cells were treated with different concentrations of G-1 for 24 h. The caspase 3/7 activity assay shows that G-1-induced apoptosis in a caspase-dependent manner in SKOV-3 cells
Figure 6
Figure 6
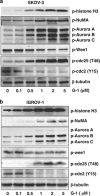
Effect of G-1 treatment on the expression and activation of proteins associated with mitosis entry in the cultured (a) SKOV-3 and (b) IGROV-1 cells. Cells were treated with different concentrations of G-1 for 16 h. Molecules associated with cell-cycle progression were detected by western blot. Results are from a representative experiment. Quantitative results from multiple experiments are presented in Supplementary Figures S3 and S4
Figure 7
Figure 7
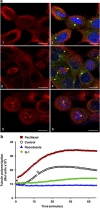
Effect of G-1 treatment on the tubulin polymerization and spindle formation. (a) The effect of G-1 on spindle formation in cultured IGROV-1 cells. a-1, a-3, and a-5 are IGROV-1 cells stained with α-tubulin; a-2, a-4, and a-6 are IGROV-1 cells stained with combination of α-tubulin (red) and pericentrin-2 (green). The nucleus was stained with DAPI (blue). a-1 and a-2 show low-temperature-induced microtubule depolymerization in cultured IGROV-1 cells; a-3 and a-4 show that temperature recovery results in the polymerization of microtubule and formation of spindle in IGROV-1 cells. a-5 and a-6 show that addition of G-1 results in the disassembly of normal microtubules leading to the inhibition of spindle formation. Notice the formation of multiple spindle asters in the G-1-treated IGROV-1 cells. Scale bars, 10 μm. (b) In vitro microtubule assembly assay shows that G-1 (green graph) suppresses tubulin polymerization. Paclitaxel was used as a positive control (red graph). Nocodazole was used as a negative control (blue graph)

References

    1. Prossnitz ER, Barton M. The G-protein-coupled estrogen receptor GPER in health and disease. Nat Rev Endocrinol. 2011;7:715–726. - PMC - PubMed
    1. Deroo BJ, Korach KS. Estrogen receptors and human disease. J Clin Invest. 2006;116:561–570. - PMC - PubMed
    1. Bologa CG, Revankar CM, Young SM, Edwards BS, Arterburn JB, Kiselyov AS, et al. Virtual and biomolecular screening converge on a selective agonist for GPR30. Nat Chem Biol. 2006;2:207–212. - PubMed
    1. Dennis MK, Burai R, Ramesh C, Petrie WK, Alcon SN, Nayak TK, et al. In vivo effects of a GPR30 antagonist. Nat Chem Biol. 2009;5:421–427. - PMC - PubMed
    1. Dennis MK, Field AS, Burai R, Ramesh C, Petrie WK, Bologa CG, et al. Identification of a GPER/GPR30 antagonist with improved estrogen receptor counterselectivity. J Steroid Biochem Mol Biol. 2011;127:358–366. - PMC - PubMed

Publication types

MeSH terms

Substances