. 2013 Nov;8(11):2212-39.
doi: 10.1038/nprot.2013.133. Epub 2013 Oct 17.

Selective ribosome profiling as a tool for studying the interaction of chaperones and targeting factors with nascent polypeptide chains and ribosomes

Affiliations

Selective ribosome profiling as a tool for studying the interaction of chaperones and targeting factors with nascent polypeptide chains and ribosomes

Annemarie H Becker et al. Nat Protoc. 2013 Nov.

Abstract

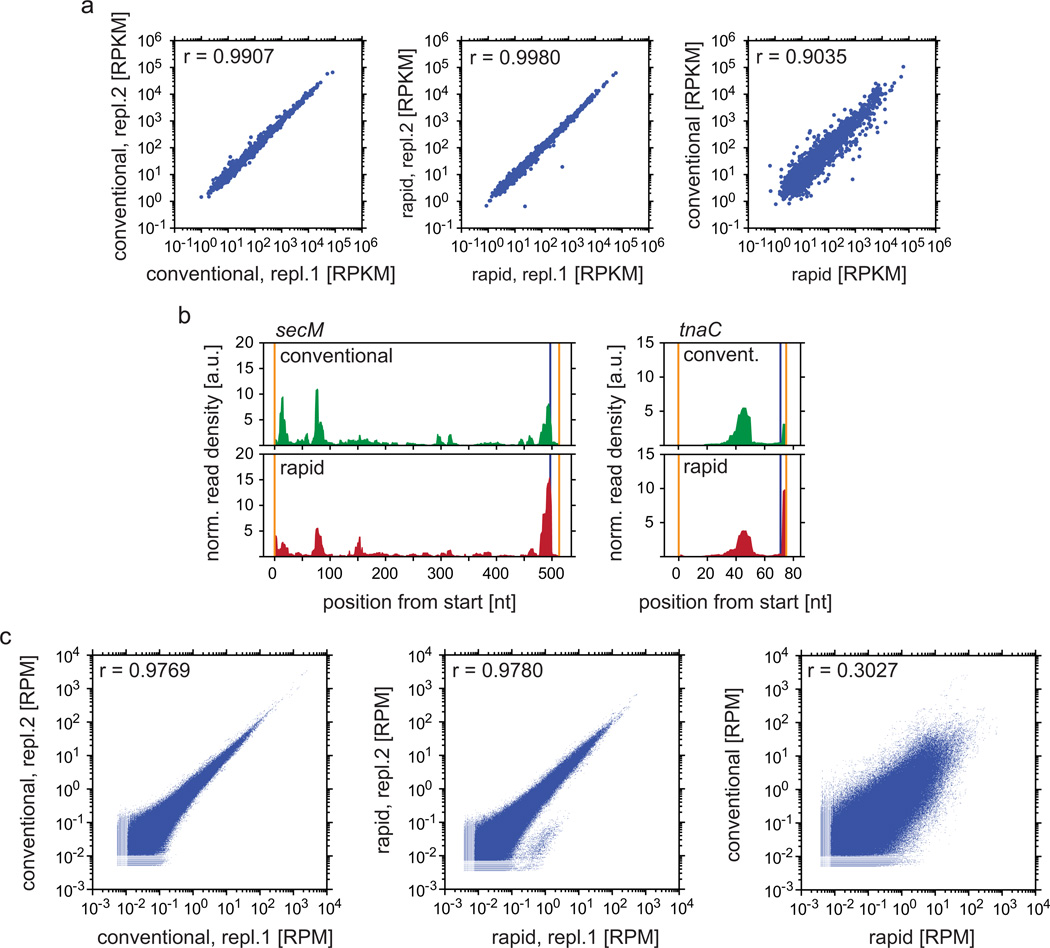
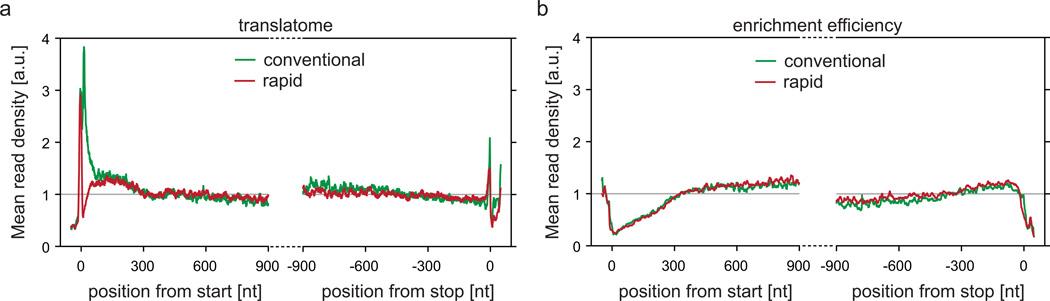
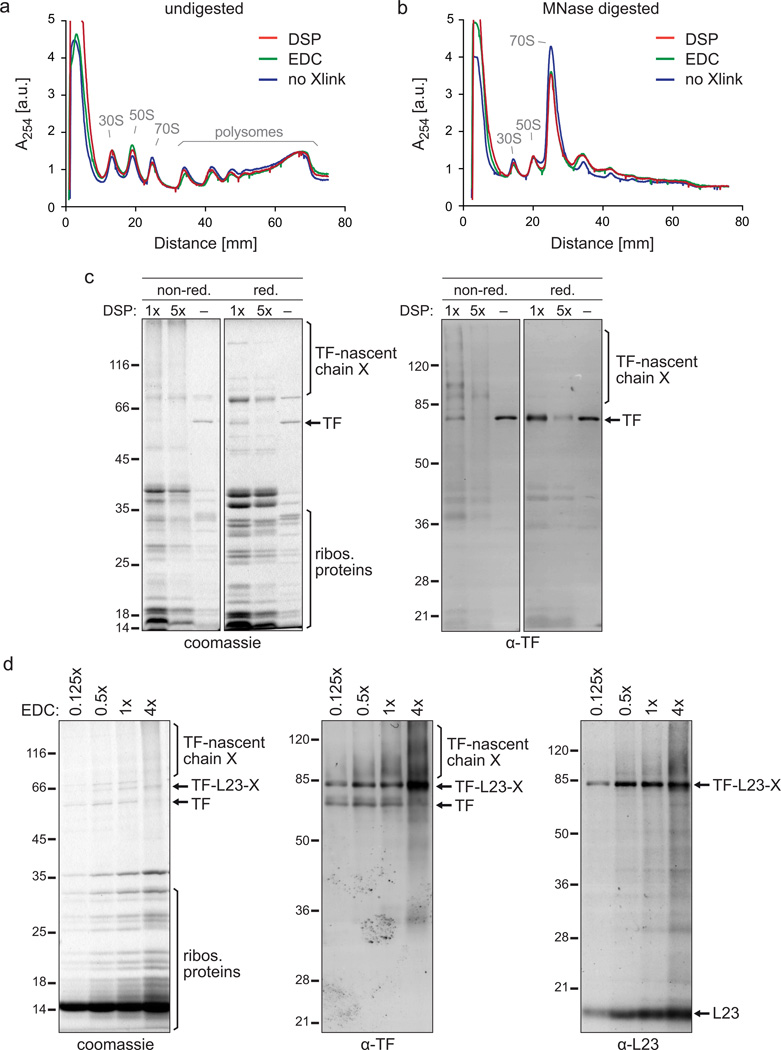
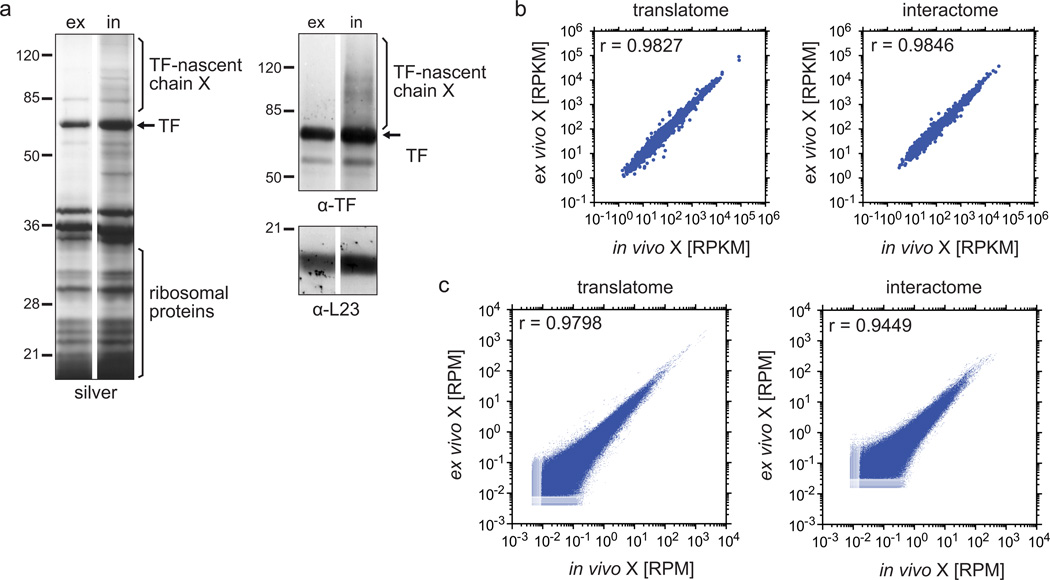
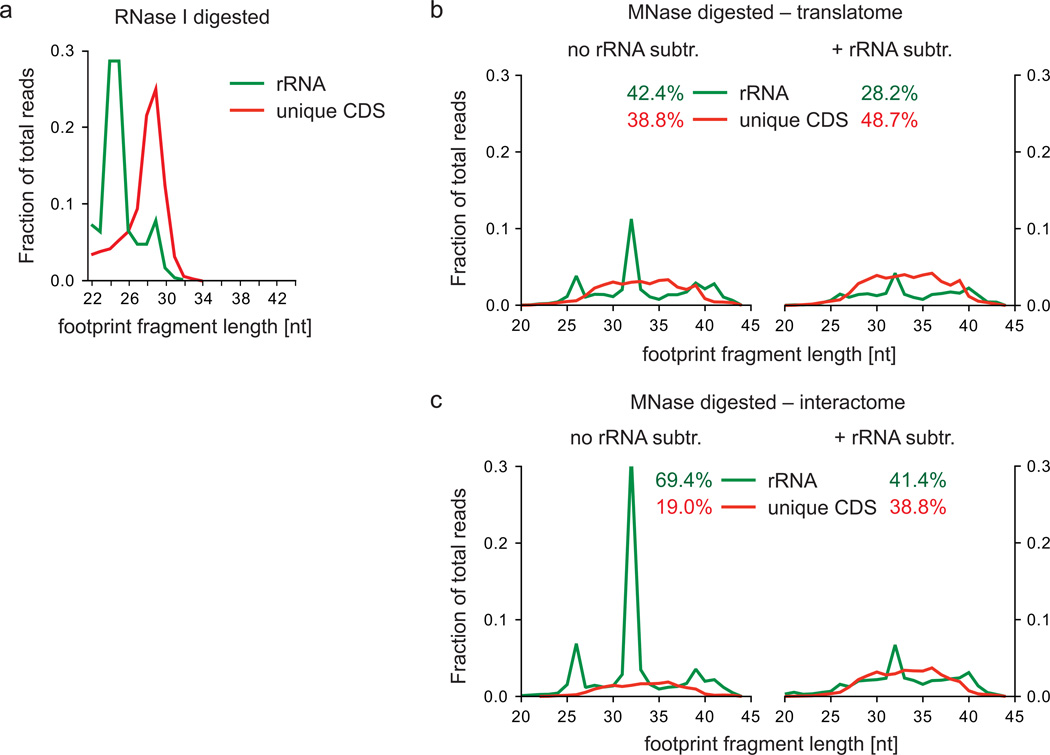
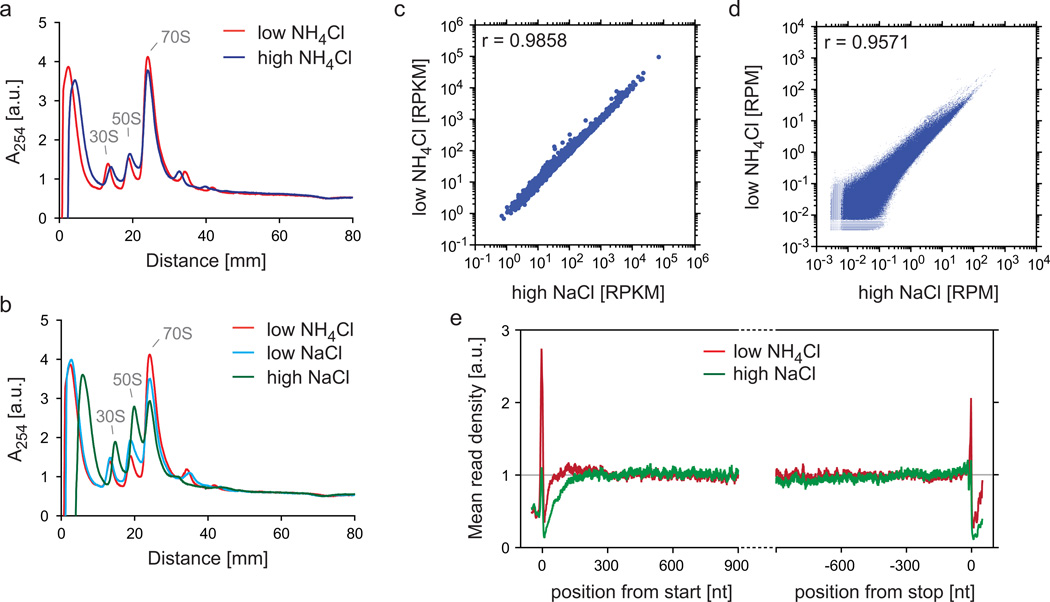
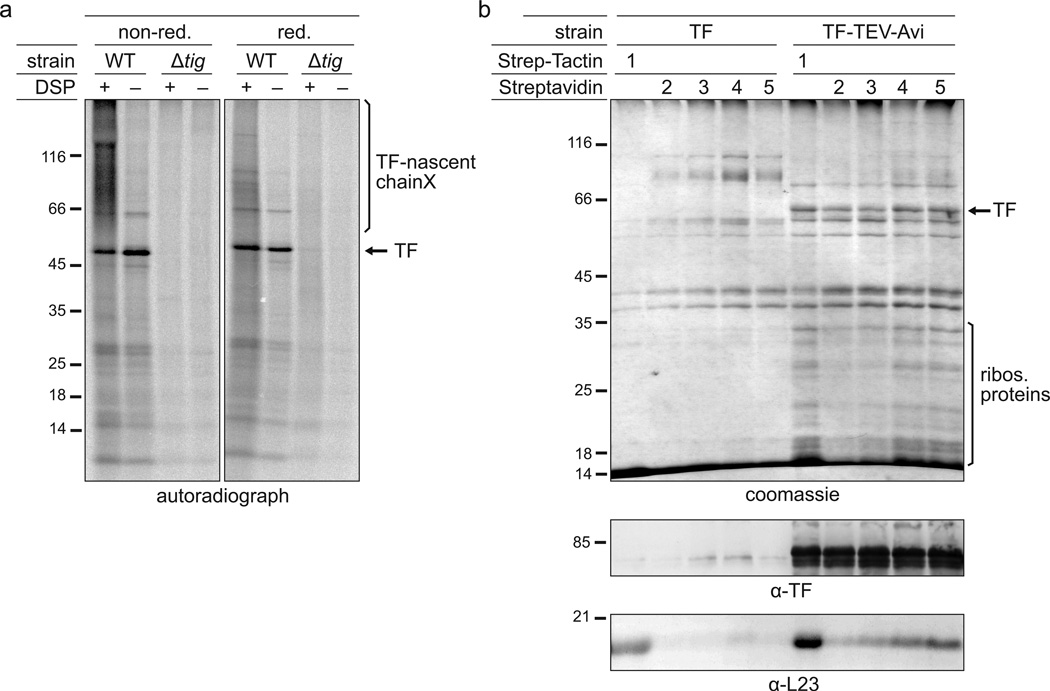
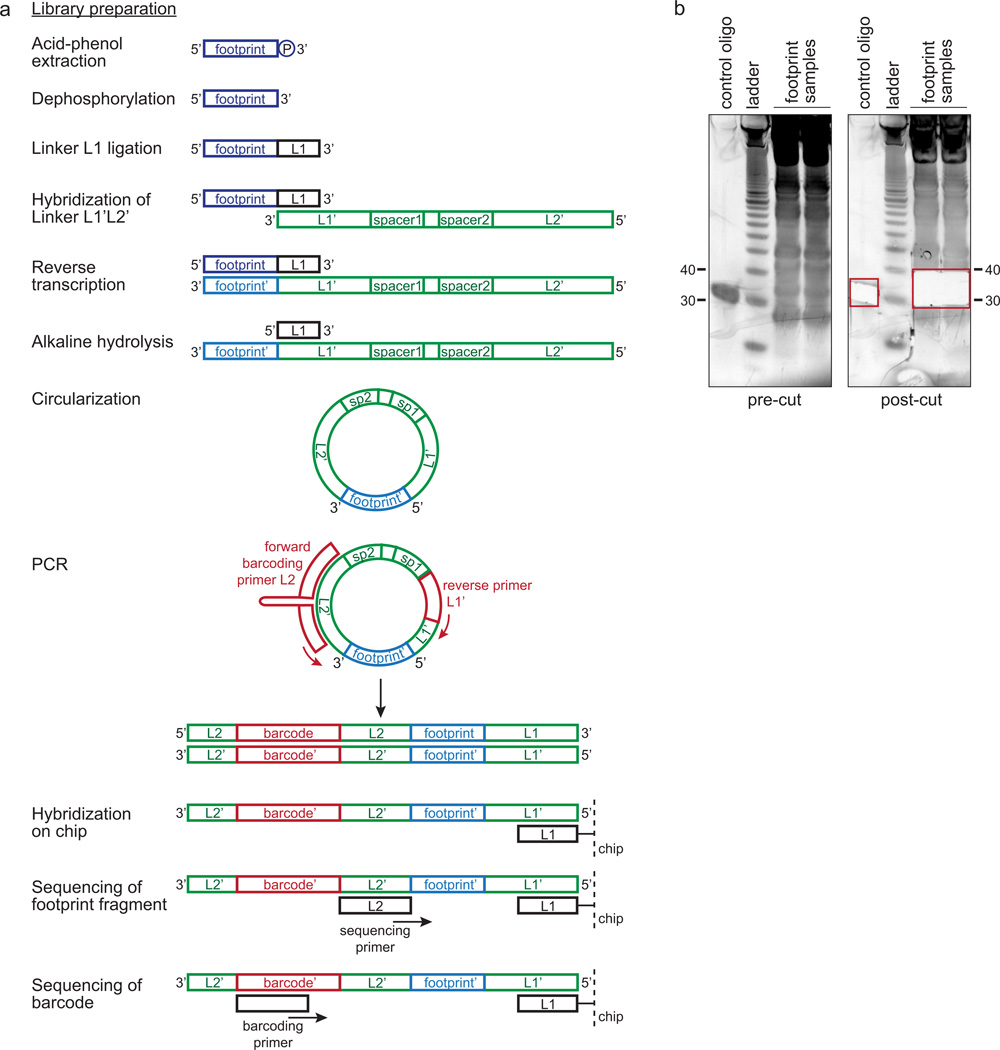
A plethora of factors is involved in the maturation of newly synthesized proteins, including chaperones, membrane targeting factors and enzymes. Many factors act co-translationally through association with ribosome-nascent chain complexes (RNCs), but their target specificities and modes of action remain poorly understood. We developed selective ribosome profiling (SeRP) to identify substrate pools and points of RNC engagement of these factors. SeRP is based on sequencing mRNA fragments covered by translating ribosomes (general ribosome profiling (RP)), combined with a procedure to selectively isolate RNCs whose nascent polypeptides are associated with the factor of interest. Factor-RNC interactions are stabilized by cross-linking; the resulting factor-RNC adducts are nuclease-treated to generate monosomes, and then they are affinity purified. The ribosome-extracted mRNA footprints are converted to DNA libraries for deep sequencing. The protocol is specified for general RP and SeRP in bacteria. It was first applied to the chaperone trigger factor (TF) and is readily adaptable to other co-translationally acting factors, including eukaryotic factors. Factor-RNC purification and sequencing library preparation takes 7-8 d, and sequencing and data analysis can be completed in 5-6 d.


Figures

Figure 1
Figure 1
Outline of the procedure for general ribosome profiling (RP) in bacteria (in black) and selective ribosome profiling (SeRP) of factor–RNCs (in red). * marks the two mutually exclusive options of in vivo and ex vivo crosslinking.
Figure 2
Figure 2
Translatome analyses of cells harvested according to the conventional or the rapid harvesting method. E. coli MC4100 ∆tig::Kan + pTrc-tig-TEV-Avi cells were grown in LB medium and harvested as described in the protocol for conventional (step 1, option A) or rapid harvest (step 1, option C). After lysis, the lysate was crosslinked ex vivo with DSP or EDC (step 7, option B), polysomes were digested, and ribosomes were isolated in a sucrose gradient ultracentrifugation (step 18, option B). Then footprint fragments were isolated and used to prepare a sequencing library (see Supplementary Methods including rRNA depletion). Sequencing was performed on Illumina GAII. Data were analyzed as described in the basic analysis using phred+64 quality score (steps 3540), followed by the specific data analysis (steps 4159). (a) Analysis of gene expression levels performed according to steps 4249. Left and middle panel: two replicates each harvested according to the same method; right panel: comparison of two different harvesting methods. (b) Analysis of read densities along the individual open reading frames of secM and tnaC known to contain native stalling sites. Samples were prepared using EDC as crosslinker. Steps 4244 and 5052 were implemented. Then read densities along secM and tnaC were normalized to the expression level by dividing each position within the open reading frame by the sum of read densities within this open reading frame multiplied with the length of the open reading frame. Orange vertical lines mark start and stop of genes, blue vertical lines represent the position of the native stalling site. (c) Results of the analysis of read densities along all protein coding regions following implementation of steps 4245 and 5055.
Figure 3
Figure 3
The distribution of ribosomes along an average message (Meta-gene analyses) from cells harvested according to the conventional or the rapid harvesting method. Data obtained from translatome samples of E. coli MC4100 ∆tig::Kan + pTrc-tig-TEV-Avi cells harvested via conventional or rapid harvest were prepared and sequenced as described for Fig. 2. (a) Meta-gene analyses from start and stop codon performed according to steps 42–43, 45 and 56–58. (b) TF enrichment efficiency (ratio of interactome and translatome) based on meta-gene analyses from start and stop codon. Here, ribosomes for the interactome sample were isolated in a sucrose cushion centrifugation (step 18, option A) and subjected to affinity purification and TEV cleavage. Meta-gene analyses were calculated separately for interactome and translatome samples as described in (a). For TF enrichment efficiency, the ratio of interactome and translatome was calculated for every position along the average message.
Figure 4
Figure 4
The impact of crosslinking on the purification of TFRNCs. (a,b) Polysome profiles in the absence of crosslinker or after DSP or EDC ex vivo crosslinking and sucrose gradient centrifugation. Depicted are data from experiments in which E. coli MC4100 cells were grown in LB medium and harvested as described in step 1, option C. The lysate was either crosslinked ex vivo with DSP or EDC (step 7, option B) or left untreated (step 7, option A). Undigested (a) and digested (b) lysates were run on a sucrose gradient (step 18, option B). The digestion was performed with a reduced MNase concentration of 15 U/A260 to partially retain di- and trisomes for comparison. ‘30S’ and ‘50S’ depict the peaks of the small and large ribosomal subunits, respectively. The monosome peak is labeled with ‘70S’. To compare polysome profiles quantitatively, the curves were normalized to the same area underneath all ribosomal peaks. (c) Gel analysis of the DSP crosslinker titration. 200 ml of E. coli MC4100 ∆tig::Kan + pTrc-tig-TEV-Avi cells were grown and harvested according to step 1, option A. Cells were resuspended in 2 ml of buffer A (50 mM HEPES pH 7.5, 1 M potassium acetate, 10 mM MgAc2, 1 mM PMSF, 1 mM chloramphenicol, 0.4% Triton X100, 0.1% NP-40, 1 mg/ml lysozyme, 2.5 µg/ml RNase-free DNase I). Lysis and purification of TFRNCs was performed as described including DSP ex vivo crosslinking (step 7, option B) and sucrose cushion centrifugation (step 18, option A) with the following exceptions: For crosslinking either 3 mg of DSP (‘1×’), 15 mg of DSP (‘5×’) or DSMO only (‘−‘) were used. Ultracentrifugation was done with 1 M potassium acetate instead of 1 M NaCl in the sucrose cushion buffer causing the high amount of non-crosslinked TF that copelleted without DSP addition (‘−‘). For AP only half of Strep-Tactin slurry and TEV protease were used. Either non-reducing (‘non-red.’) or reducing (‘red.’) sample buffer was used for SDS-PAGE. Gels were stained with coomassie or used for western blotting employing a polyclonal α-TF antibody. Crosslinks are abbreviated with ‘X’. (d) Gel analysis of the EDC crosslinker titration. E. coli MC4100 ∆tig::Kan + pTrc-tig-TEV-Avi cells were grown in 1 l LB, harvested as described in step 1, option A, and resuspended in 6 ml of lysis buffer. Ex vivo crosslinking (step 7, option B) was performed with 2.5 mM (‘0.125×’), 10 mM (‘0.5×’), 20 mM (‘1×’) and 80 mM (‘4×’) EDC. TF–RNCs were purified as described, including sucrose cushion centrifugation (step 18, option A), eluted from the affinity matrix by boiling in reducing sample buffer, and analyzed by SDS-PAGE or western blotting using polyclonal antibodies against TF and L23. Crosslinks are abbreviated with ‘X’.
Figure 5
Figure 5
Comparison of samples crosslinked in vivo and ex vivo in translatome and interactome analyses. (a) Gel analysis of the TFRNC purification after ex vivo and in vivo crosslinking. For ex vivo crosslinking, E. coli MC4100 ∆tig::Kan + pTrc-tig-TEV-Avi cells grown in LB medium were harvested as described in step 1, option A, and the lysate was crosslinked ex vivo with DSP (step 7, option B). In vivo crosslinking was performed on cells grown in M9 minimal medium (step 1, option B and step 7, option A). After affinity purification and TEV elution, samples were treated with reducing sample buffer before being loaded onto an SDS-PAGE for silver stain and western blots using antibodies against TF and L23. Pictures from ex vivo and in vivo crosslinking were derived from the same gels and blots, but samples in between were cut out for this illustration. Crosslinks are abbreviated with ‘X’. (b,c) Scatter plots of gene expression levels and read densities comparing ex vivo and in vivo crosslinking. E. coli MC4100 ∆tig::Kan + pTrc-tig-TEV-Avi were grown in M9 minimal medium and treated as described in the protocol, including step 1, option B and step 7, option A for in vivo crosslinking, and step 1, option A and step 7, option B for ex vivo crosslinking. Ribosomes were isolated through a sucrose cushion centrifugation (step 18, option A) or sucrose gradient centrifugation (step 18, option B) for interactome and translatome, respectively. All downstream steps were done as described in the protocol and in the legend of Fig. 2, including the calculation of gene expression levels (b) and read densities in protein coding regions (c). Crosslinks are abbreviated with ‘X’.
Figure 6
Figure 6
Comparison of translatome and interactome samples after in vivo and ex vivo crosslinking. Samples crosslinked in vivo and ex vivo were prepared as described in the legend of Fig. 5. Crosslinks are abbreviated with ‘X’. (a) Read densities along individual open reading frames of icd and ompC known to represent native TF substrates were analyzed for translatome and interactome as described in the legend of Fig. 2b. (b,c) Meta-gene analyses for translatomes (b) and TF enrichment efficiencies as the ratios of meta-gene analyses for interactome and translatome (c) were calculated as described in the legend of Fig. 3a and b, respectively.
Figure 7
Figure 7
Footprint fragment lengths and rRNA contamination variation according to digestion conditions. (a) Footprint fragments and rRNA contamination of RNase I digested yeast lysate (data from Ingolia et al.) were plotted according to their lengths as fractions of total reads. (b,c) MNase-digested bacterial footprint fragments derived from translatome (b) or interactome (c) samples were prepared as described in the legend of Fig. 2 without (left panel) and after (right panel) rRNA depletion during the preparation of the deep sequencing library (steps 76-83 in the Supplementary Methods). Read lengths were plotted as fractions of total reads calculated according to step 41.
Figure 8
Figure 8
Impact of salt concentrations on the stability of ribosomes during ribosome purification. (a,b) Comparison of polysome profiles using different salt conditions. E. coli MC4100 cells grown in LB medium were harvested via the rapid harvest protocol (step 1, option C). The lysate was thawed according to step 7, option A and digested with MNase at a concentration of 15 U/A260, as described in the legend of Fig. 4a,b. Digested lysate was loaded onto sucrose gradients (step 18, option B) with different salts or salt concentrations: 100 mM NH4Cl (‘low NH4Cl’), 1 M NH4Cl (‘high NH4Cl’), 100 mM NaCl (‘low NaCl’), and 1 M NaCl (‘high NaCl’). ‘30S’ and ‘50S’ depict the peaks of the small and large ribosomal subunits, respectively. The monosome peak is labeled with ‘70S’. Polysome profiles were normalized to the area under the curves as explained in the legend of Fig. 4a,b. (c–e) Comparison of translatomes prepared under different salt conditions. Lysates were prepared and digested as in (a,b). Digested lysates were loaded onto sucrose cushions containing either 1 M NaCl (‘high NaCl’) or 100 mM NH4Cl (‘low NH4Cl’). Sequencing libraries (without rRNA depletion) were prepared and data were analyzed as described in the protocol. Gene expression levels (c), read densities in protein coding regions (d), and meta-gene analyses (e) were performed as described in in the legends to Fig. 2a, 2c, and 3a, respectively.
Figure 9
Figure 9
Evidence that translating ribosomes can be specifically pulled down with TF. (a) Autoradiograph of a Co-IP experiment with radioactively labeled nascent chains. Radioactive labeling experiments were performed as described in the legend of Supplementary Fig. 1 for sample 1, including controls of non-crosslinked samples and E. coli MC4100 ∆tig::Kan strain. After ultracentrifugation resuspended ribosomes were subjected to IP using 50 µl of a 50% protein A sepharose slurry (GE Healthcare, CL-4B) and 10 µl of a polyclonal α-TF antibody (lab collection). After incubation for 1 h at 4 °C the matrix was washed twice for 10 min each with wash buffer and once with phosphate buffered saline containing 1 mM chloramphenicol and 10 mM MgAc2. TF–RNCs were eluted by boiling in non-reducing (‘non-red.’) or reducing (‘red.’) sample buffer and separated on a 10% tricine gel. The gel was coomassie-stained and dried for autoradiography. (b) Different affinity matrices vary in their efficiency to pull down TF–RNCs. 1 l of MC4100 ∆tig::Kan + pTrc-tig or pTrc-tig-TEV-Avi cells were grown in M9 media to an OD600 of 0.45. Translation was arrested with 1 mM chloramphenicol, followed by in vivo crosslinking using 2.5 mM DSP for 30 min at 37 °C and crosslinker quenching with 20 mM Tris pH 7.5 for 5 min. Cells were harvested by centrifugation and resuspended in 6 ml of buffer B Lysis and nuclease digestion were performed as described in Supplementary Fig. 1. Ultracentrifugation was done as described in step 18, option A with 1 M potassium acetate instead of 1 M NaCl in the sucrose cushion buffer. The pellet was washed once with buffer C and resuspended in 5 ml of buffer C overnight on ice. Ribosomes were split into five aliquots and incubated with different affinity matrices for 1 h at 4 °C on an overhead roller: 120 µl of a 50% slurry of Strep-Tactin sepharose (1) or 120 µl of four different Dynabeads (Invitrogen, # 658.01D), M270 Streptavidin (2), M280 Streptavidin (3), MyOne Streptavidin C1 (4), and MyOne Streptavidin T1 (5). Beads were washed three times with buffer C. TF–RNCs were eluted by boiling in reducing sample buffer and analyzed by SDS-PAGE and western blotting using polyclonal antibodies against TF and L23.
Figure 10
Figure 10
Preparation of a deep sequencing library. (a) Schematic of the library preparation protocol. See text and Supplementary Methods for details. (b) Size selection of footprint fragments. Isolated footprint fragments were loaded on a 15% TBE-urea polyacrylamide gel (steps 18 and following in the Supplementary Methods). The gel was stained with SYBR gold (pre-cut) and the region of interest (marked with the red box) was excised (post-cut). A phosphorylated RNA control oligonucleotide was included as internal control of the method.

References

    1. Pechmann S, Willmund F, Frydman J. The ribosome as a hub for protein quality control. Mol Cell. 2013;49:411–421. - PMC - PubMed
    1. Kramer G, Boehringer D, Ban N, Bukau B. The ribosome as a platform for co-translational processing, folding and targeting of newly synthesized proteins. Nat Struct Mol Biol. 2009;16:589–597. - PubMed
    1. Giglione C, Boularot A, Meinnel T. Protein N-terminal methionine excision. Cell Mol Life Sci. 2004;61:1455–1474. - PMC - PubMed
    1. Starheim KK, Gevaert K, Arnesen T. Protein N-terminal acetyltransferases: when the start matters. Trends Biochem Sci. 2012;37:152–161. - PubMed
    1. Jones JD, O'Connor CD. Protein acetylation in prokaryotes. Proteomics. 2011;11:3012–3022. - PubMed

Publication types

MeSH terms

LinkOut - more resources