. 2013 Nov 8;342(6159):747-9.
doi: 10.1126/science.1242429. Epub 2013 Oct 17.

Identification of genetic variants that affect histone modifications in human cells

Affiliations

Identification of genetic variants that affect histone modifications in human cells

Graham McVicker et al. Science. .

Abstract

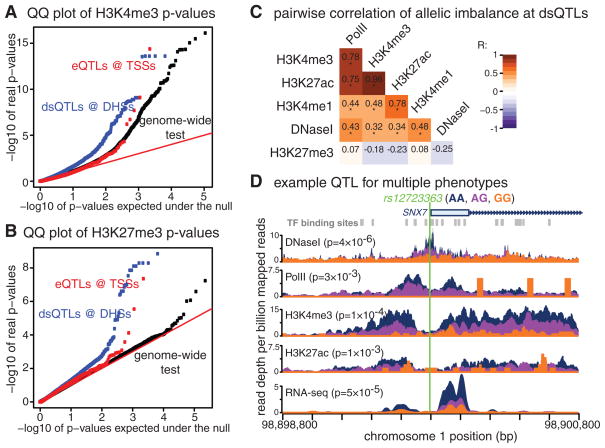
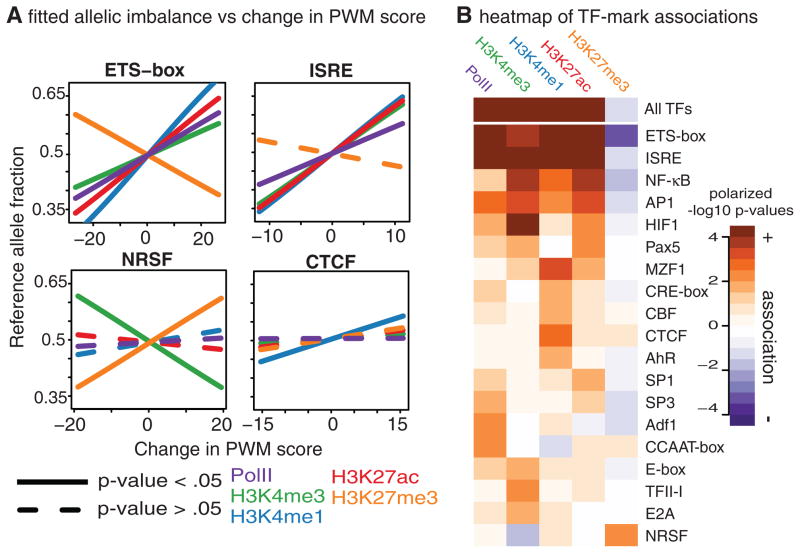
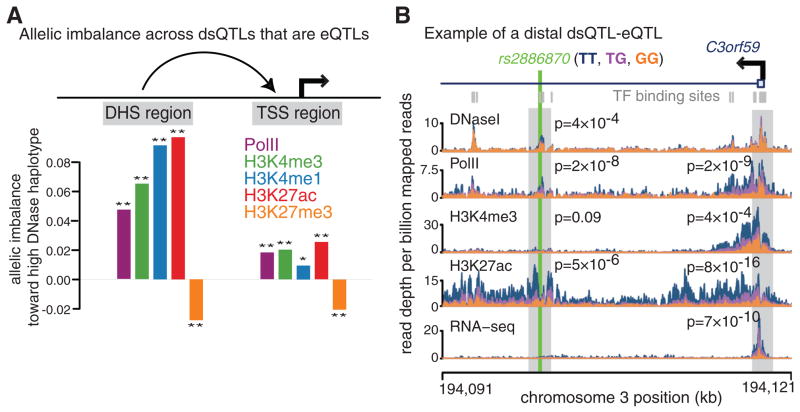
Histone modifications are important markers of function and chromatin state, yet the DNA sequence elements that direct them to specific genomic locations are poorly understood. Here, we identify hundreds of quantitative trait loci, genome-wide, that affect histone modification or RNA polymerase II (Pol II) occupancy in Yoruba lymphoblastoid cell lines (LCLs). In many cases, the same variant is associated with quantitative changes in multiple histone marks and Pol II, as well as in deoxyribonuclease I sensitivity and nucleosome positioning. Transcription factor binding site polymorphisms are correlated overall with differences in local histone modification, and we identify specific transcription factors whose binding leads to histone modification in LCLs. Furthermore, variants that affect chromatin at distal regulatory sites frequently also direct changes in chromatin and gene expression at associated promoters.


Figures

Fig. 1
Fig. 1. Identification of histone mark and RNA polymerase II QTLs
(A) Quantile-quantile plot for H3K4me3 comparing expected to observed −log10 P values from the combined haplotype test. (B) Quantile-quantile plot for H3K27me3. (C) Correlation in allelic imbalance between data types at dsQTLs (*P < 10−3 by likelihood ratio test). (D) An example of a QTL for multiple molecular phenotypes including DNase I sensitivity, gene expression, H3K4me3, H3K27ac, and Pol II levels. The tracks are colored by the genotype of the SNP rs12723363. P values were computed with the combined haplotype test, except for DNase I and RNA-seq, where a linear model (t test) was used.
Fig. 2
Fig. 2. Multiple molecular phenotypes are associated withthe same genetic variants
Panels show aggregate read depth for molecular traits at DNase I–hypersensitive sites(DHSs)associated with dsQTLs or transcription start sites (TSSs) associated with eQTLs. Reads are grouped into high-, medium-, and low-sensitivity genotypes for dsQTLs and high-, medium-, and low-expression genotypes for eQTLs. Plots were made from half of the significant dsQTLs and eQTLs (those with the lowest P values; n=2787 for dsQTLs; n = 638 for eQTLs).
Fig. 3
Fig. 3. Polymorphisms in transcription factor binding sites affect local histone modification
(A) Examples of transcription factor polymorphisms associated with histone marks or Pol II. Each plot shows the estimated relationship between difference in the transcription factor position weight matrix score between alleles (ΔPWM) and allelic imbalance (17). (B) Heatmap showing significance and direction of association between ΔPWM and allelic imbalance of histone marks or Pol II. Only transcription factor clusters with at least one nominally significant association are shown.
Fig. 4
Fig. 4. Histone modification changes at dsQTLs that are also eQTLs
(A) Estimates of allelic imbalance for histone marks and Pol II across DNase I hypersensitive sites (DHSs; n = 239) and transcription start sites (TSSs; n = 246) from joint dsQTL-eQTLs (17). (*) and (**) indicate that allelic imbalance is significantly different from 0 with P < 0.05 and P < 0.01, respectively (by likelihood ratio test). (B) An example of a dsQTL-eQTL. The SNP rs2886870 disrupts a NF-κB binding site and is significantly associated with local DNase sensitivity, H3K27ac, and Pol II levels. The SNP is also significantly associated with gene expression, H3K27ac, H3K4me3, and Pol II levels at a distal promoter (>18 kb away). P values are from the combined haplotype test, except for DNase I and RNA-seq, where linear regression and t tests were used. Read depth tracks are aggregated and colored by the genotype of rs2886870.

Comment in

References

    1. ENCODE Project Consortium. Nature. 2012;489:57–74. - PMC - PubMed
    1. Ernst J, et al. Nature. 2011;473:43–49. - PMC - PubMed
    1. Schaub MA, Boyle AP, Kundaje A, Batzoglou S, Snyder M. Genome Res. 2012;22:1748–1759. - PMC - PubMed
    1. Kouzarides T. Cell. 2007;128:693–705. - PubMed
    1. Bernstein BE, et al. Cell. 2006;125:315–326. - PubMed

Publication types

MeSH terms

Associated data