. 2014 Feb;25(2):316-28.
doi: 10.1681/ASN.2013040367. Epub 2013 Oct 17.

Renal cells from spermatogonial germline stem cells protect against kidney injury

Affiliations

Renal cells from spermatogonial germline stem cells protect against kidney injury

Letizia De Chiara et al. J Am Soc Nephrol. 2014 Feb.

Abstract

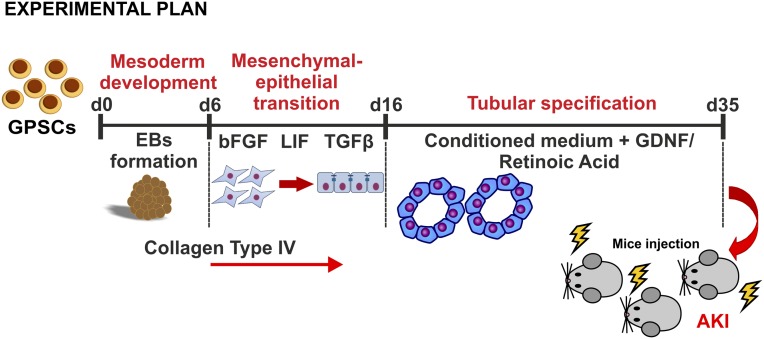
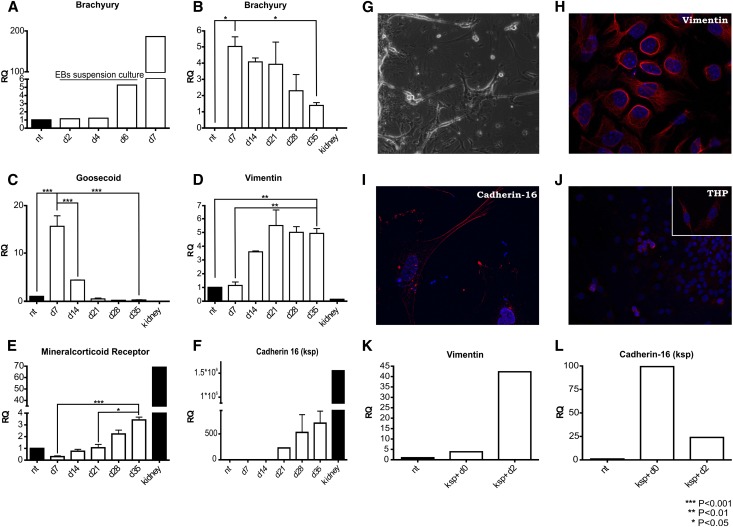
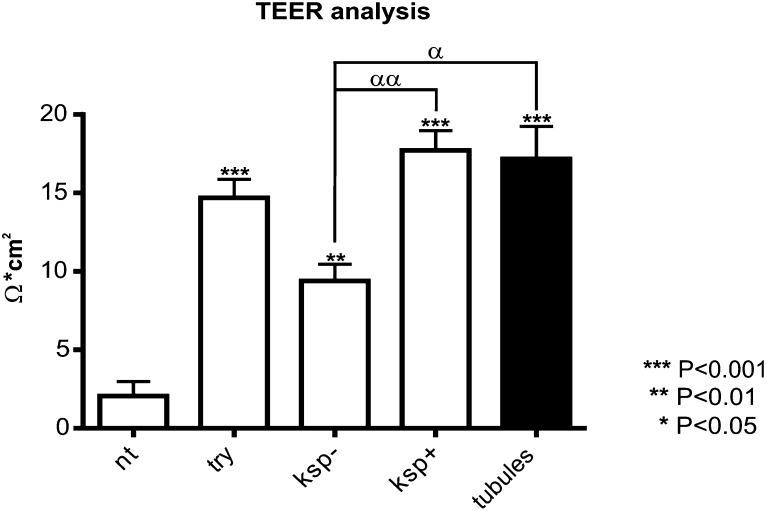
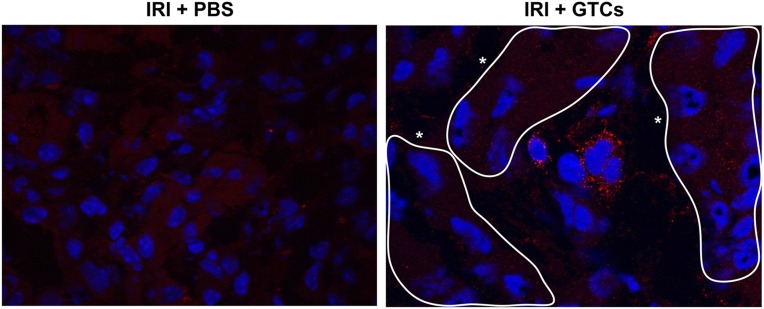
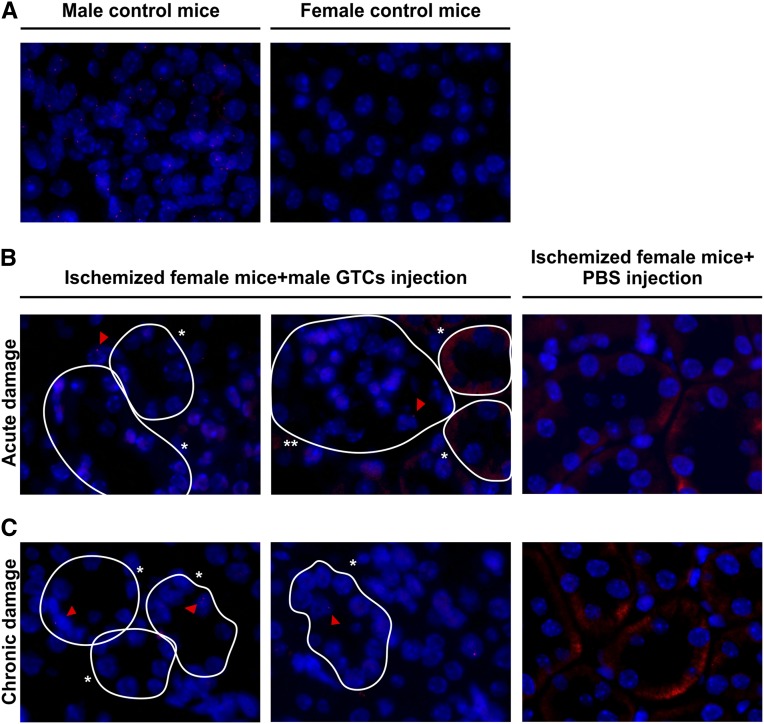
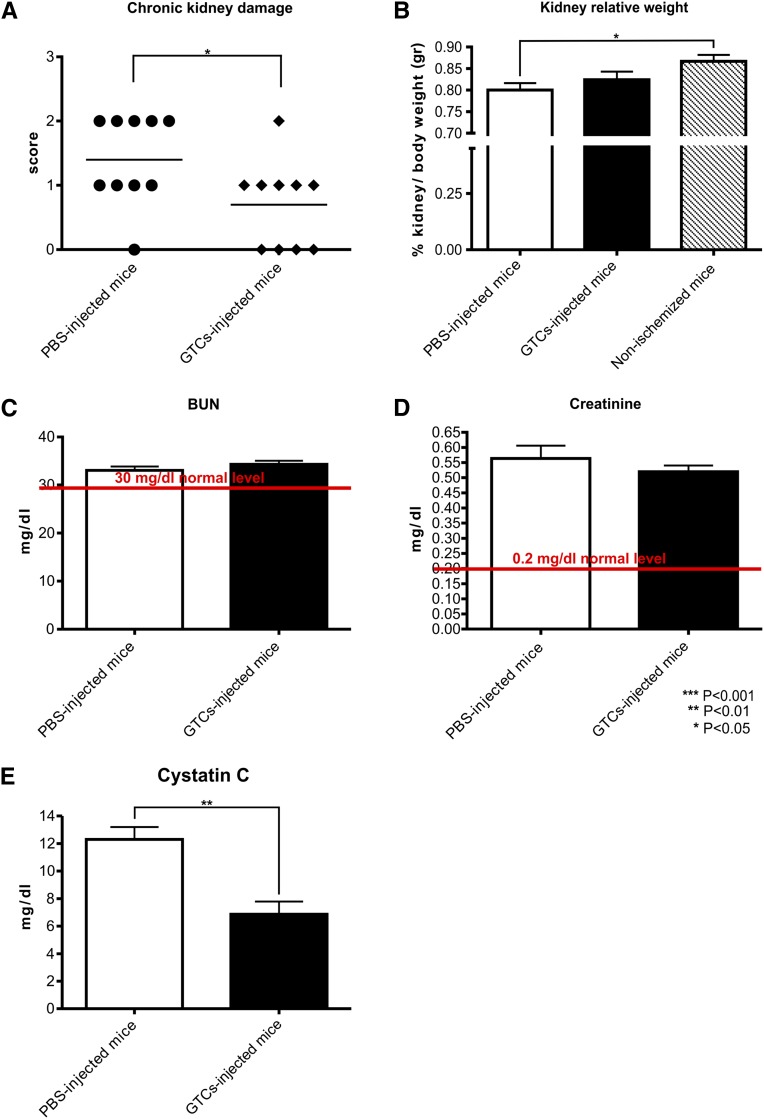
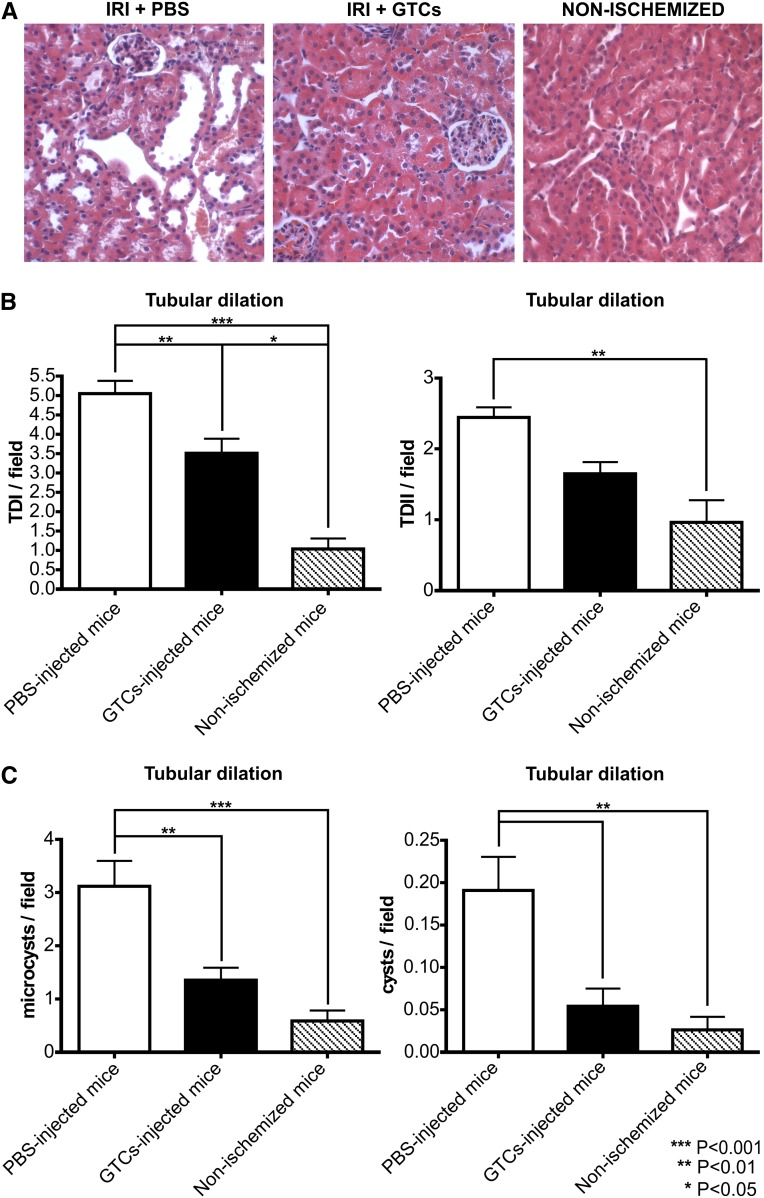
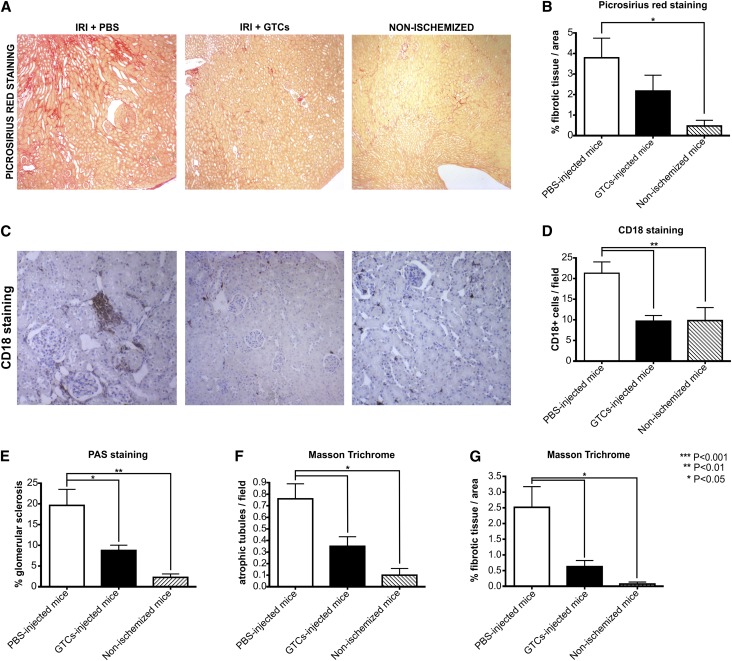
Spermatogonial stem cells reside in specific niches within seminiferous tubules and continuously generate differentiating daughter cells for production of spermatozoa. Although spermatogonial stem cells are unipotent, these cells are able to spontaneously convert to germline cell-derived pluripotent stem cells (GPSCs) in vitro. GPSCs have many properties of embryonic stem cells and are highly plastic, but their therapeutic potential in tissue regeneration has not been fully explored. Using a novel renal epithelial differentiation protocol, we obtained GPSC-derived tubular-like cells (GTCs) that were functional in vitro, as demonstrated through transepithelial electrical resistance analysis. In mice, GTCs injected after ischemic renal injury homed to the renal parenchyma, and GTC-treated mice showed reduced renal oxidative stress, tubular apoptosis, and cortical damage and upregulated tubular expression of the antioxidant enzyme hemeoxygenase-1. Six weeks after ischemic injury, kidneys of GTC-treated mice had less fibrosis and inflammatory infiltrate than kidneys of vehicle-treated mice. In conclusion, we show that GPSCs can be differentiated into functionally active renal tubular-like cells that therapeutically prevent chronic ischemic damage in vivo, introducing the potential utility of GPSCs in regenerative cell therapy.


Figures

Figure 1.
Figure 1.
Experimental plan shows that GPSCs are differentiated toward renal tubular cells and injected in IRI mice after 35 days. FGF, fibroblast growth factor; GDNF, glial cell–derived neurotrophic factor.
Figure 2.
Figure 2.
GTCs show a renal tubular epithelial phenotype. RNA was extracted at different time points, and real-time PCR analysis (A–F) was performed. The mesodermal marker Brachyury began to be expressed after 6 days in suspension (A) and decreased during the culture (B). Goosecoid, another mesodermal marker, is undetectable starting from day 21 (C). Vimentin, a marker of mesenchymal-derived cells, is stably expressed for the whole duration of the culture (D). Mineralocorticoid receptor (E) and cadherin-16/KSP (F) are expressed consistently from day 21 until day 35 of the EB culture. Each column refers to three independent samples. Tubular-like structures (G) appear spontaneously after 21 days in culture (original magnification ×100). We assessed the expression of vimentin (H), KSP (I), and THP (J) through immunofluorescence staining. Nuclei were counterstained in DAPI. (Original magnification: THP ×400, vimentin/KSP ×630.) Finally, we evaluated the expression pattern of KSP+ cells. After 2 days in the absence of EB environment, cells start to dedifferentiate, as demonstrated by the decrease of cadherin-16/KSP (L) and the increase of vimentin (K) expression. (KSP+ d0: RNA was extracted immediately after isolation; KSP+ d2: RNA was extracted 2 days after cells isolation.) Data are presented as mean ± SEM.
Figure 3.
Figure 3.
GTCs are functional epithelial cells. The panel (A) shows the measure of TEER among different fractions of cells. It is representative of three independent experiments (n=4 each column). The asterisks represents the statistical difference between every fraction and undifferentiated GSPC (NT) fraction. α represents statistically relevant difference among cells fractions with the exception of NT fraction. Data are presented as mean ± SEM. KSP+, cells recovered from MACS; KSP, unbound, negative fraction recovered from MACS; try, whole EBs trypsinized and replated.
Figure 4.
Figure 4.
GTCs do not form teratomas in vivo. Representative hematoxylin and eosin staining of teratoma formation assay in the left kidney of mice injected with GPSCs (A) and GTCs after 42 days of differentiation (B). The images show the lack of teratoma formation in mice injected with GTCs, whereas mice injected with undifferentiated GPSCs show a prominent teratoma. *Same region of the two kidneys. (Original magnification ×40.)
Figure 5.
Figure 5.
GTCs are able to reach the injured kidney and migrate in the renal parenchyma. GTCs labeled with CFSE are present in renal parenchyma 48 hours after ischemia. CFSE+ cells are found to be localized among the tubules. No signal is detected in PBS-injected mice. *Tubules. CFSE+ cells are revealed with a secondary antibody Alexa 565; nuclei are counterstained with DAPI. (Original magnification ×630.)
Figure 6.
Figure 6.
GTCs Y+ cells are detected in different site of renal parenchyma in acute and chronic experiments. The upper panel (A) shows a positive control on the left and a negative control on the right, demonstrating that the probe for Y chromosome is specific. After 48 hours (acute damage), the cells are mostly in the glomeruli and in the interstitial space between tubules (B). *Tubules; **glomeruli. Six weeks after ischemia (chronic damage), GTCs Y+ cells are detected in the tubular structures (C), indicating that GTCs are able to home and engraft the damaged renal tubules. Ischemized female mice injected with PBS do not show any positive signal. (Original magnification, ×1000; nuclei are counterstained with DAPI.) Red triangles indicate the red spot of the Y chromosome.
Figure 7.
Figure 7.
GTCs protect kidney from AKI through HO-1 upregulation. BUN and creatinine (A) levels in the blood of mice injected with GTCs are significantly lower than those in mice injected with PBS. GTC-injected mice show a reduction of cortical damage (B), as shown by periodic acid–Schiff staining (original magnification, ×200) compared with PBS-injected mice. GTC-treated mice also show a lower incidence of tubular necrosis (C) than PBS-injected mice; the left chart indicates incidence of CAST formation, and the right chart represents the total number of necrotic tubules (tubules undergoing necrosis plus CAST). HO-1 is upregulated in GTC-treated mice compared with PBS-injected mice (D), and apoptotic ratio is decreased (E) (original magnification: HO-1, ×100; TUNEL staining, ×630). The lower panel represents the quantification of HO-1+ (F) tubules and apoptotic cells (G). Data are presented as mean ± SEM. (GTC-injected mice, n=8; PBS-injected mice, n=8.)
Figure 8.
Figure 8.
Mice injected with GTCs are protected against CKD development. The score (A) shows that ischemized mice injected with PBS are more prone to develop a chronic disease. The relative kidney weight (B) does not differ between mice treated with GTCs and those treated with PBS, but it is decreased in mice injected only with PBS compared with the control nonischemizedmice. The relative percentage of kidney weight is evaluated on the total body weight of the mice. BUN (C) and creatinine (D) analysis shows no difference between mice injected or not injected with GTCs 6 weeks after ischemia. BUN returns to normal level whereas creatinine remains slightly higher. Cystatin C (E) is downregulated in mice injected with GTCs compared with mice injected with PBS (PBS-injected mice, n=10; GTC-injected mice, n=10; nonischemized mice, n=4). Data are presented as mean ± SEM.
Figure 9.
Figure 9.
Mice injected with GTCs do not showtubular dilation. Representative hematoxylin and eosin staining (A) of kidney cortical sections of ischemized mice 6 weeks after ischemia and of a healthymouse (original magnification, ×200). The charts below show the quantification of tubular dilation (B and C). In particular, the amount of microcysts and cysts in mice injected with GTCs is similar to that in nonischemized healthy mice (PBS-injected mice, n=10; GTC-injected mice, n=10; nonischemized mice, n=4). Data are presented as mean ± SEM.
Figure 10.
Figure 10.
GTCs injection in mice prevent renal fibrogenesis. The upper panel (A) shows three representative pictures of fibrotic tissue in ischemized mice and healthy nonischemized mice, stained with picrosirius red. The lower panel (C) shows, for the same mice, the presence of infiltrating CD18+ cells and quantification of infiltrating cells per field (D). (Original magnification: picrosirius red, ×40; CD18+, ×100.) The quantification of fibrogenesis (B) is performed through MetaMorph software, and results are expressed as the mean ratio of the stained area to the total tissue area. Evaluation of renal fibrotic area on Masson trichrome staining (G) confirms the result obtained with picrosirius red staining. Glomerular sclerosis (E) and tubular atrophy are also evaluated (F). The number of sclerotic glomeruli and atrophic tubules is significantly decreased in the ischemized mice injected with GTCs compared with PBS-injected mice. (PBS-injected mice, n=10; GTC-injected mice, n=10; nonischemized mice, n=4.) Data are presented as mean ± SEM. CD18+ is the marker for all the infiltrating cells.

Similar articles

Cited by

References

    1. Bonventre JV, Yang L: Cellular pathophysiology of ischemic acute kidney injury. J Clin Invest 121: 4210–4221, 2011 - PMC - PubMed
    1. Eltzschig HK, Eckle T: Ischemia and reperfusion—from mechanism to translation. Nat Med 17: 1391–1401, 2011 - PMC - PubMed
    1. Takahashi K, Yamanaka S: Induction of pluripotent stem cells from mouse embryonic and adult fibroblast cultures by defined factors. Cell 126: 663–676, 2006 - PubMed
    1. Stadtfeld M, Apostolou E, Akutsu H, Fukuda A, Follett P, Natesan S, Kono T, Shioda T, Hochedlinger K: Aberrant silencing of imprinted genes on chromosome 12qF1 in mouse induced pluripotent stem cells. Nature 465: 175–181, 2010 - PMC - PubMed
    1. Lister R, Pelizzola M, Kida YS, Hawkins RD, Nery JR, Hon G, Antosiewicz-Bourget J, O’Malley R, Castanon R, Klugman S, Downes M, Yu R, Stewart R, Ren B, Thomson JA, Evans RM, Ecker JR: Hotspots of aberrant epigenomic reprogramming in human induced pluripotent stem cells. Nature 471: 68–73, 2011 - PMC - PubMed

Publication types

MeSH terms