. 2014 Jan;42(1):e5.
doi: 10.1093/nar/gkt908. Epub 2013 Oct 16.

Scanning fluorescence correlation spectroscopy techniques to quantify the kinetics of DNA double strand break repair proteins after γ-irradiation and bleomycin treatment

Affiliations

Scanning fluorescence correlation spectroscopy techniques to quantify the kinetics of DNA double strand break repair proteins after γ-irradiation and bleomycin treatment

Salim Abdisalaam et al. Nucleic Acids Res. 2014 Jan.

Abstract

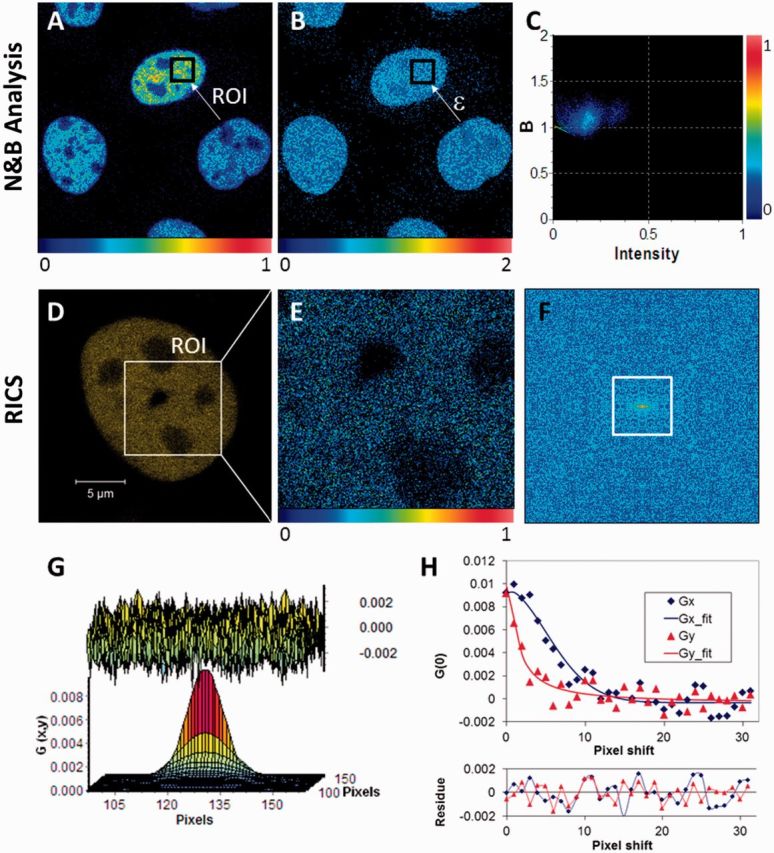
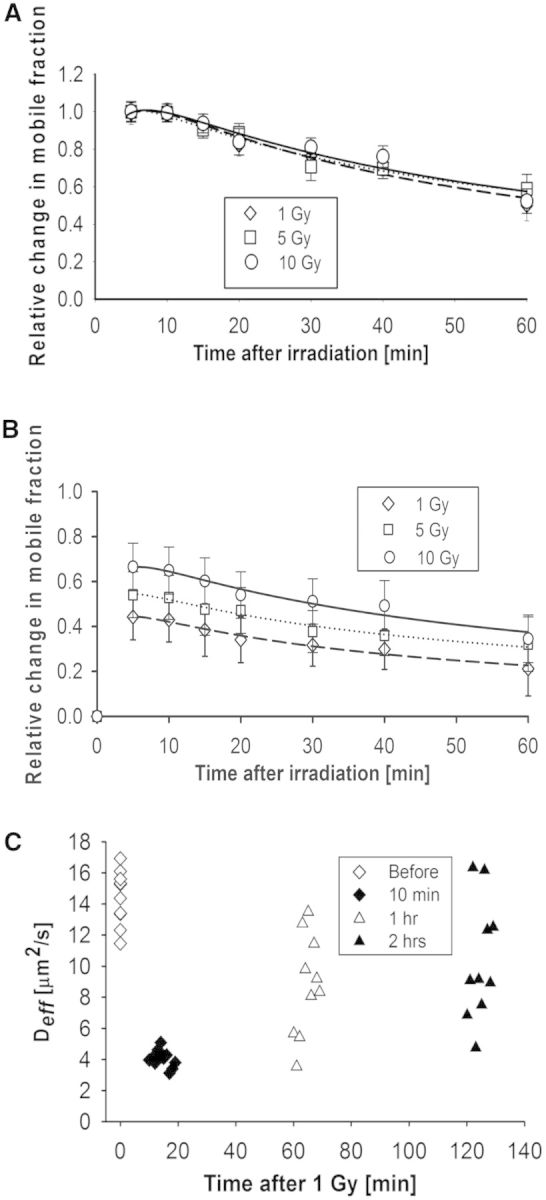
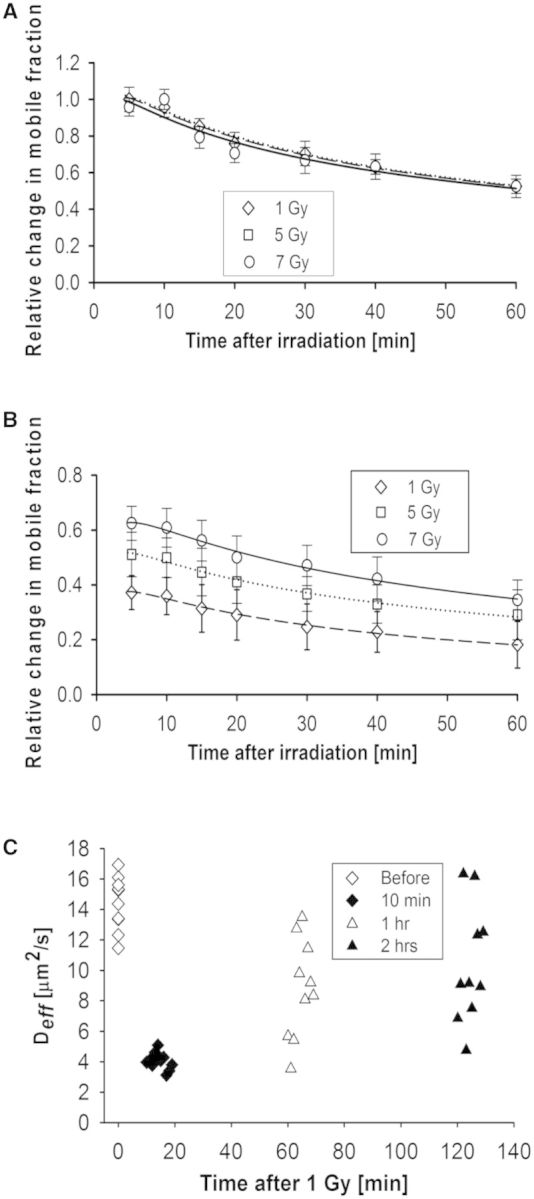
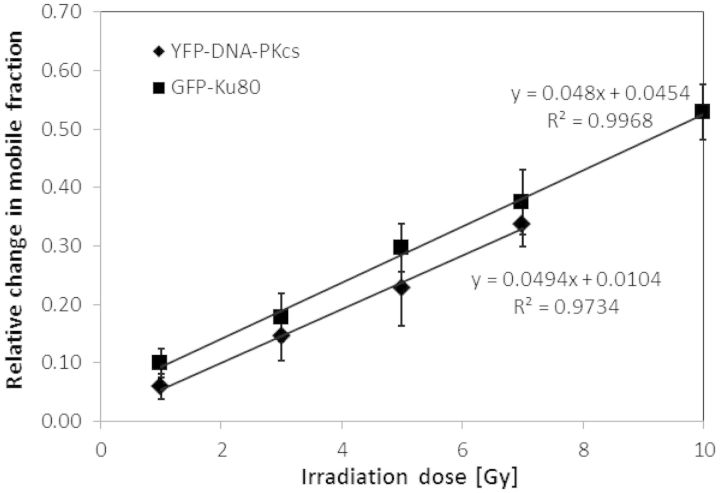
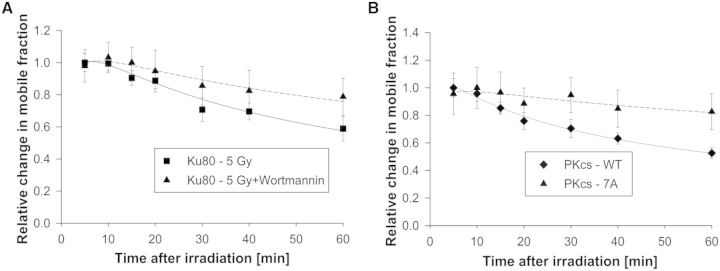
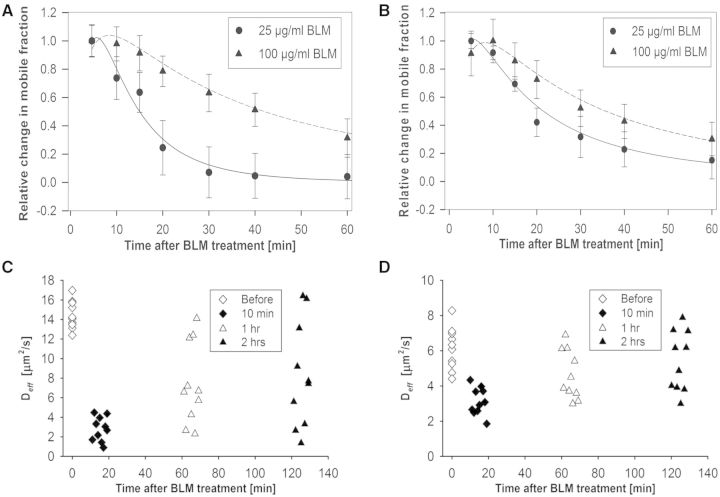
A common feature of DNA repair proteins is their mobilization in response to DNA damage. The ability to visualizing and quantifying the kinetics of proteins localizing/dissociating from DNA double strand breaks (DSBs) via immunofluorescence or live cell fluorescence microscopy have been powerful tools in allowing insight into the DNA damage response, but these tools have some limitations. For example, a number of well-established DSB repair factors, in particular those required for non-homologous end joining (NHEJ), do not form discrete foci in response to DSBs induced by ionizing radiation (IR) or radiomimetic drugs, including bleomycin, in living cells. In this report, we show that time-dependent kinetics of the NHEJ factors Ku80 and DNA-dependent protein kinase catalytic subunits (DNA-PKcs) in response to IR and bleomycin can be quantified by Number and Brightness analysis and Raster-scan Image Correlation Spectroscopy. Fluorescent-tagged Ku80 and DNA-PKcs quickly mobilized in response to IR and bleomycin treatments consistent with prior reports using laser-generated DSBs. The response was linearly dependent on IR dose, and blocking NHEJ enhanced immobilization of both Ku80 and DNA-PKcs after DNA damage. These findings support the idea of using Number and Brightness and Raster-scan Image Correlation Spectroscopy as methods to monitor kinetics of DSB repair proteins in living cells under conditions mimicking radiation and chemotherapy treatments.


Figures

Figure 1.
Figure 1.
Pictorial description of the N&B analysis and RICS methods. (A) Relative fluorescence intensity (scale 0–1) image of Xrs6 cells expressing GFP-Ku80. The inset (arrow) indicates a typical user-selected ROI, the time series intensity data of which is processed by Equation 1 to determine the molecular number (n). (B) The molecular brightness (ε) map, obtained after processing the image in (A) with Equation 2, indicating an even distribution of molecular brightness throughout the nucleus despite differences in protein concentration between cells as seen in (A). These brightness values [B (scale 0–2)] can be converted to photon counts per molecule per second by calculating (B − 1)/(pixel dwell time). (C) The 2D histogram of (B) versus intensity for the ROI shown in (A) and (B). The spread of the points indicates pixel variance, which shows a predominantly unimodal distribution. (D) Confocal image of a V3 cell expressing YFP-DNA-PKcs with the inset showing a region of the nucleus selected for RICS measurement. (E) Snapshot of the time-averaged fluorescence intensity image of the selected ROI on which RICS analysis was then to be applied (relative intensity scale 0–1). (F) Image of the 2D RICS data (256 × 256 pixels) obtained after applying Equation 5. (G) Fitting of the 2D RICS data (64 × 64 pixels) obtained from inset in (F) using Equation 6 (top, the fit residuals). (H) Simultaneous plot of 1D cross-sections of the 2D RICS data along the x and y directions along with corresponding fit data (bottom, the fit residuals). The data extend for 32 pixels along each direction as indicated by the white square in (F).
Figure 2.
Figure 2.
Quantification of GFP-Ku80 kinetics by N&B analysis and RICS. (A) Change in GFP-Ku80 relative mobile fraction as a function of time inside the nucleus of Xrs6 cells that were irradiated at different doses (1 Gy: diamonds, 5 Gy: squares, 10 Gy: circles). The error bars represent the standard error to the mean calculated from 10 different cells. Smooth curve fits to the data points for each dose (1 Gy: dashes, 5 Gy: dots, 10 Gy: solid) are also shown. (B) As in (A), but without normalizing data to the ∼5 min peak so as to illustrate the dose dependence. (C) Variation of Deff for GFP-Ku80 in Xrs6 cells; the average value was 14.42 ± 1.75 μm2/s before 1 Gy of γ-irradiation, 4.02 ± 0.57 μm2/s at 10 min, 8.77 ± 3.68 μm2/s at 1 h and 10.36 ± 3.88 μm2/s at 2 h post-irradiation.
Figure 3.
Figure 3.
Quantification of YFP-DNA-PKcs kinetics by N&B analysis and RICS. (A) Change in YFP-DNA-PKcs relative mobile fraction as a function of time post-irradiation for V3 cells irradiated at different doses (1 Gy: diamonds, 5 Gy: triangles, 7 Gy: circles). The error bars represent the standard error to the mean calculated from 10 different cells. Smooth curve fits to the data points for each dose (1 Gy: dashes, 5 Gy: dots, 10 Gy: solid) are also shown. (B) As in (A), but without normalizing data to ∼5 min peak so as to illustrate the dose dependence. (C) Variation of Deff for YFP-DNA-PKcs in V3 cells; the average value was 6.17 ± 0.49 μm2/s before 1 Gy of γ-irradiation, 3.35 ± 1.08 μm2/s at 10 min, 4.80 ± 1.09 μm2/s at 1 h and 5.39 ± 1.23 μm2/s at 2 h post-irradiation.
Figure 4.
Figure 4.
The change in repair protein mobile fraction is linearly dependent with γ-irradiation dose. The change in mobile fraction at the ∼5 min peak time post-irradiation is shown for YFP-DNA-PKcs (squares) and GFP-Ku80 (diamonds) along with the corresponding linear fits and R2 values. The error bars represent the standard error to the mean calculated from 10 different cells.
Figure 5.
Figure 5.
Quantification of GFP-Ku80 and YFP-DNA-PKcs kinetics by N&B analysis under repair-inhibited conditions. (A) Change in GFP-Ku80 relative mobile fraction as a function of time post-irradiation for Xrs6 cells irradiated with 5 Gy (squares) and for the same cells irradiated with the same dose after exposure to Wortmannin (triangles). The error bars represent the standard error to the mean calculated from 10 different cells. (B) Change in relative mobile fraction of wild-type (WT) YFP-DNA-PKcs as a function of time post-irradiation for V3 cells irradiated with 1 Gy and corresponding kinetics for the 7A-DNA-PKcs phosphorylation mutant for the same dose.
Figure 6.
Figure 6.
Quantification of GFP-ku80 and YFP-DNA-PKcs kinetics by N&B analysis and RICS after bleomycin treatment. (A) Change in GFP-Ku80 relative mobile fraction as a function of time inside the nucleus of Xrs6 cells that were treated with different bleomycin doses (25 μg/ml: circles, 100 μg/ml: triangles). (B) Change in YFP-DNA-PKcs relative mobile fraction as a function of time inside the nucleus of V3 cells that were treated with different bleomycin doses (25 μg/ml: circles, 100 μg/ml: triangles). The error bars in both top panels represent the standard error to the mean calculated from 10 different cells. (C) Variation of Deff for GFP-Ku80 as a function of time after bleomycin treatment; the average value was 14.57 ± 1.41 μm2/s before treatment, 2.17 ± 1.58 μm2/s at 10 min, 7.75 ± 4.35 μm2/s at 1 h and 9.02 ± 5.78 μm2/s at 2 h post-treatment. (D) Variation of Deff for YFP-DNA-PKcs as a function of time after bleomycin treatment; the average value was 6.13 ± 1.19 μm2/s before bleomycin treatment, 3.13 ± 0.78 μm2/s at 10 min, 4.64 ± 1.38 μm2/s at 1 h and 5.41 ± 1.71 μm2/s at 2 h post-treatment.

Similar articles

Cited by

References

    1. Khanna KK, Jackson SP. DNA double-strand breaks: signaling, repair and the cancer connection. Nat. Genet. 2001;27:247–254. - PubMed
    1. Hoeijmakers JH. Genome maintenance mechanisms for preventing cancer. Nature. 2001;411:366–374. - PubMed
    1. Burma S, Chen BP, Chen DJ. Role of non-homologous end joining (NHEJ) in maintaining genomic integrity. DNA Repair. 2006;5:1042–1048. - PubMed
    1. Davis AJ, Chen DJ. DNA double strand break repair via non-homologous end-joining. Transl. Cancer Res. 2013;2:130–143. - PMC - PubMed
    1. Mari PO, Florea BI, Persengiev SP, Verkaik NS, Bruggenwirth HT, Modesti M, Giglia-Mari G, Bezstarosti K, Demmers JA, Luider TM, et al. Dynamic assembly of end-joining complexes requires interaction between Ku70/80 and XRCC4. Proc. Natl Acad. Sci. USA. 2006;103:18597–18602. - PMC - PubMed

Publication types

MeSH terms