

doi: 10.1093/neuonc/not151.
CBTRUS statistical report: Primary brain and central nervous system tumors diagnosed in the United States in 2006-2010
- PMID: 24137015
- PMCID: PMC3798196
- DOI: 10.1093/neuonc/not151
Item in Clipboard
CBTRUS statistical report: Primary brain and central nervous system tumors diagnosed in the United States in 2006-2010
Neuro Oncol.
2013 Nov.
Erratum in
- Neuro Oncol. 2014 May;16(5):760
No abstract available
Figures
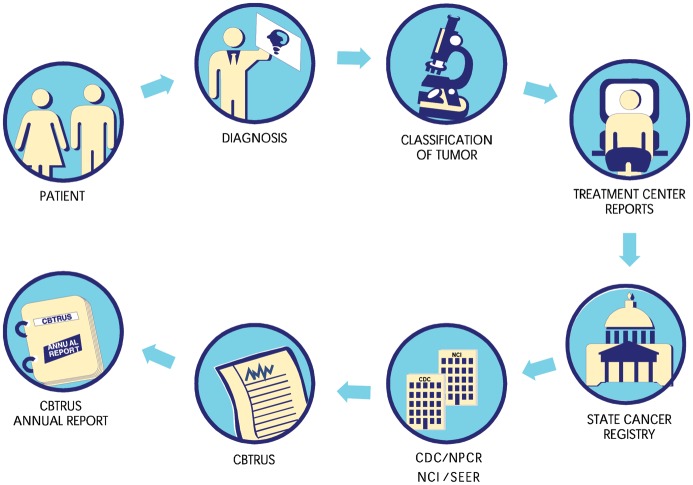
Schematic of Cancer Registration Process
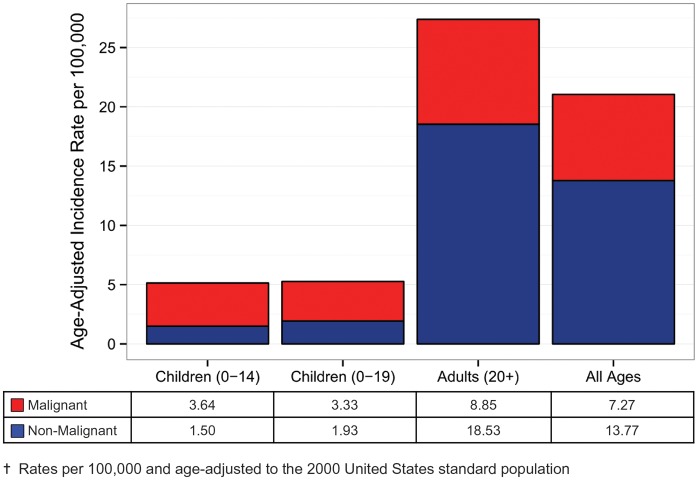
Average Annual Age-Adjusted Incidence Rates† of Primary Brain and CNS Tumors by Age and Behavior, CBTRUS Statistical Report: NPCR and SEER data from 2006-2010
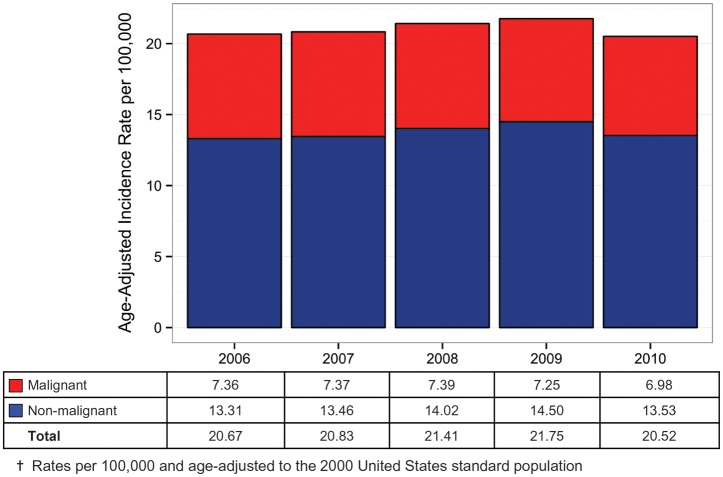
Annual Age-Adjusted Incidence Rates† of Primary Brain and CNS Tumors by Year and Behavior, CBTRUS Statistical Report: NPCR and SEER data from 2006-2010
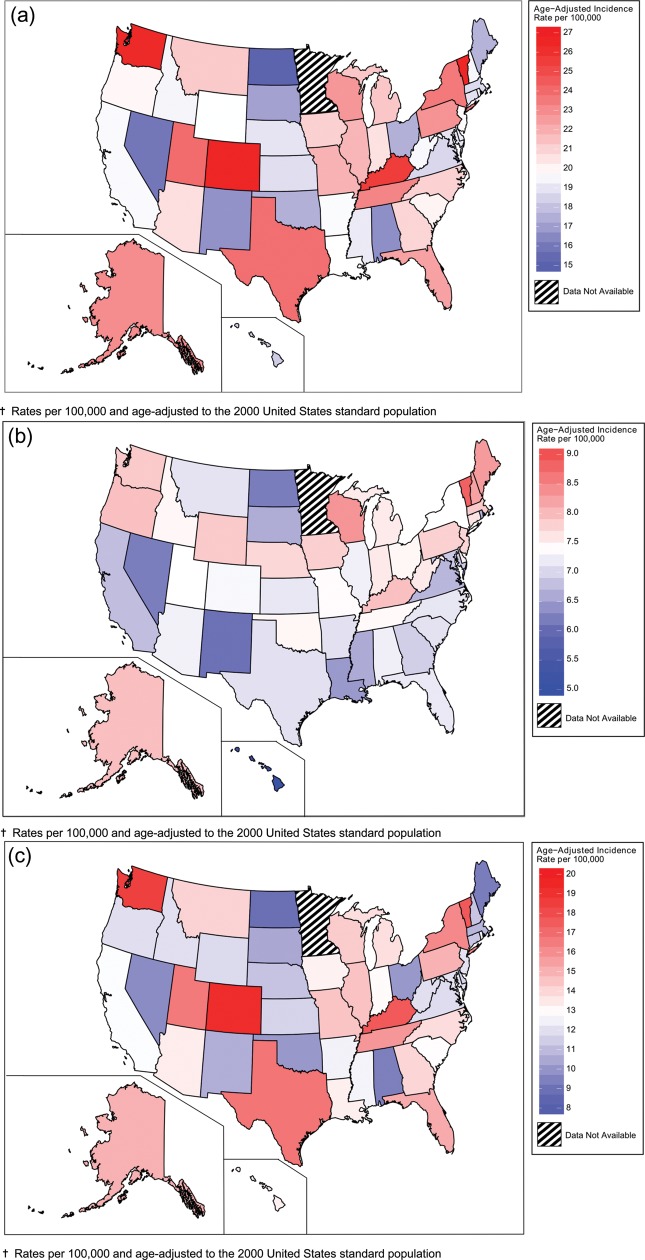
(a) Average Annual Age-Adjusted Incidence Rates† of Primary Brain and CNS Tumors by Central Cancer Registry and Behavior, CBTRUS Statistical Report: NPCR and SEER, 2006-2010 (b) Average Annual Age-Adjusted Incidence Rates† of Malignant Primary Brain and CNS Tumors by Central Cancer Registry and Behavior, CBTRUS Statistical Report: NPCR and SEER, 2006-2010 (c) Average Annual Age-Adjusted Incidence Rates† of Non-Malignant Primary Brain and CNS Tumors by Central Cancer Registry and Behavior, CBTRUS Statistical Report: NPCR and SEER, 2006-2010
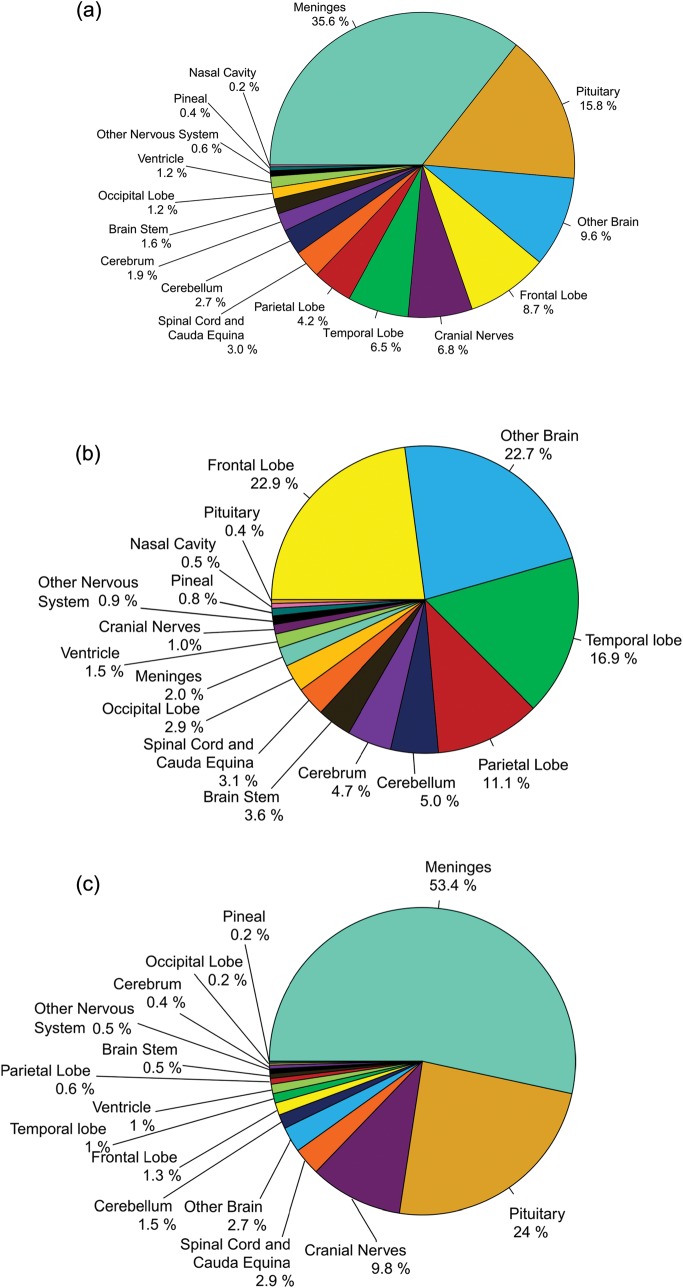
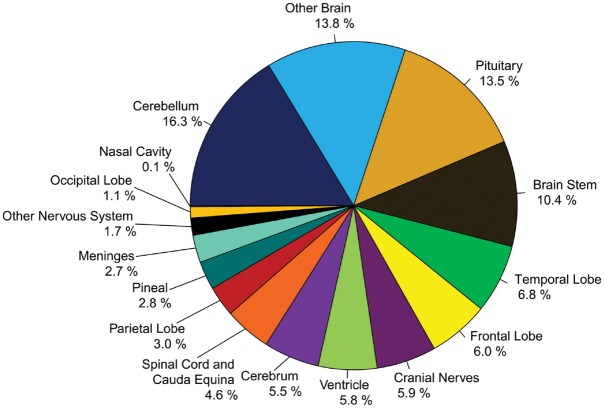
(a) Distribution of Primary Brain and CNS Tumors by Site (N = 326,711), CBTRUS Statistical Report: NPCR and SEER, 2006-2010 (b) Distribution of Malignant Primary Brain and CNS Tumors by Site (N = 112,458), CBTRUS Statistical Report: NPCR and SEER, 2006-2010 (c) Distribution of Non-Malignant Primary Brain and CNS Tumors by Site (N = 214,253), CBTRUS Statistical Report: NPCR and SEER, 2006-2010
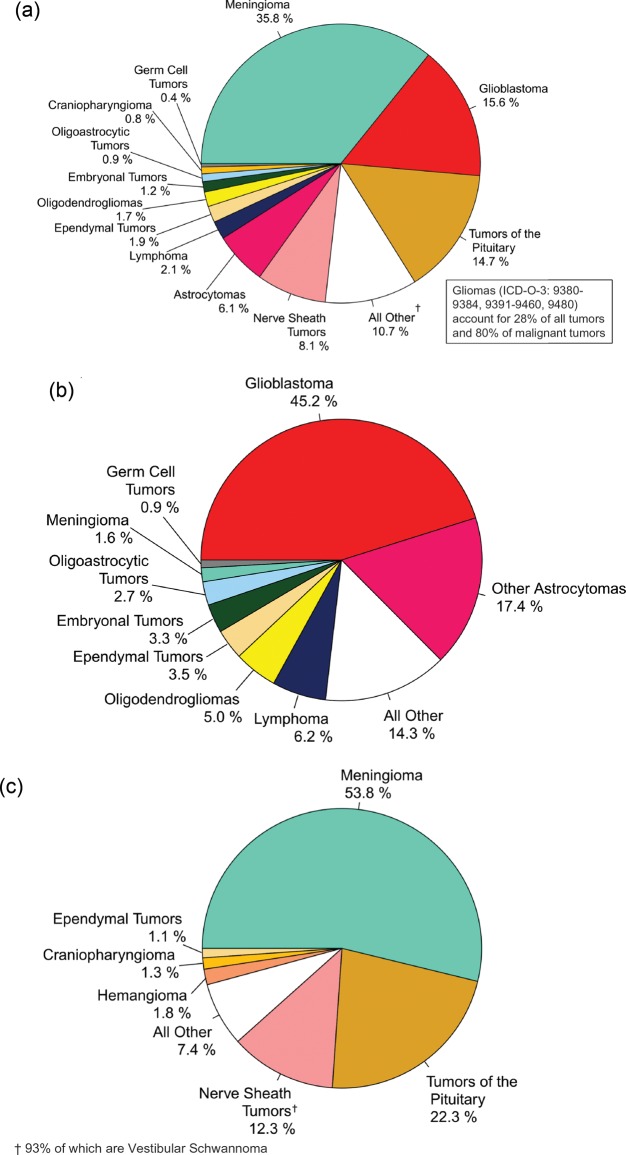
(a) Distribution of Primary Brain and CNS Tumors by Histology (N = 326,711), CBTRUS Statistical Report: NPCR and SEER, 2006-2010 (b) Distribution of Malignant Primary Brain and CNS Tumors by Histology (N = 112,458), CBTRUS Statistical Report: NPCR and SEER, 2006-2010 (c) Distribution of Non-Malignant Primary Brain and CNS Tumors by Histology (N = 214,253), CBTRUS Statistical Report: NPCR and SEER, 2006-2010
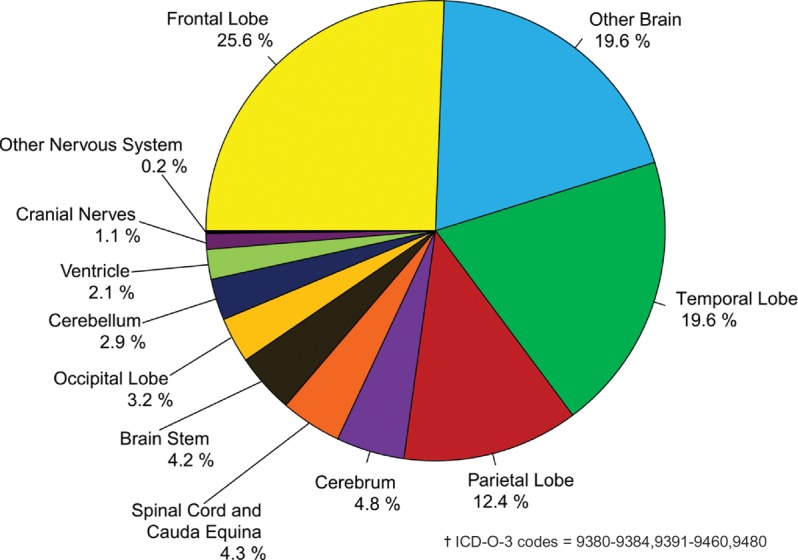
Distribution of Primary Brain and CNS Gliomas† by Site (N = 92,504), CBTRUS Statistical Report: NPCR and SEER, 2006-2010
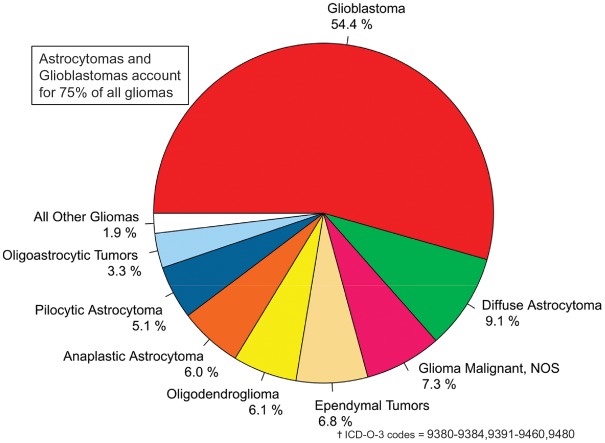
Distribution of Primary Brain and CNS Gliomas† by Histology Subtypes (N = 92,504), CBTRUS Statistical Report: NPCR and SEER, 2006-2010
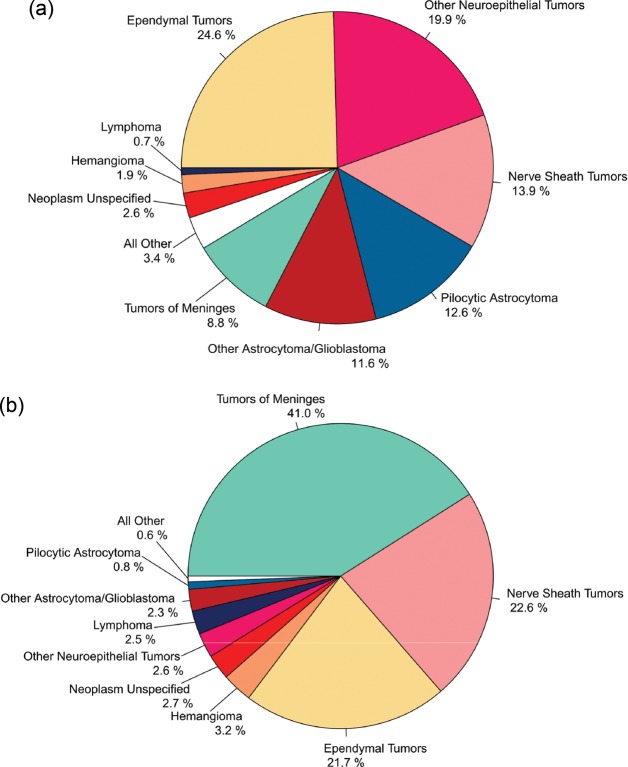
(a) Distribution of Spinal Cord, Spinal Meninges and Cauda Equina Tumors by Age Group and Histology, Ages 0-19 (N = 1,067), CBTRUS Statistical Report: NPCR and SEER, 2006-2010. (b) Distribution of Spinal Cord, Spinal Meninges and Cauda Equina Tumors by Age Group and Histology, Ages 20+ (N = 14,013), CBTRUS Statistical Report: NPCR and SEER, 2006-2010
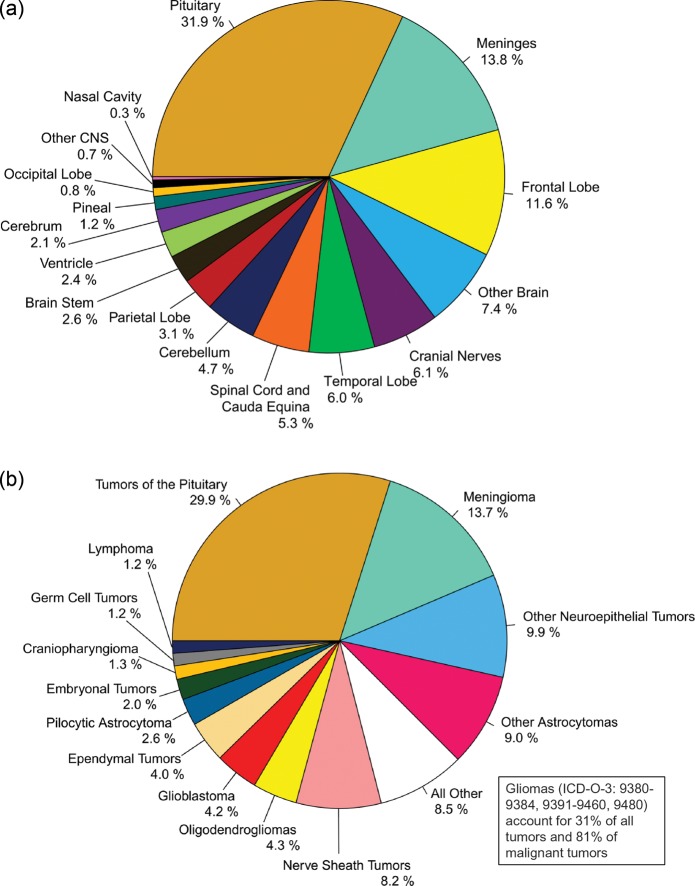
(a) Distribution of Primary Brain and CNS Tumors by Site in Young Adults (Ages 20-34 years) (N = 27,899), CBTRUS Statistical Report: NPCR and SEER, 2006-2010. (b) Distribution of Primary Brain and CNS Tumors by Histology in Young Adults (Ages 20-34 years) (N = 27,899), CBTRUS Statistical Report: NPCR and SEER, 2006-2010
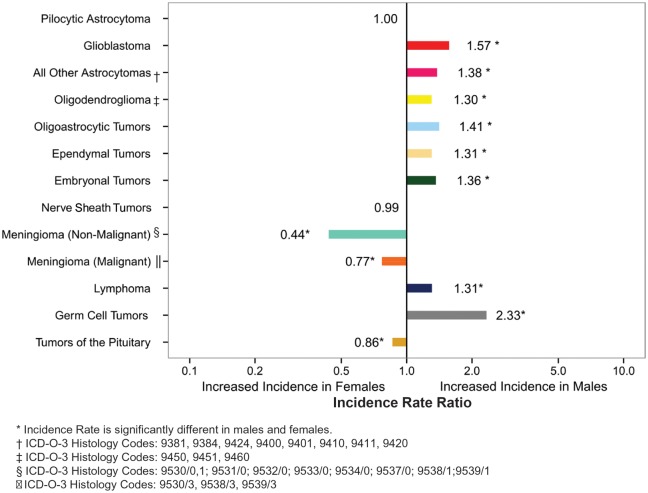
Incidence Rate Ratios by Gender for Selected Histologies, CBTRUS Statistical Report: NPCR and SEER, 2006-2010
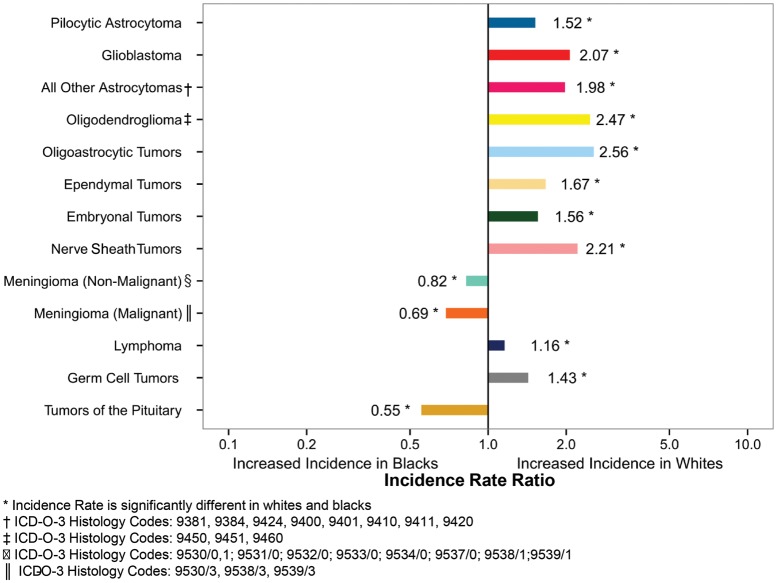
Incidence Rate Ratios by Race for Selected Histologies, CBTRUS Statistical Report: NPCR and SEER, 2006-2010
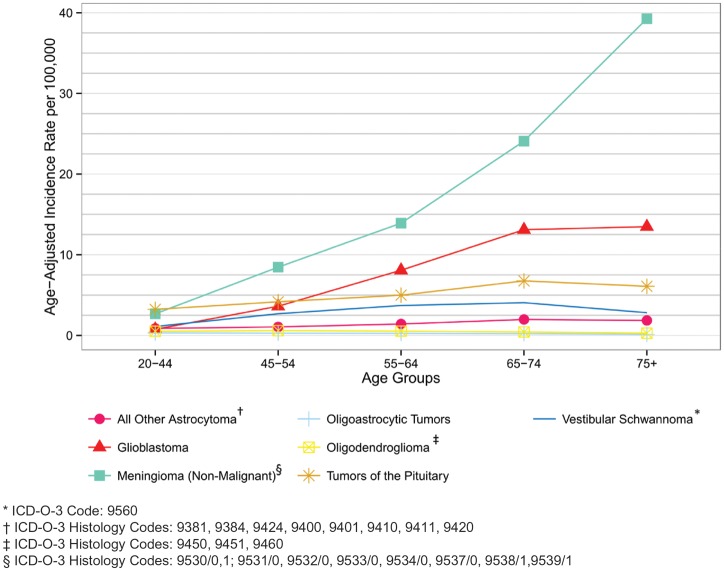
Age-Adjusted Incidence of Adult Brain and CNS Tumors by Selected Histologies and Age Groups (Ages 20+), CBTRUS Statistical Report: NPCR and SEER, 2006-2010
Distribution of Childhood (Ages 0-19) Primary Brain and CNS Tumors by Site (N = 21,512), CBTRUS Statistical Report: NPCR and SEER, 2006-2010
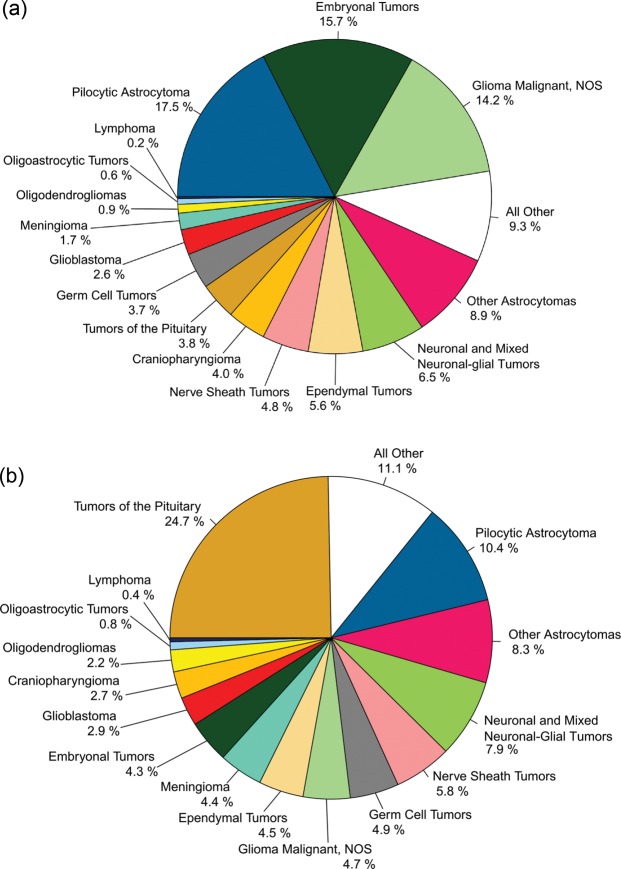
(a) Distribution of Childhood Primary Brain and CNS Tumors by Histology and Age (Ages 0-14) (N = 15,398), CBTRUS Statistical Report: NPCR and SEER, 2006-2010. (b) Distribution of Childhood Primary Brain and CNS Tumors by Histology and Age (Ages 15-19) (N = 6,114), CBTRUS Statistical Report: NPCR and SEER, 2006-2010
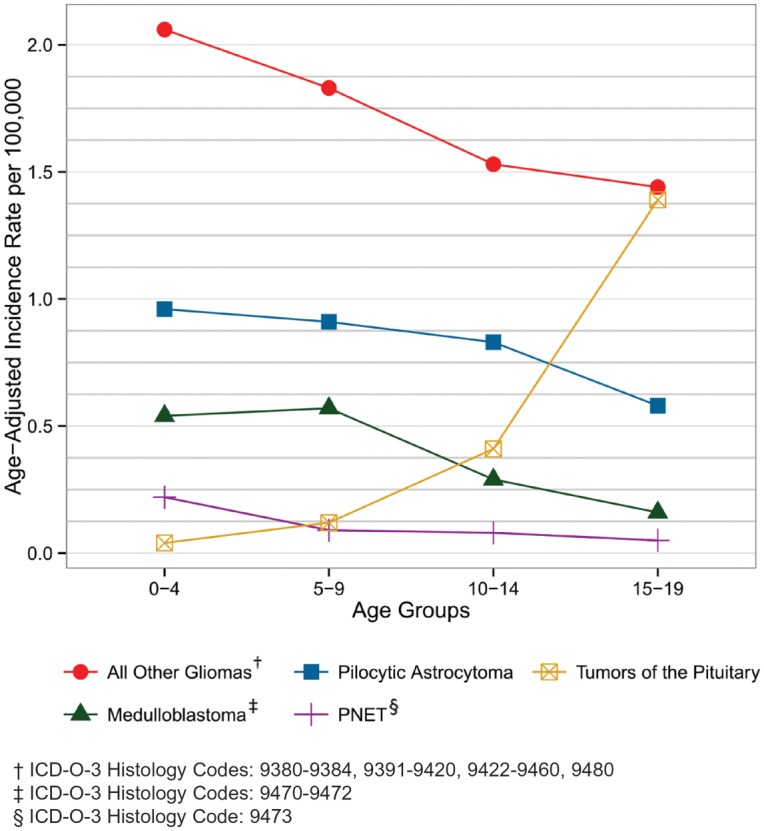
Age-Adjusted Incidence of Childhood Brain and CNS Tumors by Selected Histologies and Age Groups (Ages 0-19), CBTRUS Statistical Report: NPCR and SEER, 2006-2010
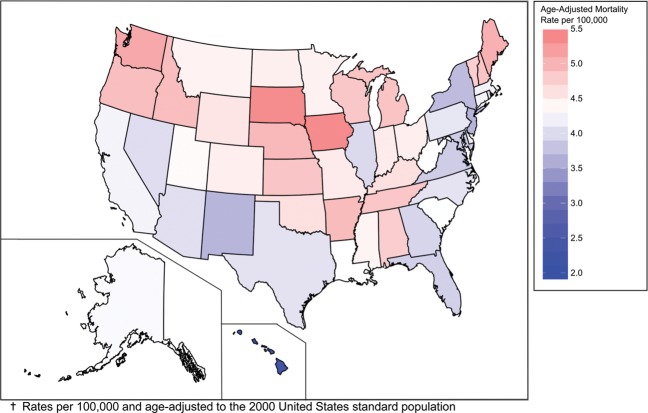
Average Annual Age-Adjusted Mortality Rates for Malignant Primary Brain and CNS Tumors by Central Cancer Registry, CBTRUS Statistical Report: SEER, 2006-2010
References
-
- Centers for Disease Control and Prevention (CDC) National Program of Cancer Registries Cancer Surveillance System Rationale and Approach. 1999 http://www.cdc.gov/cancer/npcr/pdf/npcr_css.pdf .
-
- Cancer Registries Amendment Act. 1992 http://www.cdc.gov/cancer/npcr/npcrpdfs/publaw.pdf .
-
- Benign Brain Tumor Cancer Registries Amendment Act. 2002 http://www.gpo.gov/fdsys/pkg/PLAW-107publ260/pdf/PLAW-107publ260.pdf .
-
- Fritz A, Percy C, Jack A, Shanmugaratnam K, Sobin L, Perkin DM, Whelan S, editors. International Classification of Diseases for Oncology, Third edition. World Health Organization; 2000.
-
- National Cancer Institute. Overview of the SEER Program. http://seer.cancer.gov/about/overview.html .
MeSH terms
LinkOut - more resources
Full Text Sources
Other Literature Sources
Medical
