. 2013 Sep 22:9:363-86.
doi: 10.4137/EBO.S12526. eCollection 2013.

Identification, nomenclature, and evolutionary relationships of mitogen-activated protein kinase (MAPK) genes in soybean

Affiliations

Identification, nomenclature, and evolutionary relationships of mitogen-activated protein kinase (MAPK) genes in soybean

Achal Neupane et al. Evol Bioinform Online. .

Abstract

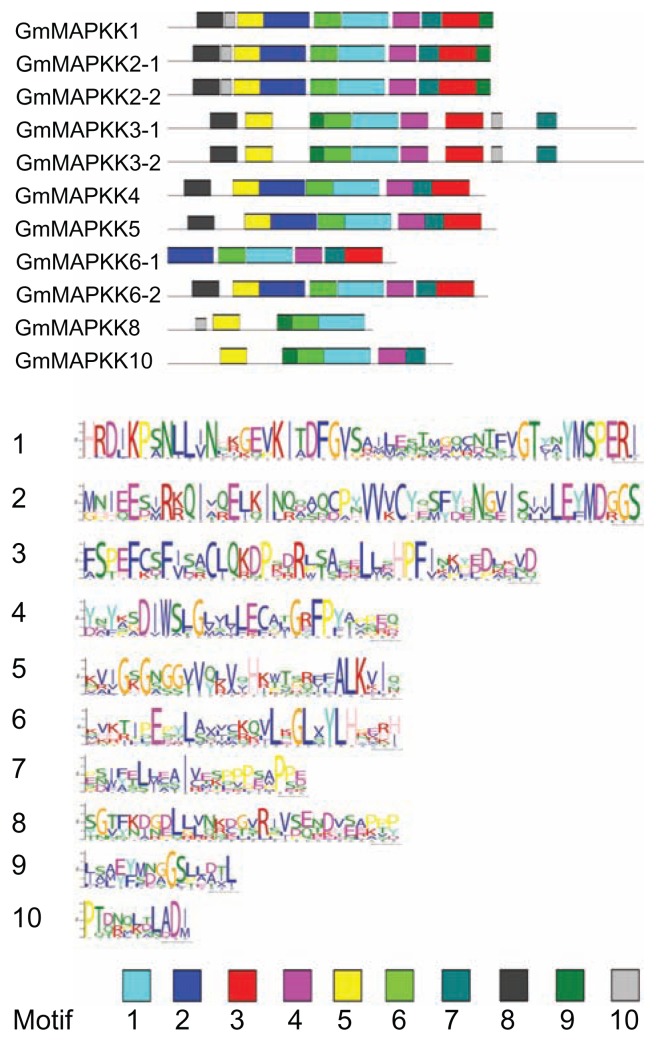
Mitogen-activated protein kinase (MAPK) genes in eukaryotes regulate various developmental and physiological processes including those associated with biotic and abiotic stresses. Although MAPKs in some plant species including Arabidopsis have been identified, they are yet to be identified in soybean. Major objectives of this study were to identify GmMAPKs, assess their evolutionary relationships, and analyze their functional divergence. We identified a total of 38 MAPKs, eleven MAPKKs, and 150 MAPKKKs in soybean. Within the GmMAPK family, we also identified a new clade of six genes: four genes with TEY and two genes with TQY motifs requiring further investigation into possible legume-specific functions. The results indicated the expansion of the GmMAPK families attributable to the ancestral polyploidy events followed by chromosomal rearrangements. The GmMAPK and GmMAPKKK families were substantially larger than those in other plant species. The duplicated GmMAPK members presented complex evolutionary relationships and functional divergence when compared to their counterparts in Arabidopsis. We also highlighted existing nomenclatural issues, stressing the need for nomenclatural consistency. GmMAPK identification is vital to soybean crop improvement, and novel insights into the evolutionary relationships will enhance our understanding about plant genome evolution.

Keywords: MAPK family; gene evolution; homology; nomenclature; signal transduction; soybean genomics.


Figures

Figure 1
Figure 1
Maximum likelihood analysis of GmMAPKs and their orthologs in Arabidopsis, poplar, and rice. Notes: The values above the branches are bootstrap support of 100 replicates. The JTT+G+I evolutionary model was employed in MEGA5.2.2 to perform maximum likelihood analysis. The members with phosphorylation motif TEY are included in clades A, B, and C; TDY in clade D, and members with the TQY (denoted by *) and the TVY (denoted by **) motif in clades E and B, respectively. The MAPK gene models were accepted for phylogenetic analysis using protein sequences of the serine/threonine kinase subfamily having conserved aspartate and lysine residues in their catalytic domain with the (D[L/I/V]K) motif and the TXY phosphorylation motif in their activation loop.
Figure 2
Figure 2
Heatmap visualization of GmMAPKs. Note: Log 2-based value was employed to construct the heatmap for MAPK gene expression in different tissues and treatment conditions.
Figure 3
Figure 3
Maximum likelihood analysis of GmMAPKKs and their orthologs in Arabidopsis, poplar, and rice. Notes: In the ML phylogram, the values above the branches are bootstrap support of 100 replicates. The JTT+G+I evolutionary model was employed in MEGA5.2.2 to perform maximum likelihood analysis. The MAPKK gene models were accepted for phylogenetic analysis using dual-specificity protein kinases having conserved aspartate and lysine residues in their catalytic domain with the (D[L/I/V]K) motif and the S-X5-T phosphorylation motif along with their activation loop.
Figure 4
Figure 4
Heatmap visualization of GmMAPKKs. Note: Log 2-based value was employed to construct the heatmap for MAPKK gene expression in different tissues and treatment conditions.
Figure 5
Figure 5
Maximum likelihood analysis of GmMAPKKKs and their orthologs in Arabidopsis. Notes: Phylogenetic representation of GmMAPKKKs in circular tree format shows the three subgroups: GmMEKK-like, GmRaf-like, and GmZIK-like are indicated by blue, black, and red branches, respectively. The JTT+G+I evolutionary model was employed in MEGA5.2.2 to perform maximum likelihood analysis with 100 bootstrap replicates. The MAPKKK gene models were accepted for phylogenetic analysis using protein sequences of serine/threonine kinase subfamily having conserved aspartate and lysine residues in their catalytic domain with the (D[L/I/V]K) motif, and the members in each subgroup were categorized based on their signature motifs.
Figure 6
Figure 6
Heatmap visualization of MEKK-like GmMAPKKKs. Note: Log 2-based value was employed to construct the heatmap for the MEKK-like GmMAPKKK gene expression in different tissues and treatment conditions.
Figure 7
Figure 7
Heatmap visualization of Raf-like GmMAPKKKs. Note: (A and B) Log 2-based value was employed to construct the heatmap for Raf-like GmMAPKKKs gene expression in different tissues and treatment conditions.
Figure 7
Figure 7
Heatmap visualization of Raf-like GmMAPKKKs. Note: (A and B) Log 2-based value was employed to construct the heatmap for Raf-like GmMAPKKKs gene expression in different tissues and treatment conditions.
Figure 8
Figure 8
Heatmap visualization of ZIK-like GmMAPKKKs. Note: The log 2-based value was employed to construct the heatmap for ZIK-like GmMAPKKK gene expression in different tissues and treatment conditions.
Figure 9
Figure 9
Predicted domain structure of GmMAPKs. Notes: Conserved domain structures as predicted by MEME analysis of the GmMAPK subfamily. Ten different sites were analyzed for the prediction of conserved domain structures in the MAPK subfamily. Each stack height in the logos for ten different predicted motifs represents the sequence conservation in that region which is measured in bits, whereas the height of each residue within the stack indicates the frequency of corresponding amino acid competing for that position.
Figure 10
Figure 10
Predicted domain structure of GmMAPKKs. Notes: Conserved domain structures as predicted by MEME analysis of the GmMAPKK subfamily. Ten different sites were analyzed for the prediction of conserved domain structures in the MAPKK subfamily. Each stack height in the logos for ten different predicted motifs represents the sequence conservation in that region which is measured in bits, whereas the height of each residue within the stack indicates the frequency of the corresponding amino acid competing for that position.
Figure 11
Figure 11
Predicted domain structure of GmMAPKKKs. Notes: Conserved domain structures as predicted by MEME analysis of the GmMAPKKK subfamily: (A) MEKK-like; (B and C) Raf-like; and (D) ZIK-like. Ten different sites were analyzed for the prediction of conserved domain structures in MAPKKK gene subfamily. Each stack height in the logos for ten different predicted motifs represents the sequence conservation in that region, which is measured in bits, whereas the height of each residue within the stack indicates the frequency of the corresponding amino acid competing for that position.
Figure 11
Figure 11
Predicted domain structure of GmMAPKKKs. Notes: Conserved domain structures as predicted by MEME analysis of the GmMAPKKK subfamily: (A) MEKK-like; (B and C) Raf-like; and (D) ZIK-like. Ten different sites were analyzed for the prediction of conserved domain structures in MAPKKK gene subfamily. Each stack height in the logos for ten different predicted motifs represents the sequence conservation in that region, which is measured in bits, whereas the height of each residue within the stack indicates the frequency of the corresponding amino acid competing for that position.

References

    1. Rohila JS, Yang Y. Rice mitogen-activated protein kinase gene family and its role in biotic and abiotic stress response. J Integr Plant Biol. 2007;49(6):751–9.
    1. Jonak C, Okrész L, Bögre L, Hirt H. Complexity, cross talk and integration of plant MAP kinase signalling. Curr Opin Plant Biol. 2002;5(5):415–24. - PubMed
    1. Rodriguez MC, Petersen M, Mundy J. Mitogen-activated protein kinase signaling in plants. Annu Rev Plant Biol. 2010;61:621–49. - PubMed
    1. Barabási AL, Oltvai ZN. Network biology: understanding the cell’s functional organization. Nat Rev Genet. 2004;5(2):101–13. - PubMed
    1. Huang GT, Ma SL, Bai LP, et al. Signal transduction during cold, salt, and drought stresses in plants. Mol Biol Rep. 2012;39(2):969–87. - PubMed