. 2013 Sep 30:7:173.
doi: 10.3389/fnins.2013.00173. eCollection 2013.

Differences in neural activation as a function of risk-taking task parameters

Affiliations

Differences in neural activation as a function of risk-taking task parameters

Eliza Congdon et al. Front Neurosci. .

Abstract

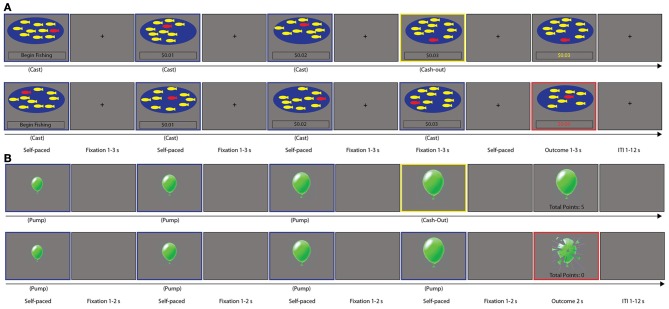
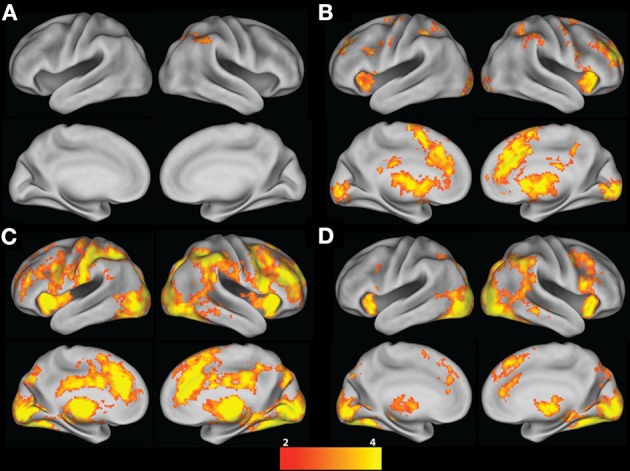
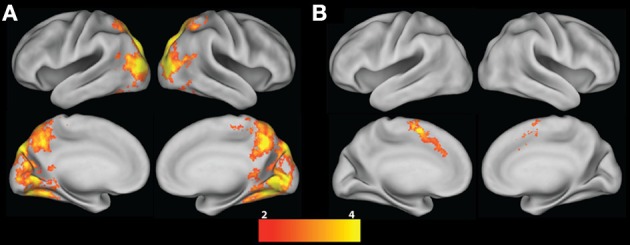
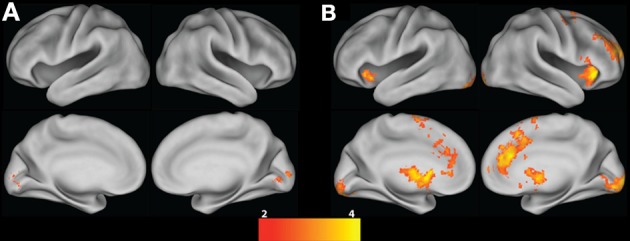
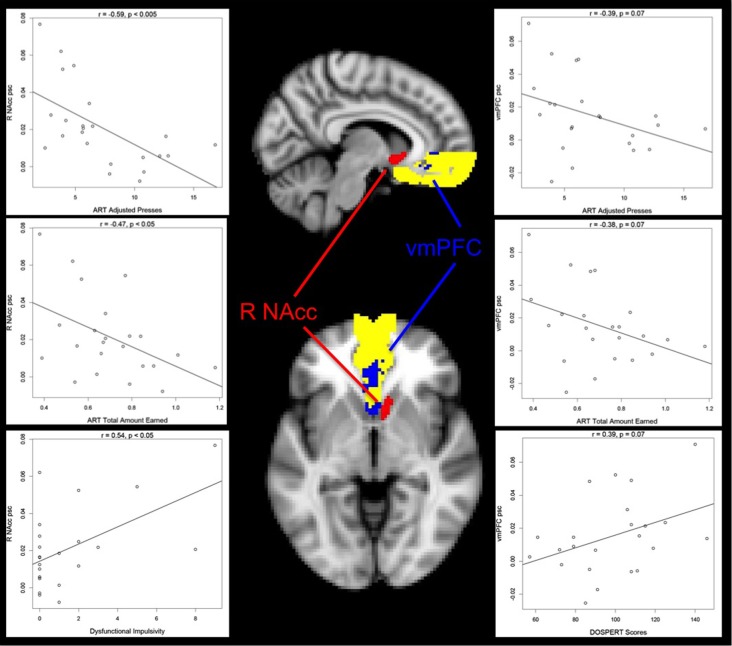
Despite evidence supporting a relationship between impulsivity and naturalistic risk-taking, the relationship of impulsivity with laboratory-based measures of risky decision-making remains unclear. One factor contributing to this gap in our understanding is the degree to which different risky decision-making tasks vary in their details. We conducted an fMRI investigation of the Angling Risk Task (ART), which is an improved behavioral measure of risky decision-making. In order to examine whether the observed pattern of neural activation was specific to the ART or generalizable, we also examined correlates of the Balloon Analog Risk Taking (BART) task in the same sample of 23 healthy adults. Exploratory analyses were conducted to examine the relationship between neural activation, performance, impulsivity and self-reported risk-taking. While activation in a valuation network was associated with reward tracking during the ART but not the BART, increased fronto-cingulate activation was seen during risky choice trials in the BART as compared to the ART. Thus, neural activation during risky decision-making trials differed between the two tasks, and this observation was likely driven by differences in task parameters, namely the absence vs. presence of ambiguity and/or stationary vs. increasing probability of loss on the ART and BART, respectively. Exploratory association analyses suggest that sensitivity of neural response to the magnitude of potential reward during the ART was associated with a suboptimal performance strategy, higher scores on a scale of dysfunctional impulsivity (DI) and a greater likelihood of engaging in risky behaviors, while this pattern was not seen for the BART. Our results suggest that the ART is decomposable and associated with distinct patterns of neural activation; this represents a preliminary step toward characterizing a behavioral measure of risky decision-making that may support a better understanding of naturalistic risk-taking.

Keywords: ART; BART; dysfunctional impulsivity; functional impulsivity; naturalistic risk-taking; risky decision-making.


Figures

Figure 1
Figure 1
Task Schematic of the (A) Angling Risk Task (ART) and (B) Balloon Analog Risk Taking task (BART). For both tasks, Risky choice trials are enclosed in blue, Cash-out trials are enclosed in yellow, and Loss trials are enclosed in Red; trials are indicated as such for the purpose of illustration only, and were not colored as such during task presentation.
Figure 2
Figure 2
ART group contrasts. (A) Risky choice; (B) Risky choice Parametric; (C) Cash-out; and (D) Loss contrasts (vs. Baseline). All contrasts are corrected for whole-brain multiple comparisons; statistical maps were projected onto an average cortical surface using CARET (Right hemisphere = Right side of the image). The color scale represents z-score.
Figure 3
Figure 3
Risky choice contrast. (A) ART vs. BART group contrast; (B) BART vs. ART group contrast. All contrasts are corrected for whole-brain multiple comparisons; statistical maps were projected onto an average cortical surface using CARET (Right hemisphere = Right side of the image). The color scale represents z-score.
Figure 4
Figure 4
Risky choice Parametric contrast. (A) Conjunction between BART and ART; (B) ART vs. BART group contrast. All contrasts are corrected for whole-brain multiple comparisons; statistical maps were projected onto an average cortical surface using CARET (Right hemisphere = Right side of the image). The color scale represents z-score.
Figure 5
Figure 5
Relationship between risk-taking performance, impulsivity, risk-taking propensity and Risky choice Parametric activation. Average percent signal change (psc) values extracted from the right nucleus accumbens (R NAcc) negatively correlate with ART average Adjusted Presses (top left panel) and Total Amount Earned (middle left panel), and positively correlate with Dysfunctional Impulsivity scores (bottom left panel), suggesting that increased reward-tracking activation is associated with poorer performance on the ART and higher impulsivity. A similar pattern is seen in average percent signal change (psc) values extracted from the ventromedial prefrontal cortex (vmPFC), although at trend level: vmPFC activation negatively correlates with ART average Adjusted Presses (top right panel) and Total Amount Earned (middle right panel). vmPFC activation also marginally positively correlates with DOSPERT scores (bottom right panel), suggesting that increased reward-tracking activation is associated with a greater likelihood of engaging in risky behaviors. Activation represents the ART Risky choice Parametric contrast as intersected with our two anatomical ROIs, as described in the text. The vmPFC anatomical mask is presented in yellow, and significant ART Risky choice Parametric activation within this mask is presented in blue. ART Risky choice Parametric activation overlapped with the entire R NAcc mask: these voxels are presented in red. R = Right. For the sagittal view, X = 41; for the axial view, Z = 34.

References

    1. Aklin W. M., Lejuez C. W., Zvolensky M. J., Kahler C. W., Gwadz M. (2005). Evaluation of behavioral measures of risk taking propensity with inner city adolescents. Behav. Res. Ther. 43, 215–228 10.1016/j.brat.2003.12.007 - DOI - PubMed
    1. American Psychiatric Association. (2000). Diagnostic and Statistical Manual of Mental Disorders: DSM-IV-TR. Washington, DC: American Psychiatric Publishing, Inc
    1. Andersson M., Jenkinson M., Smith S. M. (2007a). Non-linear optimisation. FMRIB Technical Report TR07JA1, Oxford.
    1. Andersson M., Jenkinson M., Smith S. M. (2007b). Non-linear registration, aka Spatial normalisation. FMRIB Technical Report TR07JA2, Oxford.
    1. Ashenhurst J. R., Jentsch D. J., Ray L. A. (2011). Risk-taking and alcohol use disorders symptomatology in a sample of problem drinkers. Exp. Clin. Psychopharmacol. 19, 361–370 10.1037/a0024412 - DOI - PMC - PubMed