. 2013 Oct 16:7:174.
doi: 10.3389/fncel.2013.00174. eCollection 2013.

Diversity of layer 5 projection neurons in the mouse motor cortex

Affiliations

Diversity of layer 5 projection neurons in the mouse motor cortex

Manfred J Oswald et al. Front Cell Neurosci. .

Abstract

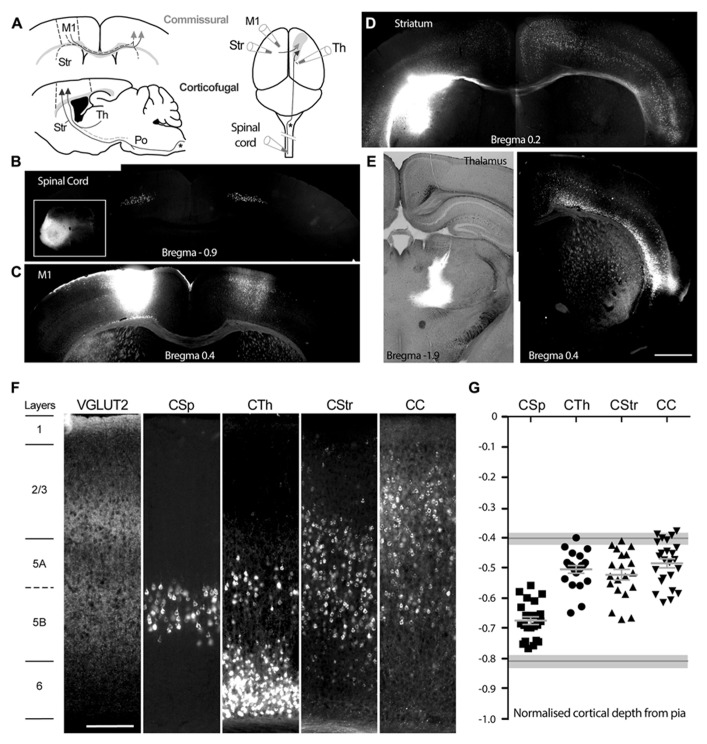
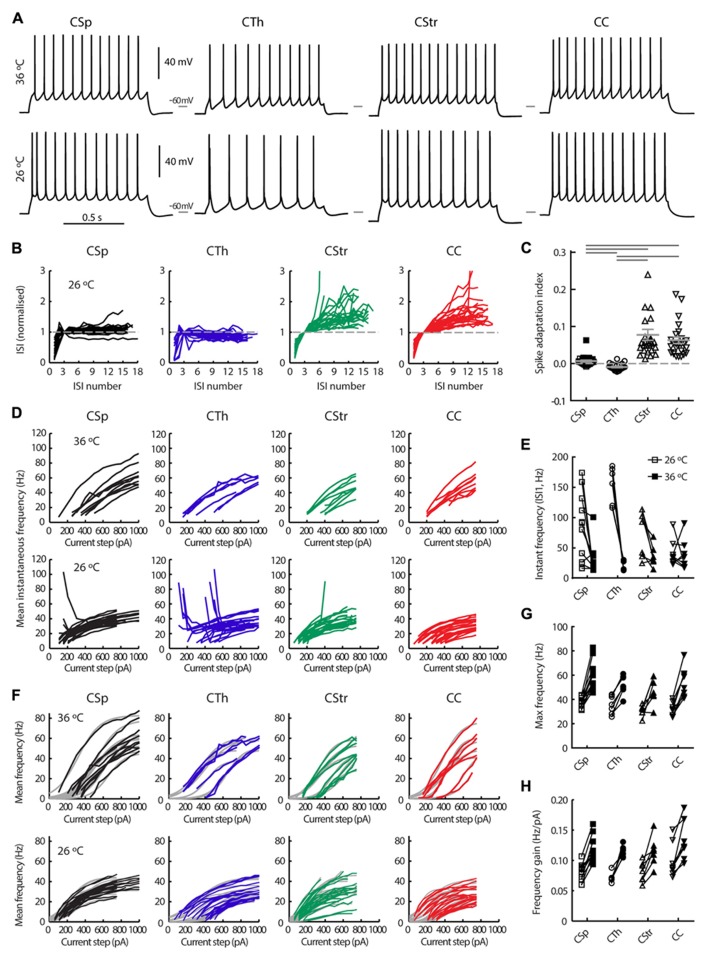
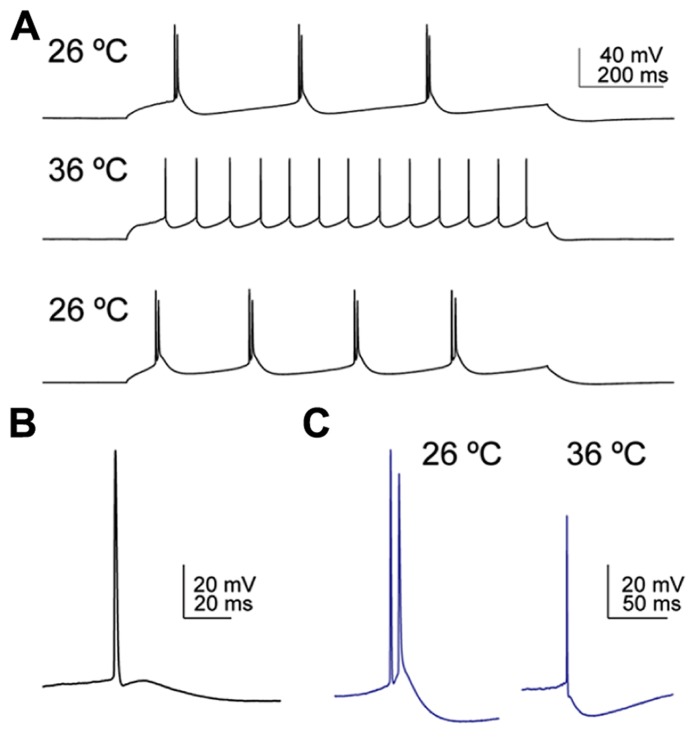
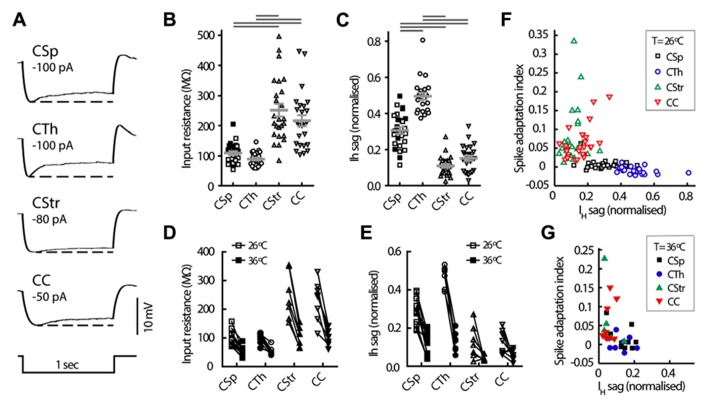
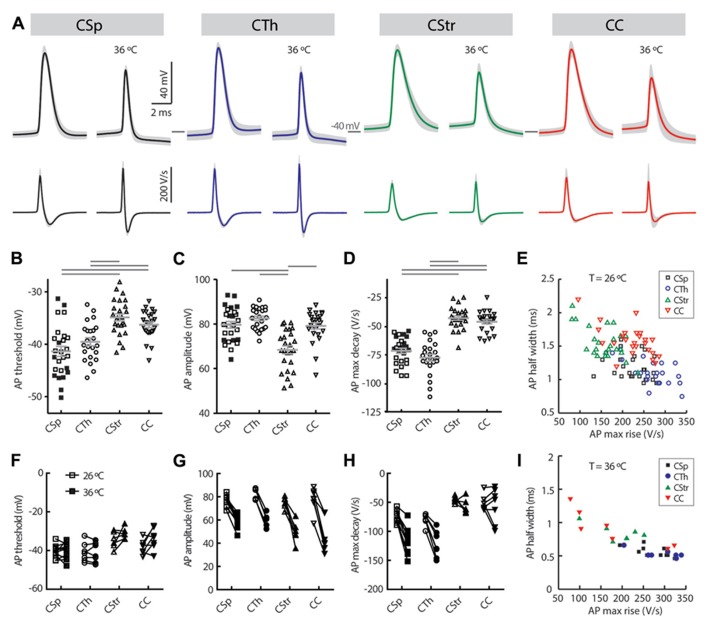
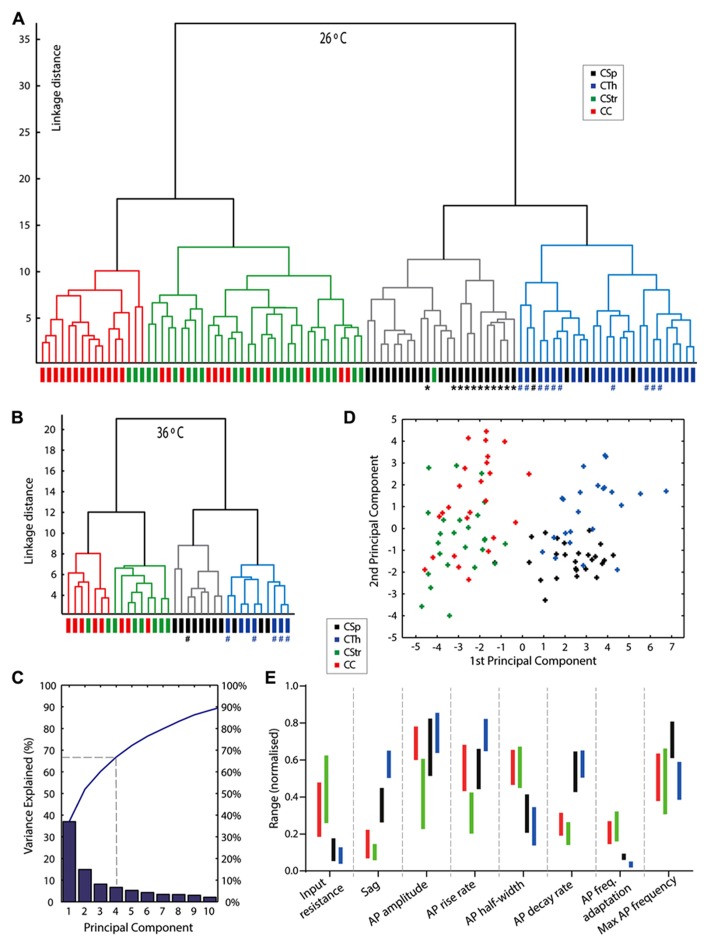
In the primary motor cortex (M1), layer 5 projection neurons signal directly to distant motor structures to drive movement. Despite their pivotal position and acknowledged diversity these neurons are traditionally separated into broad commissural and corticofugal types, and until now no attempt has been made at resolving the basis for their diversity. We therefore probed the electrophysiological and morphological properties of retrogradely labeled M1 corticospinal (CSp), corticothalamic (CTh), and commissural projecting corticostriatal (CStr) and corticocortical (CC) neurons. An unsupervised cluster analysis established at least four phenotypes with additional differences between lumbar and cervical projecting CSp neurons. Distinguishing parameters included the action potential (AP) waveform, firing behavior, the hyperpolarisation-activated sag potential, sublayer position, and soma and dendrite size. CTh neurons differed from CSp neurons in showing spike frequency acceleration and a greater sag potential. CStr neurons had the lowest AP amplitude and maximum rise rate of all neurons. Temperature influenced spike train behavior in corticofugal neurons. At 26°C CTh neurons fired bursts of APs more often than CSp neurons, but at 36°C both groups fired regular APs. Our findings provide reliable phenotypic fingerprints to identify distinct M1 projection neuron classes as a tool to understand their unique contributions to motor function.

Keywords: cluster analysis; corticocortical; corticospinal; corticostriatal; corticothalamic; electrophysiology; morphology.


Figures

FIGURE 1
FIGURE 1
Injection sites and profiles of retrogradely labeled neurons in mouse primary motor cortex, M1. (A) Schematic of retrograde tracer injection sites targeting either commissural neurons projecting through the corpus callosum across hemispheres, or corticofugal neurons projecting ipsilaterally to the thalamus, brainstem, and spinal cord. M1 (borders delineated by the dashed lines) denotes the site for labeling of corticocortical neurons CC, in the contralateral hemisphere, see arrow heads; Str denotes the site for labeling of corticostriatal, CStr, neurons, these neurons also send collaterals across the midline to the contralateral cortex, dashed line with arrowheads. Spinal cord and Th denote sites for labeling of corticospinal, CSp and corticothalamic, CTh neurons respectively. Note that the corticospinal tract decussates in the medulla oblongata (shown by an asterisk *) and that axons projecting from the thalamus to M1 may be collaterals of neurons that project to the brainstem, e.g., pontine nuclei, Po, as shown by the dashed line, lower panel (A). (B) Bilateral labeling of corticospinal neurons in M1 and S1 hindlimb regions following a unilateral cholera toxin B (CTB) injection into the lumbar spinal cord (inset). (C) Homotopic M1 labeling contralateral to the CTB injection site in M1. (D) Widespread cortical bilateral labeling following CTB injection into the dorsolateral striatum in the left hemisphere (contrast was enhanced for the right hemisphere). (E) Widespread labeling of layer 5 and 6 neurons following ipsilateral CTB injection into the ventrolateral thalamic nucleus. (F) Laminar profile of VGLUT2 immunoreactive terminals and distribution of the retrogradely labeled neurons in M1, from the different sites, in slices of M1 obtained from similar bregma levels. (G) Soma position of all individually patch-clamped retrograde labeled neurons normalized by cortical depth, aligned to the layer positions in (F). Mean ±SEM for each projection neuron group are shown in light gray. Upper and lower layer 5 boundaries based on VGLUT2 immunoreactive terminal distribution are indicated by gray lines with light gray shading (mean ±SD). Scale bars: 1 mm (E, representative for B–E) and 200 μm (F). Images obtained from representative 50 μm thick histologically processed sections.
FIGURE 2
FIGURE 2
Morphological characteristics of M1 layer 5 neurons grouped according to the projection target. (A) Grouped overlays of 5 single reconstructed neurons aligned at the pia (dashed line). One cell is highlighted in each group. Axons are not shown. The CSp neurons shown were labeled from the lumbar spinal cord but cellular morphologies are representative also for cervical projecting CSp neurons. (B) Sholl analysis of dendritic complexity with increasing radial distance from the soma center. Sholl radii were normalized by soma depth from the pia and multiplied again by the average soma depth of all cells across all groups (†, the dashed line represents the sholl radius that equals soma depth from the pia), or by cortical depth and muliplied again by the average cortical depth (inset for basal dendrites only). Cell groups differed mainly in the distal apical tuft region (p < 0.001, two-way ANOVA). Soma size and shaft width (C, D, filled and open squares respectively for lumbar and cervical CSp neurons). Horizontal gray bars indicate group-wise differences at the 5% significance level (C, one-way ANOVA and Tukey’s post hoc test; D, Kruskal-Wallis test and Dunn’s post hoc analysis). Apical dendrite height (E, filled black symbols, gray lines for mean ±SEM) and tuft origin (open gray symbols, black lines for mean ±SEM). (F) Overall correlation of tuft width and height showing data from individual neurons and the mean ±SEM for each group.
FIGURE 3
FIGURE 3
Action potential firing behavior of M1 layer 5 neurons grouped by projection target. (A) Firing responses of CSp, CTh, CStr and CC neurons during a 1 s long depolarising current injection recorded in the same neuron at 36 and 26°C. (B) Normalized inter spike interval (ISI) plots for all neurons in each group derived from episodes with a firing frequency closest to 15 Hz at 26°C. (C) The spike adaptation index, defined as the slope of the linear regression of the ISI plots in B, from the 3rd ISI onward (C, means ±SEM for each group are shown in gray, filled and open squares respectively for lumbar and cervical CSp neurons where visible). Horizontal gray bars indicate group-wise differences of the Log normalized data (p < 0.001, one-way ANOVA and Tukey’s post hoc test). (D) Mean instantaneous frequency for five or more action potentials per current step for all neurons in each group. (E) Instantaneous frequency of the 1st ISI of the episode with a firing frequency closest to 15 Hz (paired recordings at 26 and 36°C). A two-way repeated measures ANOVA of the Log normalized data revealed that cell types fired at similar initial instantaneous frequencies (p = 0.62) but temperature had an effect on this measure selectively in CSp and CTh neurons (p < 0.01 and 0.001, respectively, Bonferroni’s post hoc analysis). (F) Mean firing frequency response to successively increasing depolarising current injections for each neuron at 26 and 36°C, and best sigmoidal or linear fits of the data (gray curves in background). Maximum mean frequency (G) and frequency gain (H) for all neurons at both temperatures.
FIGURE 4
FIGURE 4
Temperature influences the firing pattern and the depolarising afterpotential (DAP) following an action potential in corticofugal neurons. (A) CSp neuron labeled from the cervical spinal cord fired bursty episodes at 26°C, regularly at 36°C, and reversed back to bursty firing on decreasing the bath temperature back to 26°C. (B) Example of a typical DAP in a CSp neuron recorded at 26°C. The AP was triggered by slow ramp current injection. (C) Example of a CTh neuron that fired a spike doublet at 26°C and a single AP at 36°C. The spike doublet was triggered from the DAP following the initial AP at 26°C and only a small DAP was apparent at 36°C. On prolonged current injection the same neuron fired bursty episodes only at 26°C, and in a regular pattern at 36°C.
FIGURE 5
FIGURE 5
Intrinsic electrophysiological properties of M1 layer 5 neurons grouped by projection target. (A) Representative voltage responses to hyperpolarising current injection in the four cell groups at 26°C. Note the differences in size and kinetics of the IH mediated depolarisation (or sag) seen after the peak hyperpolarisation, dashed line. Distribution of the cell input resistance (B) and sag potential (C) in the different cell groups at 26°C (means ±SEM indicated in gray, filled and open squares respectively for lumbar and cervical CSp neurons). Horizontal gray bars indicate group-wise differences at the 5% significance level (Kruskal-Wallis test and Dunn’s post hoc analysis). (D, E) Paired comparison of the same parameters at 26 and 36°C. Relationship between firing frequency adaptation and sag at 26°C (F) and 36°C (G), showing the largest IH sag in the CTh and CSp subgroups consistent with their regular firing behavior (see Figure 3) and the smallest IH sag and robust adaptation in the CStr and CC neurons.
FIGURE 6
FIGURE 6
Action potential waveform characteristics of M1 layer 5 neurons grouped by projection target. (A) Average action potential waveforms (upper panel) and first derivatives of the waveform (lower panel) in the same neurons at 26°C (left) and 36°C (right; n = 10 CSp, 7 CTh, 7 CStr, and 7 CC neurons; a single AP was evoked in each neuron by a near threshold current ramp; SDs are indicated by gray shading). Distribution of the action potential threshold (B), amplitude (C) and maximum decay (D) in the different groups at 26°C (means ±SEM indicated in gray, filled and open squares respectively for lumbar and cervical CSp neurons). Horizontal gray bars indicate group-wise differences at the 5% significance level (B, D, one-way ANOVA and Tukey’s post hoc test; C, Kruskal-Wallis test and Dunn’s post hoc analysis). (F–H) Comparison of the same parameters at 26 and 36°C for paired recordings. Relationship between action potential half width and maximum rise at 26°C (E) and 36°C (I), highlighting the fastest rising shortest duration of the action potential in the CTh neurons.
FIGURE 7
FIGURE 7
An unsupervised cluster analysis reveals neuron grouping based on projection target. Dendrogram plots of linkage distances from an unsupervised cluster analysis of 24 parameters for all cells at 26°C (A) and 36°C (B). Four clusters were obtained in both data sets by setting the linkage threshold to 45% of the maximum linkage distance. Neurons that exhibited burst firing episodes at 26°C are marked with a hash #, 1 × CSp neuron and 10 × CTh neurons; at 36°C the same CSp neuron and 5 of the CTh neurons are marked since these neurons were recorded at both temperatures; importantly at 36°C none of these corticofugal neurones exhibited burst firing behavior, see Figure 4A for an example. CSp neurons projecting to the lumbar spinal cord are marked with an asterisk *. (C) Graph of the variances explained by the first ten components from a princial component analysis of the 26°C data. The blue line shows the cumulative variance. (D) Plot of scores for each cell from the first two principal components (CSp, black; CTh, blue; CStr, green; CC, red). See alsoTable 4. (E) Non-overlapping interquartile ranges (vertical bars colored to represent cell type) of electrophysiological parameters for each cell type helps provide an indication of the key parameter differences for the different projection neuron types. The data is normalized to the absolute range (min to max, zero to one) of all values encountered for each parameter from the different groups of cells.

References

    1. Agmon A., Connors B. (1992). Correlation between intrinsic firing patterns and thalamocortical synaptic responses of neurons in mouse barrel cortex. J. Neurosci. 12 319–329 - PMC - PubMed
    1. Amitai Y., Connors B. W. (1995). “ Intrinsic physiology and morphology of single neurons in neocortex,” in Cerebral Cortex eds Jones E. G., Diamond I. T. (New York: Plenum Press; ) 299–331
    1. Anderson C. T., Sheets P. L., Kiritani T., Shepherd G. M. (2010). Sublayer-specific microcircuits of corticospinal and corticostriatal neurons in motor cortex. Nat. Neurosci. 13 739–744 10.1038/nn.2538 - DOI - PMC - PubMed
    1. Aronoff R., Matyas F., Mateo C., Ciron C., Schneider B, Petersen C. C. H. (2010). Long-range connectivity of mouse primary somatosensory barrel cortex. Eur. J. Neurosci. 31 2221–2233 10.1111/j.1460-9568.2010.07264.x - DOI - PubMed
    1. Bekkers J. M, Häusser M. (2007). Targeted dendrotomy reveals active and passive contributions of the dendritic tree to synaptic integration and neuronal output. Proc. Nat. Acad. Sci. 104 11447–11452 10.1073/pnas.0701586104 - DOI - PMC - PubMed

LinkOut - more resources