

Increased intratumoral fluorothymidine uptake levels following multikinase inhibitor sorafenib treatment in a human renal cell carcinoma xenograft model
- PMID: 24137387
- PMCID: PMC3789029
- DOI: 10.3892/ol.2013.1459
Increased intratumoral fluorothymidine uptake levels following multikinase inhibitor sorafenib treatment in a human renal cell carcinoma xenograft model
Abstract
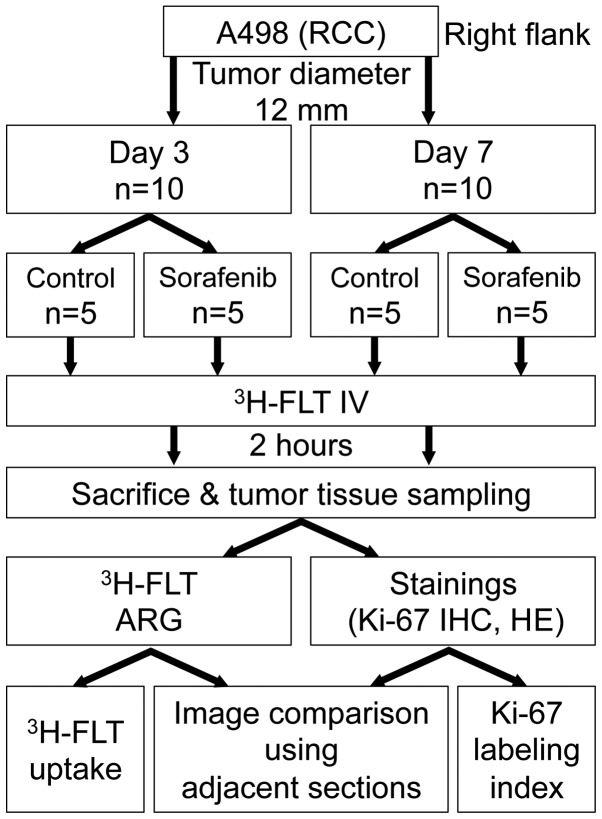
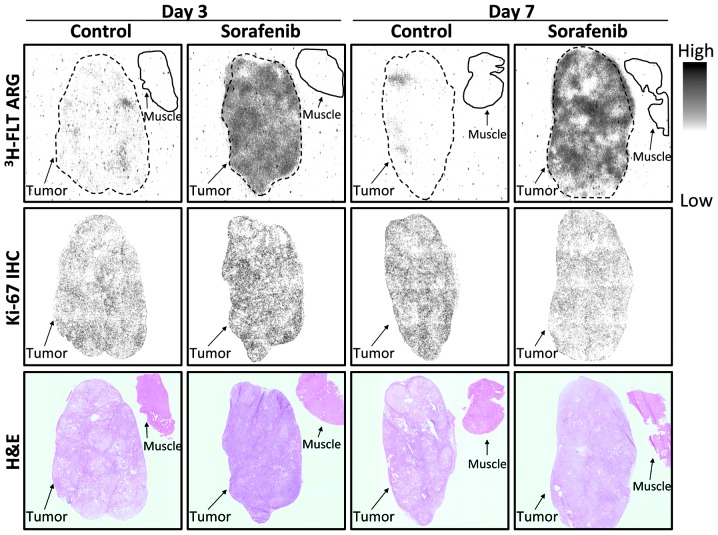
An early identification of the tumor response to sorafenib treatment is indispensable for selecting optimal personalized treatment strategies. However, at present, no reliable predictors are clinically available. 18F-fluorothymidine (18F-FLT) positron emission tomography (PET) is used to assess tumor proliferation, since the FLT uptake level reflects thymidine kinase-1 (TK-1) activity. Thus, the present study determined whether FLT was able to evaluate the early tumor response to sorafenib treatment in a human renal cell carcinoma (RCC; A498) xenograft in comparison with the tumor proliferation marker, Ki-67. Mice bearing A498 tumors were assigned to the control and sorafenib-treated groups and the tumor volume was measured every day. [Methyl-3H(N)]-3'-fluoro-3'-deoxythymidine (3H-FLT) was injected 2 h prior to the sacrifice of the mice on days three and seven following the treatment. 3H-FLT autoradiography (ARG) and Ki-67 immunohistochemistry (IHC) were performed using adjacent tumor sections. In the visual assessment, the intratumoral 3H-FLT uptake level diffusely increased following the treatment, while no significant changes were observed in Ki-67 IHC. The intratumoral 3H-FLT uptake levels significantly increased by 2.7- and 2.6-fold on days three and seven following the treatment, while the tumor volume and Ki-67 index did not significantly change. Thus, an increased FLT uptake level was demonstrated following the treatment, which may indicate the suppression of thymidylate synthase (TS) and the compensatory upregulation of TK-1 activity by sorafenib.
Keywords: Ki-67 labeling index; anti-angiogenic therapy; fluorothymidine; positron emission tomography; tumor proliferation.
Figures


References
-
- Rini BI. Vascular endothelial growth factor-targeted therapy in renal cell carcinoma: current status and future directions. Clin Cancer Res. 2007;13:1098–1106. - PubMed
-
- Cáceres W, Cruz-Chacón A. Renal cell carcinoma: molecularly targeted therapy. PR Health Sci J. 2011;30:73–77. - PubMed
-
- Chang YS, Adnane J, Trail PA, et al. Sorafenib (BAY 43–9006) inhibits tumor growth and vascularization and induces tumor apoptosis and hypoxia in RCC xenograft models. Cancer Chemother Pharmacol. 2007;59:561–574. - PubMed
-
- Escudier B, Eisen T, Stadler WM, et al. TARGET Study Group. Sorafenib in advanced clear-cell renal-cell carcinoma. N Engl J Med. 2007;356:125–134. - PubMed
-
- Elias JM. Cell proliferation indexes: a biomarker in solid tumors. Biotech Histochem. 1997;72:78–85. - PubMed
LinkOut - more resources
Full Text Sources
Other Literature Sources