. 2013 Oct 20;14(1):4.
doi: 10.1186/1467-4866-14-4.

A new model for the biodegradation kinetics of oil droplets: application to the Deepwater Horizon oil spill in the Gulf of Mexico

Affiliations

A new model for the biodegradation kinetics of oil droplets: application to the Deepwater Horizon oil spill in the Gulf of Mexico

Javier Vilcáez et al. Geochem Trans. .

Abstract

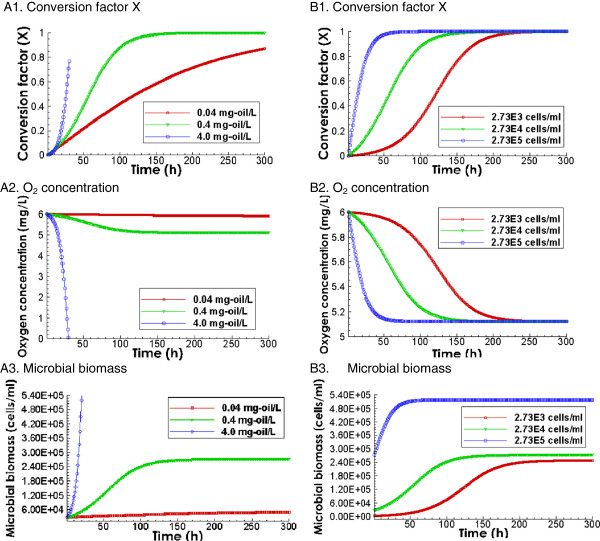
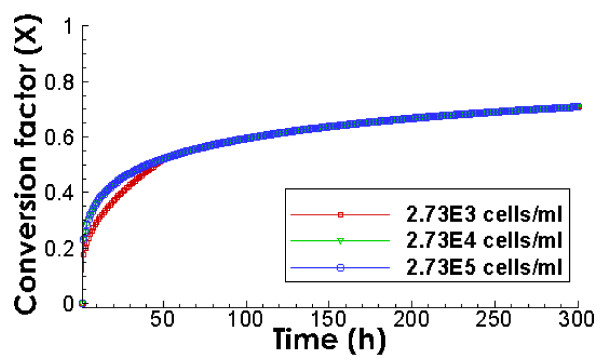
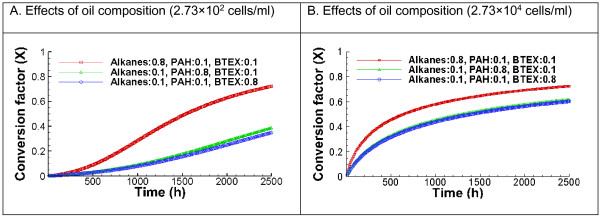
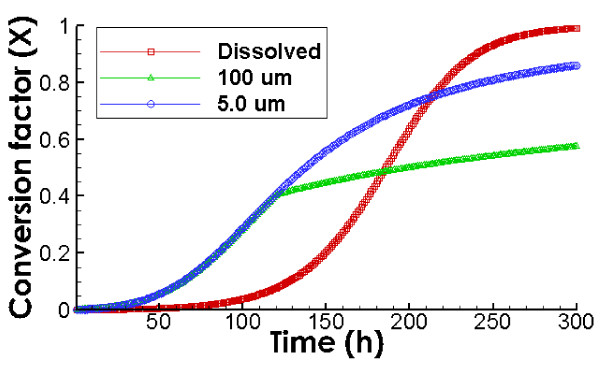
Oil biodegradation by native bacteria is one of the most important natural processes that can attenuate the environmental impacts of marine oil spills. Existing models for oil biodegradation kinetics are mostly for dissolved oil. This work developed a new mathematical model for the biodegradation of oil droplets and applied the model to estimate the time scale for oil biodegradation under conditions relevant to the Deepwater Horizon oil spill in the Gulf of Mexico. In the model, oil is composed of droplets of various sizes following the gamma function distribution. Each oil droplet shrinks during the microbe-mediated degradation at the oil-water interface. Using our developed model, we find that the degradation of oil droplets typically goes through two stages. The first stage is characterized by microbial activity unlimited by oil-water interface with higher biodegradation rates than that of the dissolved oil. The second stage is governed by the availability of the oil-water interface, which results in much slower rates than that of soluble oil. As a result, compared to that of the dissolved oil, the degradation of oil droplets typically starts faster and then quickly slows down, ultimately reaching a smaller percentage of degraded oil in longer time. The availability of the water-oil interface plays a key role in determining the rates and extent of degradation. We find that several parameters control biodegradation rates, including size distribution of oil droplets, initial microbial concentrations, initial oil concentration and composition. Under conditions relevant to the Deepwater Horizon spill, we find that the size distribution of oil droplets (mean and coefficient of variance) is the most important parameter because it determines the availability of the oil-water interface. Smaller oil droplets with larger variance leads to faster and larger extent of degradation. The developed model will be useful for evaluating transport and fate of spilled oil, different remediation strategies, and risk assessment.


Figures

Figure 1
Figure 1
Size distribution and conceptual representation of oil droplets. Left: Gamma function of oil droplet size distribution for various coefficients of variation (CV). Right: Schematic representation of dispersed oil droplets in the control volume. The formulated shrinking oildroplet model is for a control volume containing dispersed oil droplets with their sizes following a gamma distribution function.
Figure 2
Figure 2
Predicted evolution of conversion factor X, oxygen concentration, and microbial growth for dissolved oil. Left column: Effects of initial oil concentrations (0.04, 0.4, and 4.0 mg/L) with the same initial microbe concentration of 2.73 × 104 cells/ml. Right column: Effects of initial microbial concentrations (2.73 × 102, 2.73 × 103, and 2.73 × 104) with the initial dissolved oil concentration of 0.4 mg/L.
Figure 3
Figure 3
Predicted evolution of conversion factor X at different initial oil concentrations of dispersed oil droplets. The initial microbial concentration is 2.73 × 104 cells/ml, the mean diameter of oil droplets is 100 μm, and the CV value is 0.8. Compared to the dissolved oil degradation in Figure  2, the early biodegradation is much faster while the later biodegradation rate is much slower.
Figure 4
Figure 4
Predicted evolution of the conversion factor X of dispersed oil droplets with different initial microbial concentrations. The initial oil concentration is 0.4 mg/L, the mean diameter of oil droplets is 100 μm, and the CV value is 1.8.
Figure 5
Figure 5
Predicted effect of oil droplet size distribution on biodegradation kinetics. The initial concentration of oil and microbes is 0.4 mg/L and 2.73 × 104 cells/ml, respectively. Left: Three different mean diameters and the same coefficient of variation (CV) of 1.8; Right: Three CV values and the same mean diameter of 100 μm. Smaller mean droplet sizes and larger CV leads to larger water-oil-microbe contact and therefore faster and larger extent of degradation.
Figure 6
Figure 6
Predicted evolution of conversion factor X, total microbial biomass, and cell density with different maximum microbial densities at the water-oil interface and with different mean oil droplet size. Left column: Effects of maximum cell density with the oil droplet mean diameter of 100 μm. Right column: Effects of maximum cell density with the oil droplet mean diameter of 10 μm. Initial microbial and oil concentrations are 2.73 × 103 cells/ml and 0.4 mg/L, respectively. The value of CV is 1.4.
Figure 7
Figure 7
Predicted effect of oil composition on the biodegradation kinetics. Left: the initial microbial concentration is 2.73 × 10² cells/ml; Right: the initial microbial concentration is 2.73 × 10⁴ cells/ml. Oil is composed of alkanes (heneicosane), BETX, and PAHs. The mean diameter of oil droplets is 100 μm, oil concentration is 0.4 mg/L, and the value of CV is 0.8.
Figure 8
Figure 8
Comparison of biodegradation kinetics for oil droplets vs. dissolved oil. Initial microbial and oil concentrations are 2.73 × 10² cells/ml and 0.4 mg/L, respectively. The value of CV is 0.8.

References

    1. Crone TJ, Tolstoy M. Magnitude of the 2010 Gulf of Mexico oil leak. Science. 2010;14:634. doi: 10.1126/science.1195840. - DOI - PubMed
    1. Camilli R, Reddy CM, Yoerger DR, Mooy BASV, Jakuba MV, Kinsey JC, McIntyre CP, Sylva SP, Maloney JV. Tracking hydrocarbon plume transport and biodegradation at Deepwater Horizon. Science. 2010;14:201–204. doi: 10.1126/science.1195223. - DOI - PubMed
    1. Belorea RC, Trudela K, Mullinb JV, Guarinoc A. Large-scale cold water dispersant effectiveness experiments with Alaskan crude oils and Corexit 9500 and 9527 dispersants. Mar Pollut Bull. 2009;14:118–128. doi: 10.1016/j.marpolbul.2008.08.013. - DOI - PubMed
    1. Li Z, Lee K, King T, Boufadel MC, Venosa AD. Assessment of chemical dispersant effectiveness in a wave tank under regular non-braking and wave breaking wave conditions. Mar Pollut Bull. 2008;14:903–912. doi: 10.1016/j.marpolbul.2008.01.031. - DOI - PubMed
    1. Sterling MC, Bonner JS, Ernest ANS, Page CA, Autenrieth RL. Chemical dispersant effectiveness testing: influence of droplet coalescence. Mar Pollut Bull. 2004;14:969–977. doi: 10.1016/j.marpolbul.2003.12.003. - DOI - PubMed

LinkOut - more resources