

doi: 10.1080/10543406.2013.834912.
Covariate imbalance and adjustment for logistic regression analysis of clinical trial data
Affiliations
- PMID: 24138438
- PMCID: PMC4279871
- DOI: 10.1080/10543406.2013.834912
Item in Clipboard
Covariate imbalance and adjustment for logistic regression analysis of clinical trial data
J Biopharm Stat.
2013.
Abstract
In logistic regression analysis for binary clinical trial data, adjusted treatment effect estimates are often not equivalent to unadjusted estimates in the presence of influential covariates. This article uses simulation to quantify the benefit of covariate adjustment in logistic regression. However, International Conference on Harmonization guidelines suggest that covariate adjustment be prespecified. Unplanned adjusted analyses should be considered secondary. Results suggest that if adjustment is not possible or unplanned in a logistic setting, balance in continuous covariates can alleviate some (but never all) of the shortcomings of unadjusted analyses. The case of log binomial regression is also explored.
Figures
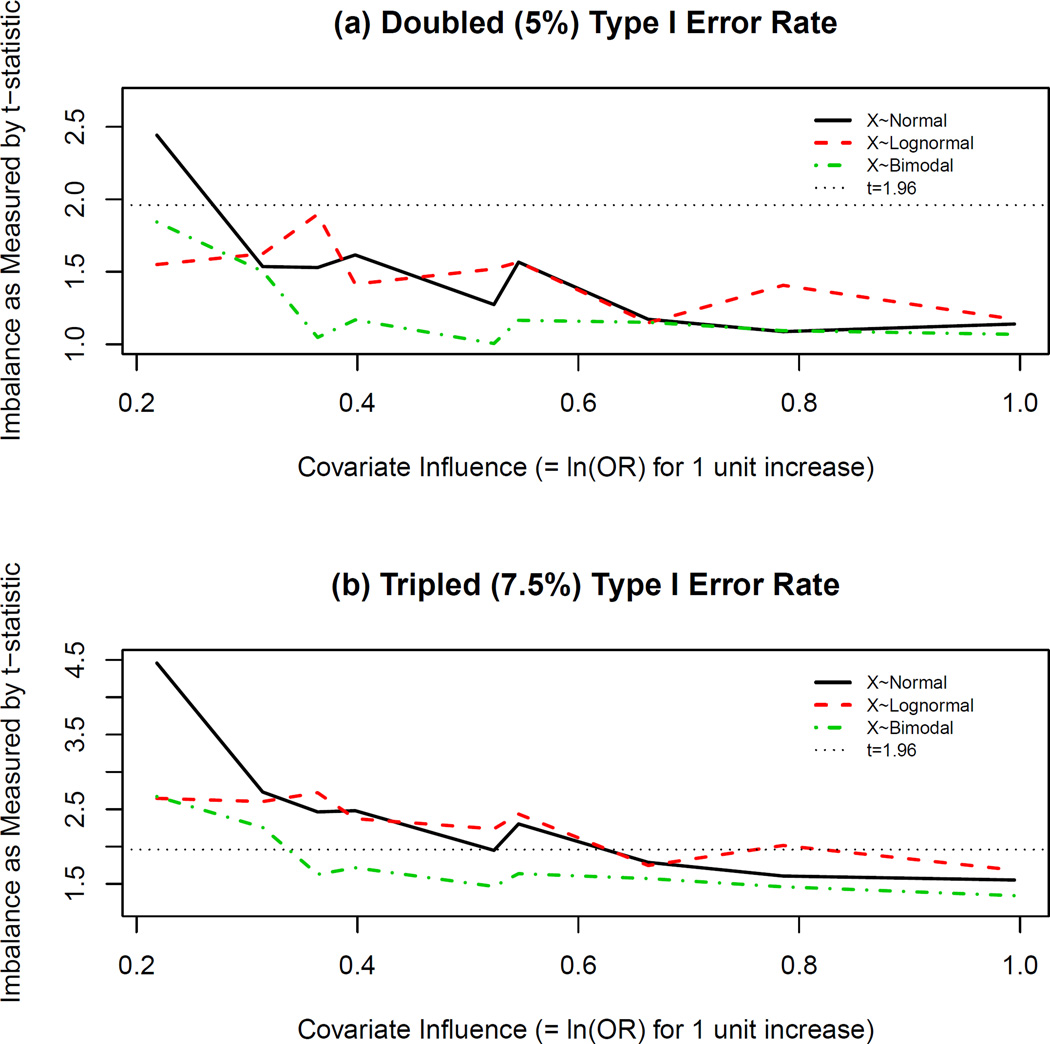
Imbalance Levels Corresponding to Type I Error Rate Inflation in Logistic Scenarios. Table 1 shows that imbalance as measured by the t-statistic significantly predicts type I error rate. Using the Generalized Linear Models (GLMs) whose summary information is depicted in Table 1, t-statistic estimates corresponding to estimated type I error rates of (a) 5% and (b) 7.5%, were calculated and plotted for various levels of covariate influence (βx) in the logistic scenarios. Positive levels of imbalance correspond to a favored active treatment group in these plots. The horizontal line at t=1.96 corresponds to the two-sided critical value for a baseline test comparing covariate distributions at the 5% level of significance. Influential levels of imbalance are thus not discovered by this test as most values fall below this threshold in (a) and (b).
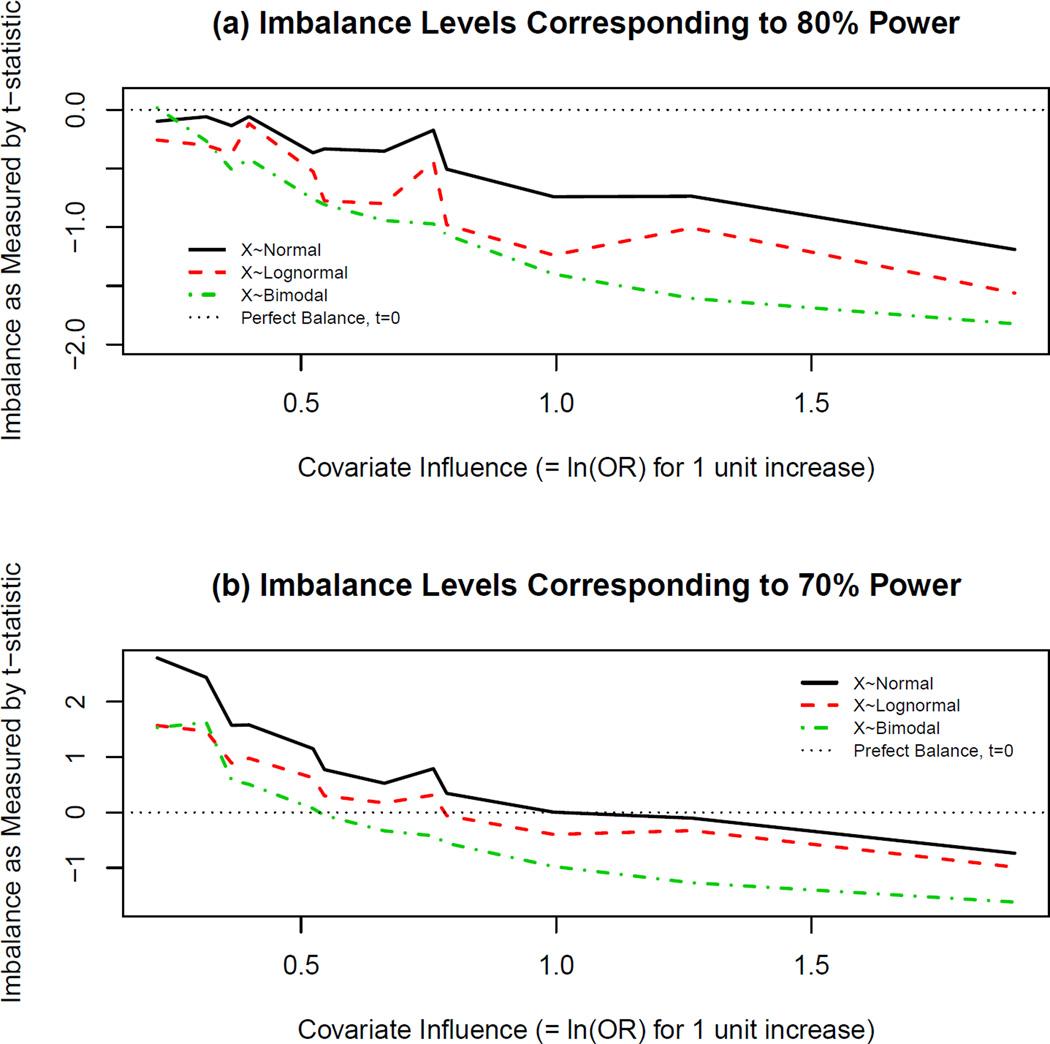
Imbalance Levels Corresponding to Specific Levels of Estimated Power in Logistic Scenarios. Using the Generalized Linear Models (GLMs) whose summary information is depicted in Table 1, t-statistic estimates corresponding to estimated power of (a)80% and (b)70%, were calculated and plotted for various levels of covariate influence (βx in equation (2)). Note that the absolute value of βx is plotted here, and the covariate negatively influences outcome in this case. Thus, positive levels of imbalance (t>0) correspond to a poorer baseline prognosis in the active treatment arm. The horizontal line at t=0 corresponds to perfect continuous baseline covariate balance, and in most cases, even perfect balance does not result in the desired (a)80% power (or sometimes even (b)70% power). As the imbalance shifts in a negative direction such that the treatment arm is favored, the estimated desired power is achieved.
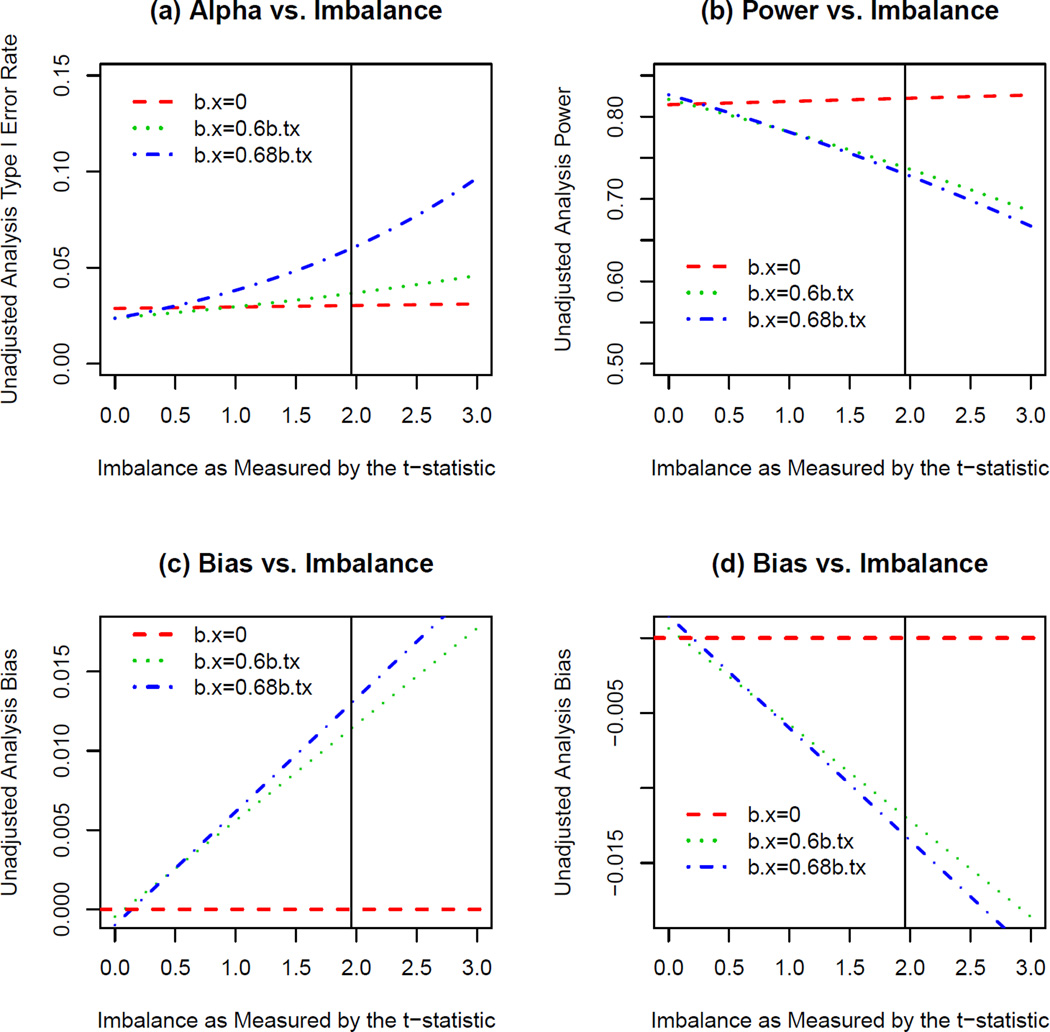
Effects of Imbalance on Unadjusted Analysis when Outcome is Exponentially Related to Treatment and Covariate. These plots show the estimated (a) type I error rate, (b) power, and (c,d) bias for given levels of imbalance defined by the t-statistic comparing mean covariate values across two treatment groups in an unadjusted analysis in the exponential scenarios. The t-statistic values greater than zero correspond to larger values of the covariate in the active treatment group. Plots (a) and (c) correspond to effects on these parameters for a covariate that is positively associated with outcome (treatment group favored at baseline) and plots (b) and (d) correspond to effects on these parameters for a covariate that is negatively associated with outcome (placebo group favored at baseline).
References
-
- Agresti A. Categorical Data Analysis. 2nd edition. Wiley; 2002.
-
- Agresti A, Hartzel J. Tutorial in biostatistics: Strategies comparing treatment on binary response with multi-centre data. Statistics in Medicine. 2000;19:1115–1139. - PubMed
-
- Austin P, Manca A, Zwarenstein M, Juurlink D, Stanbrook M. A substantial and confusing variation exists in the handling of baseline covariates in randomized controlled trials: A review of trials published in leading medical journals. Journal of Clinical Epidemiology. 2010;63:142–153. - PubMed
-
- Blizzard L, Hosmer DW. Parameter estimation and goodness-of-fit in log binomial regression. Biometrical Journal. 2006;48:5–22. - PubMed
MeSH terms
Substances
Grants and funding
LinkOut - more resources
Full Text Sources
Other Literature Sources
Medical