. 2013 Oct 20;12(1):124.
doi: 10.1186/1476-4598-12-124.

Frequent concerted genetic mechanisms disrupt multiple components of the NRF2 inhibitor KEAP1/CUL3/RBX1 E3-ubiquitin ligase complex in thyroid cancer

Affiliations

Frequent concerted genetic mechanisms disrupt multiple components of the NRF2 inhibitor KEAP1/CUL3/RBX1 E3-ubiquitin ligase complex in thyroid cancer

Victor D Martinez et al. Mol Cancer. .

Abstract

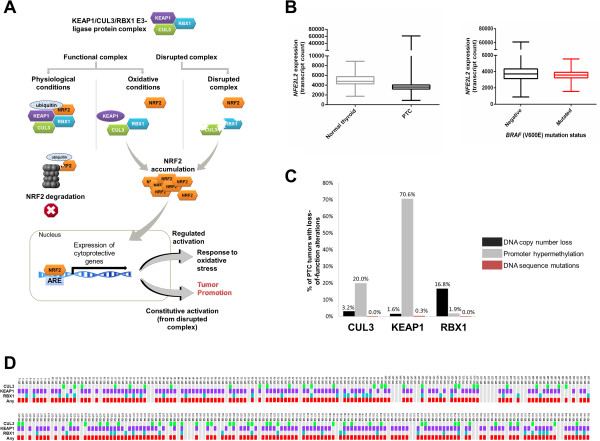
Background: Reactive oxygen species contribute to normal thyroid function. The NRF2 oxidative response pathway is frequently and constitutively activated in multiple tumor types, including papillary thyroid carcinoma (PTC). Genetic mechanisms underlying NRF2 pathway activation in PTC are not fully understood. Thus, we aimed to determine whether inactivating patterns of DNA-level alterations affect genes encoding for individual NRF2 inhibitor complex components (CUL3/KEAP1/RBX1) occur in PTC.

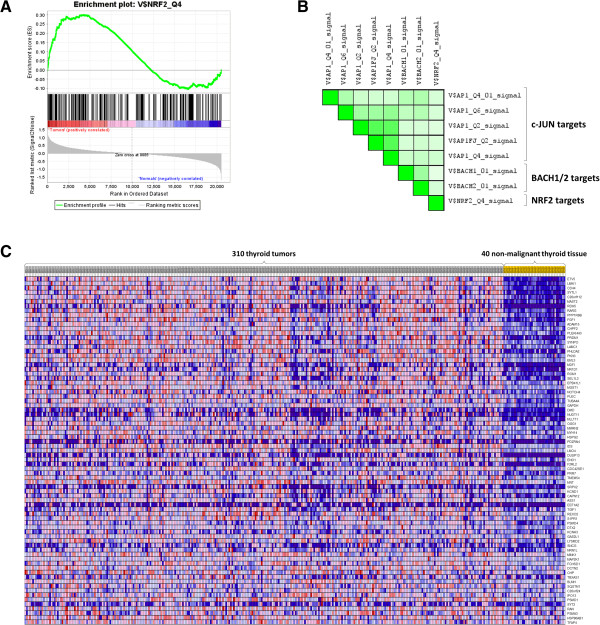
Findings: Combined patterns of epi/genetic alterations for KEAP1/CUL3/RBX1 E3 ubiquitin-ligase complex components were simultaneously interrogated for a panel of 310 PTC cases and 40 adjacent non-malignant tissues. Data were obtained from The Cancer Genome Atlas project. Enrichment of NRF2 pathway activation was assessed by gene-set enrichment analysis using transcriptome data. Our analyses revealed that PTC sustain a strikingly high frequency (80.6%) of disruption to multiple component genes of the NRF2 inhibitor complex. Hypermethylation is the predominant inactivating mechanism primarily affecting KEAP1 (70.6%) and CUL3 (20%), while copy number loss mostly affects RBX1 (16.8%). Concordantly, NRF2-associated gene expression signatures are positively and significantly enriched in PTC.

Conclusions: The KEAP1/CUL3/RBX1 E3-ubiquitin ligase complex is almost ubiquitously affected by multiple DNA-level mechanisms and downstream NRF2 pathway targets are activated in PTC. Given the importance of this pathway to normal thyroid function as well as to cancer; targeted inhibition of NRF2 regulators may impact strategies for therapeutic intervention involving this pathway.


Figures

Figure 1
Figure 1
KEAP1/CUL3/RBX1 E3-ligase protein complex. (A) KEAP1/CUL3/RBX1 E3-ligase protein complex exert different functions under physiological and oxidative conditions. In the absence of oxidative stress (left path), NRF2 protein level and activity is maintained at low levels through interaction with the KEAP1/CUL3/RBX1 E3-ubiquitin ligase complex. When NRF2 interacts with KEAP1, it is targeted for ubiquitination and proteasomal degradation. Under oxidative conditions (middle path), KEAP1 undergoes conformational changes, which impedes interaction with NRF2, resulting in its accumulation and translocation to the nucleus. When the KEAP1/CUL3/RBX1 E3-ubiquitin ligase complex is disrupted by absence or alteration of any of its components (right path), NRF2 is stabilized, accumulated and translocate to the nucleus. In the nucleus, NRF2 can induce expression of genes containing NRF2-regulatory sequence motifs (e.g., antioxidant response elements, AREs). Constitutive activation of NRF2, as a result of complex disruption, has been linked to tumor promotion. (B) On the left: expression levels of NFE2L2 gene in normal thyroid (grey) and tumors (black). Levels of NFE2L2 were significantly higher (p < 0.0001, Mann Whitney test) in tumors compared with normal tissue. On the right: Comparison of mRNA expression levels between samples carrying BRAF V600E mutation (red) versus those without alteration (black) (C) Different types of DNA level alterations affecting each individual complex. Figure shows the patterns and frequency of DNA copy number losses (black), hypermethylation (grey), and mutation (red) affecting each complex component (D) Status of individual complex components across a panel of 310 PTC tumors. Each row represents an individual complex component affected by any disrupting mechanisms: CUL3 (green), KEAP1 (purple), and/or RBX1 (blue). Presence of any alteration on an individual complex component is showed in red.
Figure 2
Figure 2
PTC tumors are significantly and positively enriched for gene sets corresponding NRF2 related functions. (A) A gene set (V$NRF2_Q4) consisting of NFE2L2 transcriptional targets was significantly and positively enriched in PTC tumor relative to non-malignant tissues. For PTC tumors, normalized enrichment score (ES) = 1.42, p-value = 0.023. ES (green line) represent the probability that the gene set is positively (left side) or negatively (right side) enriched in a ranked gene list. Genes are first ranked based on differences between tumor and normal groups. Ranked genes that appear in the defined gene set are indicated as “Hits” below the Enrichment profile (black hash marks). Genes ranked near the top of the gene list are underscored with a red bar, whereas genes near the bottom of the list are underscored with a blue bar. (B) A Leading Edge Analysis comparing whether highly ranked genes corresponding to different gene sets overlapped. Highest ranked genes refer to those most highly differentially expressed genes between tumors compared to normals. Leading edge genes (i.e. those most different at level of expression between PTC tumors and normals) that correspond to highly statistically significantly enriched gene sets overlap with NRF2 transcriptional targets. These gene sets corresponded to functions related to NRF2, such as c-JUN (AP1 gene sets), a well-known transcriptional activator of NFE2L2, and BACH1 and 2, which are transcriptional repressors that compete with NRF2 to bind ARE. 100% and 0% overlap in leading edge genes are indicated by dark green and white, respectively. (C) A gene expression heatmap was generated for NRF2 transcriptional target genes that are over-expressed in PTC tumors relative to normals. Expression values for each gene are represented as colors, where the range of colors (red, pink, light blue, dark blue) shows the range of expression values (high, moderate, low, lowest).

References

    1. Poncin S, Van Eeckoudt S, Humblet K, Colin IM, Gerard AC. Oxidative stress: a required condition for thyroid cell proliferation. Am J Pathol. 2010;12:1355–1363. doi: 10.2353/ajpath.2010.090682. - DOI - PMC - PubMed
    1. Poncin S, Colin IM, Gerard AC. Minimal oxidative load: a prerequisite for thyroid cell function. J Endocrinol. 2009;12:161–167. doi: 10.1677/JOE-08-0470. - DOI - PubMed
    1. Ganan-Gomez I, Wei Y, Yang H, Boyano-Adanez MC, Garcia-Manero G. Oncogenic functions of the transcription factor Nrf2. Free Radic Biol Med. 2013;12:750. - PubMed
    1. Ziros PG, Manolakou SD, Habeos IG, Lilis I, Chartoumpekis DV, Koika V, Soares P, Kyriazopoulou VE, Scopa CD, Papachristou DJ, Sykiotis GP. Nrf2 Is commonly activated in papillary thyroid carcinoma, and it controls antioxidant transcriptional responses and viability of cancer cells. J Clin Endocrinol Metab. 2013;12(8):E1422. doi: 10.1210/jc.2013-1510. - DOI - PubMed
    1. Cullinan SB, Gordan JD, Jin J, Harper JW, Diehl JA. The Keap1-BTB protein is an adaptor that bridges Nrf2 to a Cul3-based E3 ligase: oxidative stress sensing by a Cul3-Keap1 ligase. Mol Cell Biol. 2004;12:8477–8486. doi: 10.1128/MCB.24.19.8477-8486.2004. - DOI - PMC - PubMed

Publication types

MeSH terms