. 2013 Oct 16;80(2):350-7.
doi: 10.1016/j.neuron.2013.08.007.

Subthreshold mechanisms underlying state-dependent modulation of visual responses

Affiliations

Subthreshold mechanisms underlying state-dependent modulation of visual responses

Corbett Bennett et al. Neuron. .

Abstract

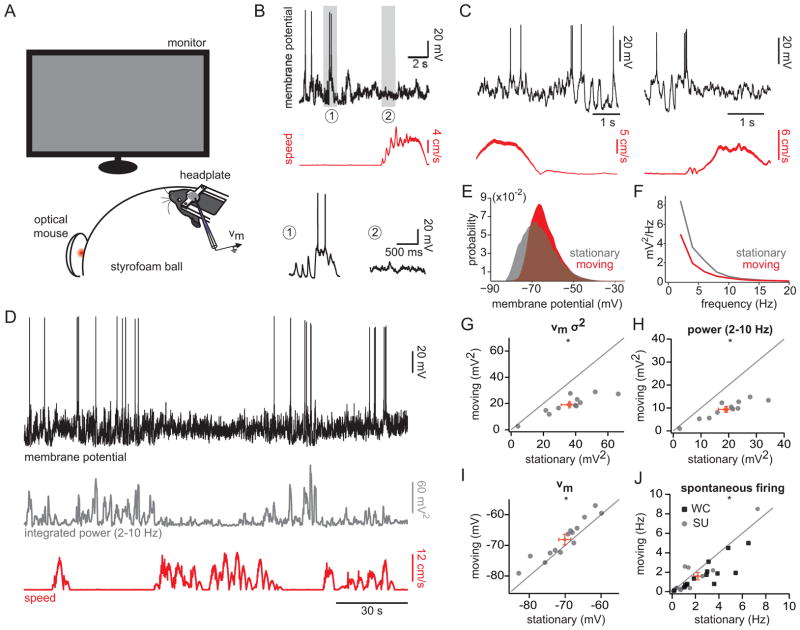
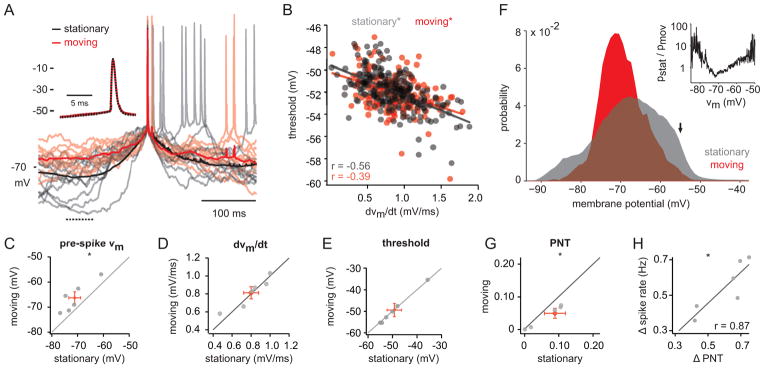
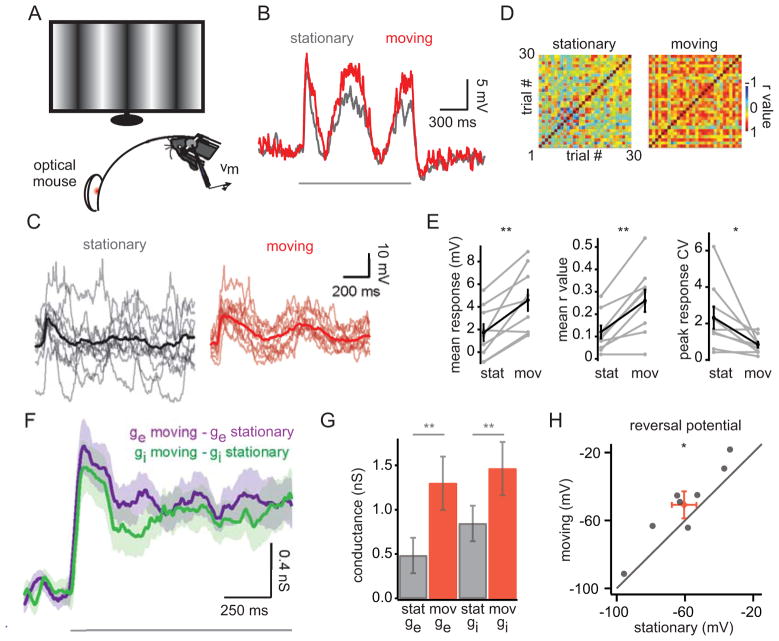
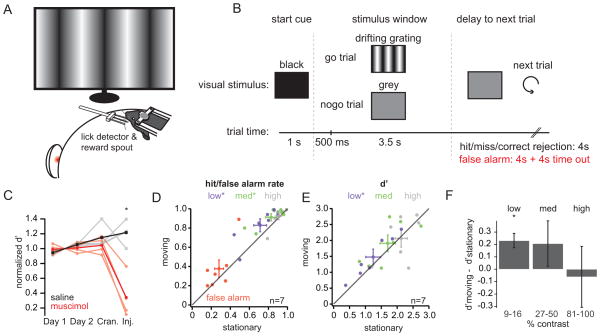
The processing of sensory information varies widely across behavioral states. However, little is known about how behavioral states modulate the intracellular activity of cortical neurons to effect changes in sensory responses. Here, we performed whole-cell recordings from neurons in upper-layer primary visual cortex of awake mice during locomotion and quiet wakefulness. We found that the signal-to-noise ratio for sensory responses was improved during locomotion by two mechanisms: (1) a decrease in membrane potential variability leading to a reduction in background firing rates and (2) an enhancement in the amplitude and reliability of visually evoked subthreshold responses mediated by an increase in total conductance and a depolarization of the stimulus-evoked reversal potential. Consistent with the enhanced signal-to-noise ratio for visual responses during locomotion, we demonstrate that performance is improved in a visual detection task during this behavioral state.


Figures

Figure 1
Figure 1. Intracellular correlates of behavioral state in mouse visual cortex
(A) Experimental set-up. (B) Membrane potential of a V1 neuron (top) and speed (middle). Bottom, insets of membrane potential during (1) stationary and (2) moving epochs. (C) Example membrane potential recordings and speed measurements for two additional neurons. (D) Membrane potential for cell in (B) (top) plotted with the integral of the power density function in the 2–10 Hz band (middle) and speed (bottom). (E) All-point histogram of membrane potential during stationary and moving states for cell in (B). (F) Power spectrum density for stationary and moving states for cell in (B). (G–J) Population plots for membrane potential variance (G), 2–10 Hz power (H), membrane potential (I), and spontaneous firing rate (J) for stationary and moving states. Grey and black symbols represent individual cells. Red symbols represent the mean ± SEM. WC: whole-cell; SU: single-unit. *, p < 0.01, Wilcoxon signed-rank test. See also Figure S1.
Figure 2
Figure 2. Reduced spiking during movement reflects decreased variance and not change in spike threshold
(A) Average action potential waveforms for stationary (black) and moving (red) epochs for a representative neuron. Light traces depict individual trials. Dotted line on bottom left denotes pre-spike interval used in (C). Inset: Expanded time scale. Black trace is dotted to reveal overlap between conditions. (B) Threshold for spikes during stationary (grey) and moving (red) epochs plotted against the mean dVm/dt during the 10 ms prior to spike initiation. Lines represent fits to the data. (C–E) Pre-spike Vm (C), dVm/dt (D), and spike threshold (E) is plotted for moving vs. stationary epochs (n = 6 neurons). (F) All-point histogram of membrane potential during stationary and moving epochs for one neuron. Arrow denotes spike threshold. Inset: ratio of all-point histograms (stationary/moving) for stationary and moving epochs demonstrates relative likelihood of membrane potentials for the two conditions. (G) Probability near threshold (PNT) for stationary and moving epochs (n=6 neurons). (H) Difference in spike rate (stationary-moving) plotted against difference in PNT. Red symbols represent the mean ± SEM. *, p < 0.05; Wilcoxon signed-rank test. See also Figure S2.
Figure 3
Figure 3. Visual responses are larger and more reliable during movement
(A) Experimental set-up. Drifting sinusoidal gratings were presented (16% contrast for current clamp recordings (B–E); 100% contrast for voltage clamp recordings (F–H); ~1.2 s grating presentation interleaved with ~3.8 s of grey screen). (B) Averaged visual response for one neuron for stationary (grey) and moving (red) states. Grey bar denotes stimulus presentation. (C) Single trial (light traces) and averaged responses (bold traces) for stationary and moving states for an example neuron. (D) Trial-to-trial correlation matrix of visual responses for stationary (left) and moving (right) states for the neuron in (C). (E) Mean stimulus response (averaged over the entire stimulus presentation), mean r value, and coefficient of variation (CV; calculated for the response peak) for population of neurons (n=9). (F) Difference in excitatory (purple) and inhibitory (green) conductances between stationary and moving states averaged across 10 neurons. Transparency represents SEM. (G) Mean ge and gi are depicted for the stationary and moving states. Values represent the mean across the stimulus window; error bars represent the SEM. (H) Reversal potential of the stimulus-evoked conductances for stationary and moving states (n=8). Red symbol represents the mean ± SEM. *, p < 0.05; **, p < 0.01 Wilcoxon signed-rank test. See also Figure S3.
Figure 4
Figure 4. Visual detection is improved during movement
(A) Experimental set-up. (B) Behavioral paradigm. Trials began with a start cue (1s; black screen) followed by a stimulus window (4s; drifting gratings or grey screen). Licks during the first 500 ms of the stimulus window were neither punished nor rewarded. Following the stimulus presentation, there was an inter-trial period of either 4 seconds (for hit, miss, and correct rejection trials) or 8 seconds (for false alarm trials). (C) Normalized discriminability (d′) for two cohorts of mice receiving saline (grey traces, individual mice; black trace, average) or the GABAA agonist muscimol (light red traces, individual mice; red trace, average). Performance was normalized to mean d′ over days 1 and 2. Cran.: day of craniotomy; inj.: day of injection. (D) False alarm rates (red), low contrast hit rates (9–16% contrast; purple), medium contrast hit rates (27–50% contrast; green), and high contrast hit rates (81–100% contrast; grey) are plotted for stationary and moving states. Diamonds with error bars represent the mean ± SEM. (E) d′ for low, medium, and high contrasts plotted for stationary and moving states. Colors and symbols as in (D). (F) Difference in d′ for stationary and moving states averaged across seven mice. *, p<0.05, Wilcoxon signed-rank test. See also Figure S4.

References

    1. Aston-Jones G, Bloom FE. Activity of norepinephrine-containing locus coeruleus neurons in behaving rats anticipates fluctuations in the sleep-waking cycle. The Journal of neuroscience : the official journal of the Society for Neuroscience. 1981;1:876–886. - PMC - PubMed
    1. Ayaz A, Saleem AB, Scholvinck ML, Carandini M. Locomotion controls spatial integration in mouse visual cortex. Current biology : CB. 2013;23:890–894. - PMC - PubMed
    1. Azouz R, Gray CM. Dynamic spike threshold reveals a mechanism for synaptic coincidence detection in cortical neurons in vivo. Proceedings of the National Academy of Sciences of the United States of America. 2000;97:8110–8115. - PMC - PubMed
    1. Azouz R, Gray CM. Adaptive coincidence detection and dynamic gain control in visual cortical neurons in vivo. Neuron. 2003;37:513–523. - PubMed
    1. Berger H. Über das elektrenkephalogramm des menschen. European Archives of Psychiatry and Clinical Neuroscience. 1929;87:527–570.

Publication types