. 2013 Dec 5;13(6):734-44.
doi: 10.1016/j.stem.2013.09.015. Epub 2013 Oct 17.

Transplantation of expanded fetal intestinal progenitors contributes to colon regeneration after injury

Affiliations

Transplantation of expanded fetal intestinal progenitors contributes to colon regeneration after injury

Robert P Fordham et al. Cell Stem Cell. .

Abstract

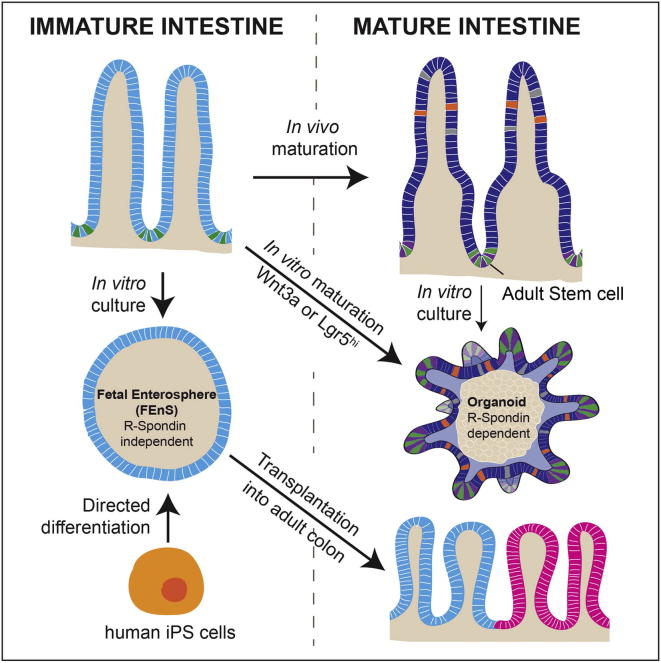
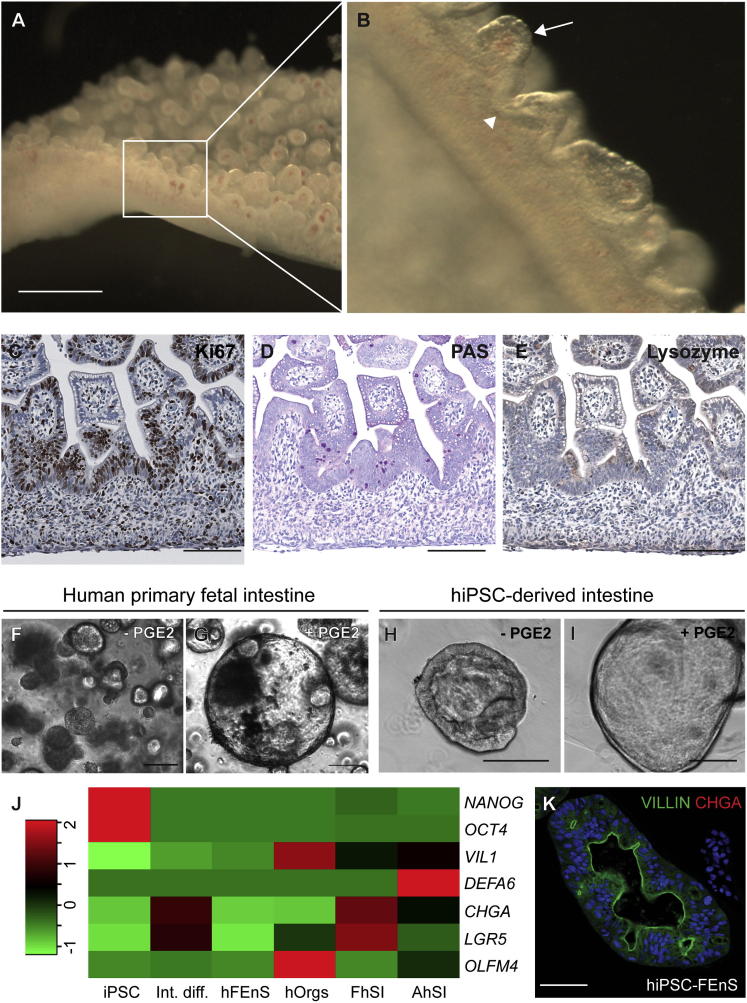
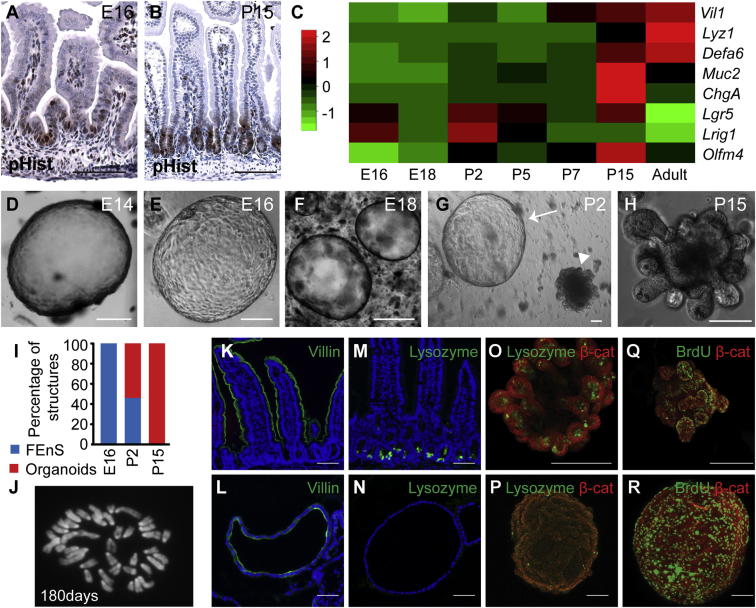
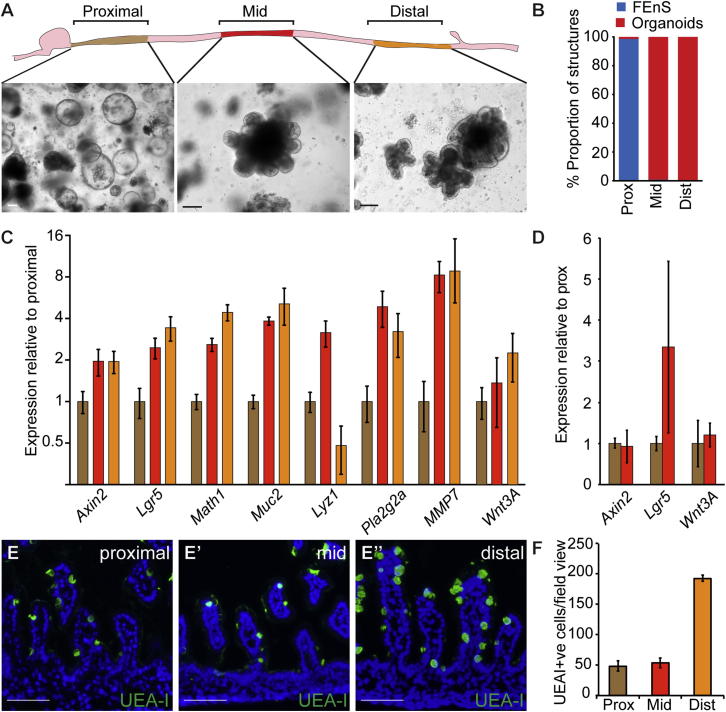
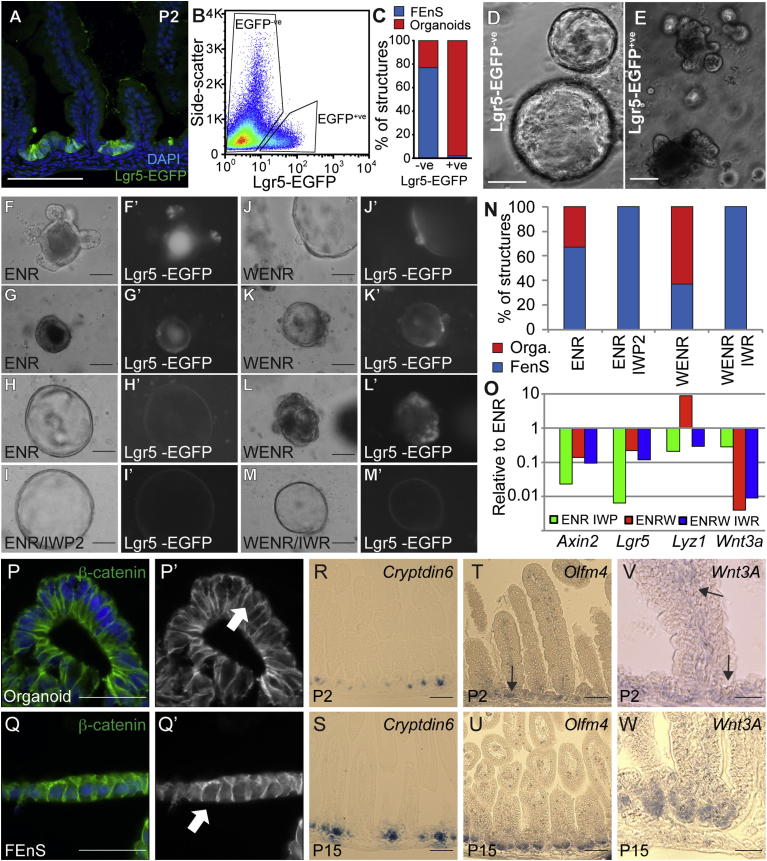
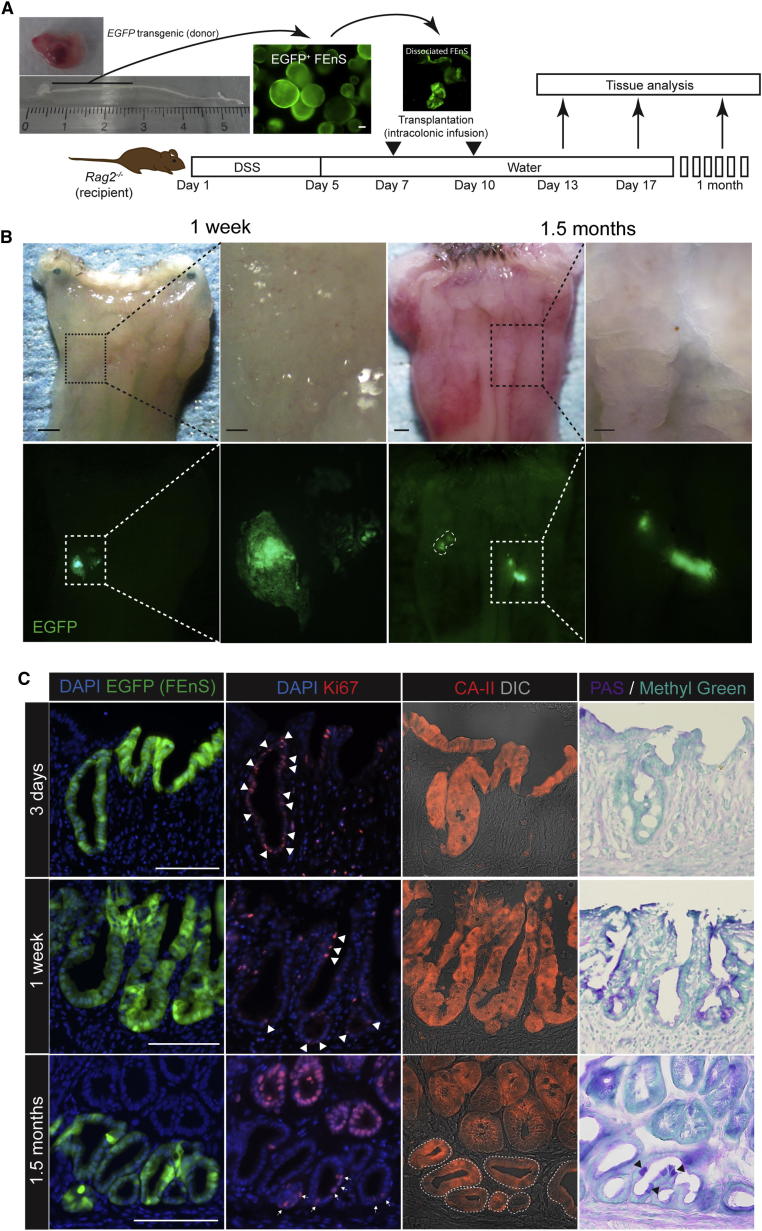
Regeneration and homeostasis in the adult intestinal epithelium is driven by proliferative resident stem cells, whose functional properties during organismal development are largely unknown. Here, we show that human and mouse fetal intestine contains proliferative, immature progenitors, which can be expanded in vitro as Fetal Enterospheres (FEnS). A highly similar progenitor population can be established during intestinal differentiation of human induced pluripotent stem cells. Established cultures of mouse fetal intestinal progenitors express lower levels of Lgr5 than mature progenitors and propagate in the presence of the Wnt antagonist Dkk1, and new cultures can be induced to form mature intestinal organoids by exposure to Wnt3a. Following transplantation in a colonic injury model, FEnS contribute to regeneration of colonic epithelium by forming epithelial crypt-like structures expressing region-specific differentiation markers. This work provides insight into mechanisms underlying development of the mammalian intestine and points to future opportunities for patient-specific regeneration of the digestive tract.


Figures

None
Graphical abstract
Figure 1
Figure 1
Derivation of Immature Intestinal Progenitors from Human Fetal and Pluripotent Cells (A) Whole mount of human gestational week 10 small intestine. (B) Higher magnification of villi (arrow) and intervillus regions (arrowhead) in (A). (C–E) Immunohistochemistry analysis for Ki67 (C), PAS staining (D), and Lysozyme (E) in week 10 human small intestine. (F and G) Spheroid cultures from week 10 human small intestinal epithelium, grown with (G) and without (F) prostaglandin E2 (PGE2) (2.5 μM). (H and I) Intestinal tissue derived from directed differentiation of human induced pluripotent stem cells (hiPSCs), cultured with (I) and without (H) PGE2. (J) Relative expression levels of intestinal lineage markers in material from undifferentiated human induced pluripotent stem cells (hiPSC), iPSC-derived intestine (Int. diff.), human primary fetal enterospheres (hFEnS), human adult organoids (hOrgs), primary fetal human small intestine (FhSI), and primary adult human small intestine (AhSI). Red and green colors reflect increased and decreased deviation from the mean, respectively. (K) Detection of VILLIN (green) and CHGA (red) in hiPSC-FEnS. The scale bars represent 2 mm in (A) and 100 μm in (C)–(E) and (K). See also Figure S1 and Table S1.
Figure 2
Figure 2
Establishment of mFEnS from Immature Mouse Intestine (A and B) Immunohistochemistry analysis for Phospho-Histone-H3 (pHist) on sections of small intestine from E16 mice (A) and P15 mice (B). (C) Relative expression levels of intestinal lineage markers in tissue isolated from proximal murine intestine at increasing developmental age from E16 to adult. Red and green colors reflect increased and decreased deviation from the mean, respectively. (D–H) Representative images of in vitro structures derived from E14 to P15. The arrow and arrowhead in (G) indicate an FEnS and an organoid, respectively. (I) Relative proportions of FEnS and organoids present after 2 weeks from E16, P2, and P15 tissues. (J) Metaphase spread of a cell at day 180 shows a normal karyotype (n = 15). (K and L) Detection of apical villin expression (green) in adult small intestine (K) and mFEnS (L). (M–P) Lysozyme expression in adult small intestine (M), cross sections of mFEnS (N), and whole-mount organoids and mFEnS (O and P). (Q and R) BrdU incorporation analysis in whole mounts of organoids and FEnS (green). β-catenin (red) is used as a counterstain. The scale bars represent 100 μm. E, embryonic day; P, postnatal day; adult, >3 weeks postnatal. See also Figures S2 and S3.
Figure 3
Figure 3
Adult Stem Cell Behavior Follows a Caudal to Rostral Pattern (A) Schematic diagram of the Proximal, Mid, and Distal parts of the small intestine and the representative images of cultures derived at P2. (B) Relative proportion of FEnS and organoids in the different sections of the small intestine. (C) Expression analysis in material isolated from Proximal, Mid, and Distal regions. Data represent the mean, and the error bars, the SEM (n = 3). Data are expressed relative to Proximal, on a Log2 scale. (D) Expression analysis of cultures from proximal and mid intestine enriched for FEnS and organoids, respectively. Data represent the mean, and the error bars, the SEM (n = 3), and are normalized to proximal cultures. (E) Detection of cells of the secretory lineage based on binding of Ulex europaeus agglutinin I (UEA-I) in the proximal, mid, and distal small intestine. (F) Quantification of UEA-I+ve cells. Data represent the mean, and the error bars, the SEM (n = 3). The scale bars represent 100 μm.
Figure 4
Figure 4
In Vitro Maturation of Fetal Enteric Progenitors Is Associated with Lgr5 Expression and Wnt Signaling (A) Detection of Lgr5-EGFP at P2 from Lgr5-EGFP-ires-CreERT2 mice. (B) Isolation of Lgr5-EGFP+ve and Lgr5-EGFP−ve epithelial cells from P2 small intestine by flow cytometry. (C) Quantification of proportion of FEnS and organoids formed in vitro from Lgr5-EGFP−ve and Lgr5-EGFP+ve neonatal intestinal epithelial cells. (D and E) Representative images of structures formed in vitro from Lgr5-EGFP−ve and Lgr5-EGFP+ve neonatal intestinal epithelial cells. (F–M) Representative images of FEnS and organoids derived from Lgr5-EGFP-ires-CreERT2 mice and cultured in the presence of EGF, Noggin, and R-spondin1 (ENR), ENR and the porcupine inhibitor IWP2 (ENR/IWP2), ENR and Wnt3a (WENR), or WENR in the presence of the tankyrase inhibitor IWR (WENR/IWR). (F′)–(M′) show grayscale images of EGFP in the derived structures. (N) Quantification of proportion of FEnS and organoids formed in the different treatment groups (ENR: 18/8; ENR/IWP2: 26/0; WENR: 21/30; WENR/IWR: 33/0). Two-tailed Fisher’s exact test shows significant difference between ENR and ENR/IWP2 (p = 0.0042), ENR and WENR (p = 0.0297), and WENR and WENR/IWR (p < 0.0001). (O) Expression analysis of the different treatment groups normalized to the ENR condition. Data represent the mean (n = 2). (P and Q) Detection of β-catenin (green) in organoids and FEnS. Arrows indicate cells with nuclear localization of β-catenin suggestive of active signaling. P‘-Q’ show β-catenin expression in grayscale. (R–W) In situ hybridization for Cryptdin6, Olfm4, and Wnt3a in tissue from P2 and P15. Arrows in (S) and (U) indicate regions of Olfm4 and Wnt3A expression, respectively. The scale bars represent 50 μm (F, J, K–L, P–Q, and V–W) or 100 μm (A, D–E, G–I, M, and R–U). Cells are counterstained with DAPI (blue) in (A), (O), (P) and (Q). See also Figure S4 and Movie S1, Movie S2, and Movie S3.
Figure 5
Figure 5
Regeneration of Adult Colonic Epithelium from mFEnS (A) Experimental protocol: gastrointestinal tract dissected from E16 EGFP transgenic mouse fetus (top left). Proximal small intestine was cultured in vitro as FEnS before mechanical dissociation and intracolonic transplantation into Rag2−/− adult recipients with Dextran Sulfate Sodium (DSS)-induced ulcerative colitis. (B) Recipient colon at 1 week and 1.5 months posttransplantation. Lower panel shows EGFP+ve areas in host colon. (C) Immunohistological analysis of EGFP+ve fetal-derived engraftments for Ki67 (Ki67+ve cells marked by arrowheads), carbonic anhydrase II, and PAS, 3 days, 1 week, and 1.5 months after transplantation. The scale bars represent 1 mm (whole colons) and 200 μm (magnified areas) in (B) and 100 μm in (C). See also Figure S5.

References

    1. Barker N., van Es J.H., Kuipers J., Kujala P., van den Born M., Cozijnsen M., Haegebarth A., Korving J., Begthel H., Peters P.J., Clevers H. Identification of stem cells in small intestine and colon by marker gene Lgr5. Nature. 2007;449:1003–1007. - PubMed
    1. Barker N., van Oudenaarden A., Clevers H. Identifying the stem cell of the intestinal crypt: strategies and pitfalls. Cell Stem Cell. 2012;11:452–460. - PubMed
    1. Brown S., Teo A., Pauklin S., Hannan N., Cho C.H.-H., Lim B., Vardy L., Dunn N.R., Trotter M., Pedersen R., Vallier L. Activin/Nodal signaling controls divergent transcriptional networks in human embryonic stem cells and in endoderm progenitors. Stem Cells. 2011;29:1176–1185. - PubMed
    1. de Lau W., Barker N., Low T.Y., Koo B.K., Li V.S., Teunissen H., Kujala P., Haegebarth A., Peters P.J., van de Wetering M. Lgr5 homologues associate with Wnt receptors and mediate R-spondin signalling. Nature. 2011;476:293–297. - PubMed
    1. Farin H.F., Van Es J.H., Clevers H. Redundant sources of Wnt regulate intestinal stem cells and promote formation of Paneth cells. Gastroenterology. 2012;143:1518–1529. e1517. - PubMed

Publication types

MeSH terms