. 2013 Oct 24;155(3):567-81.
doi: 10.1016/j.cell.2013.09.042. Epub 2013 Oct 17.

Hypermutation of the inactive X chromosome is a frequent event in cancer

Affiliations

Hypermutation of the inactive X chromosome is a frequent event in cancer

Natalie Jäger et al. Cell. .

Abstract

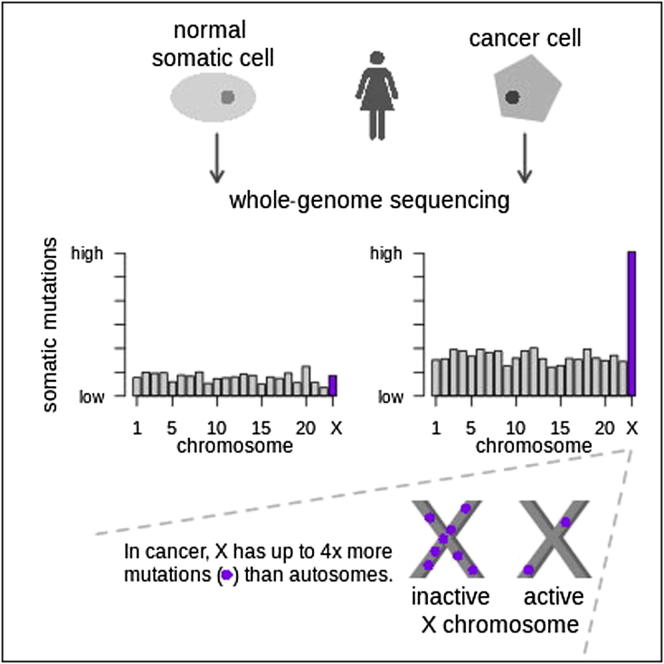
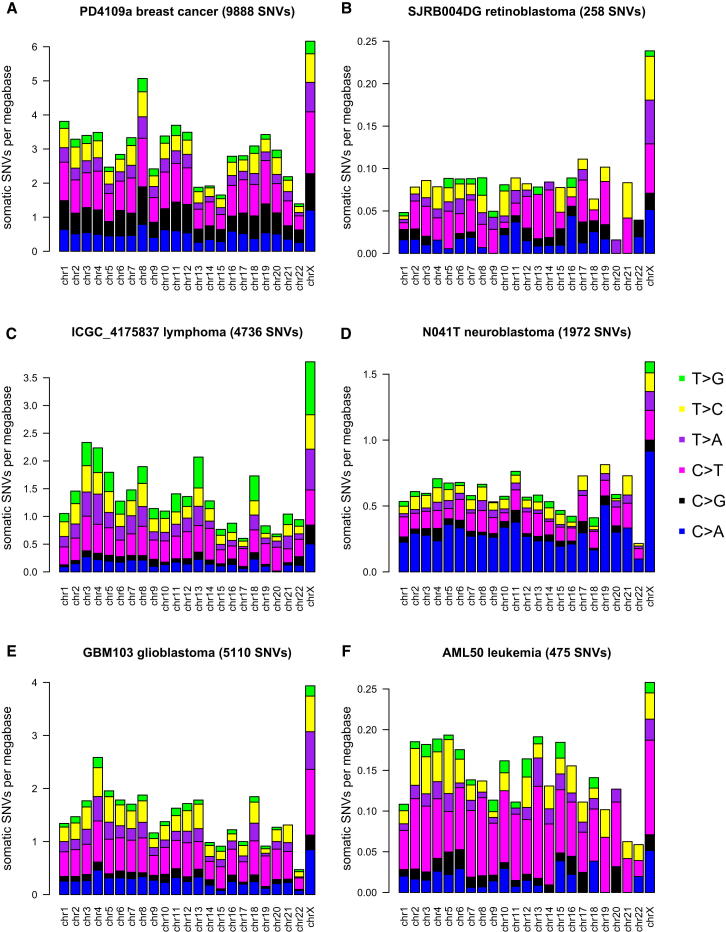
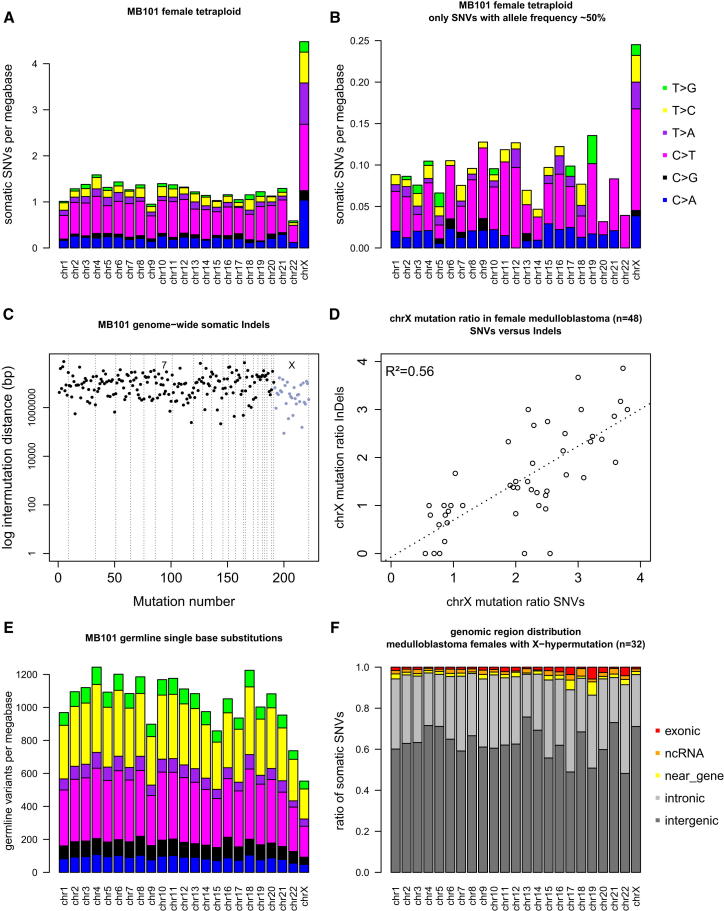
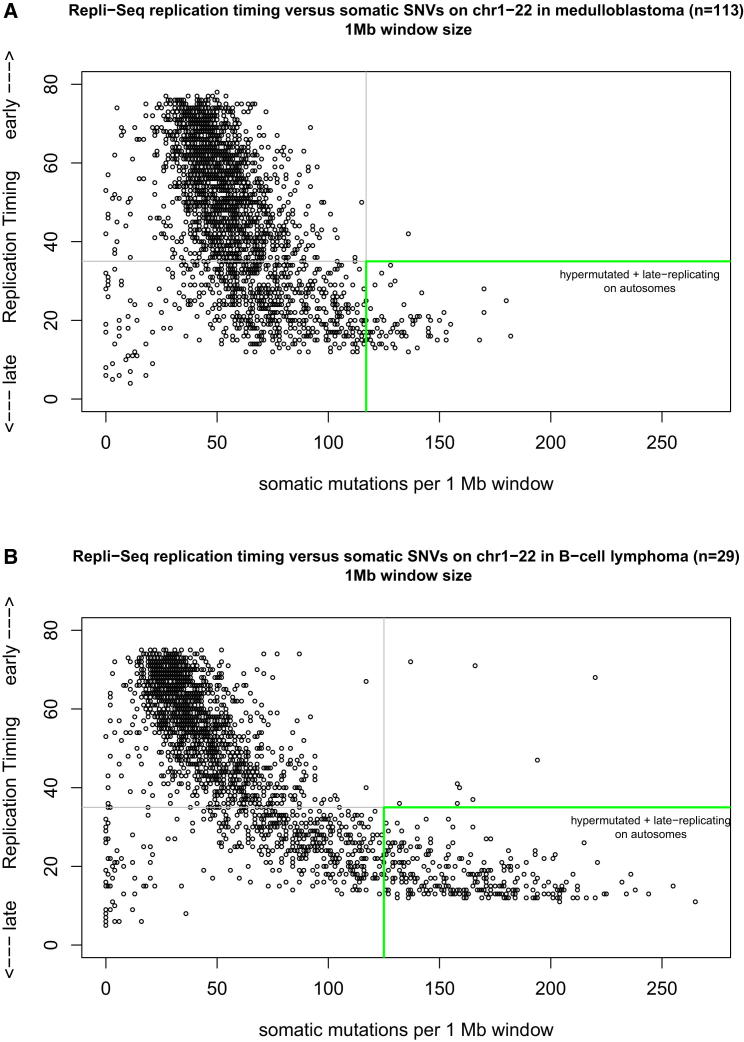
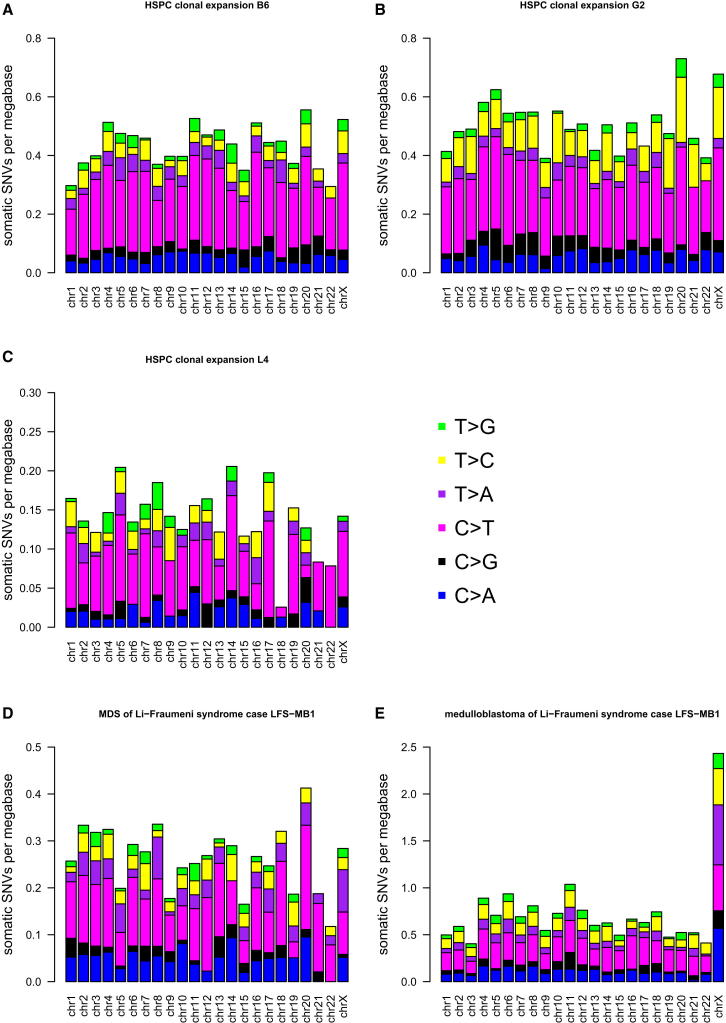
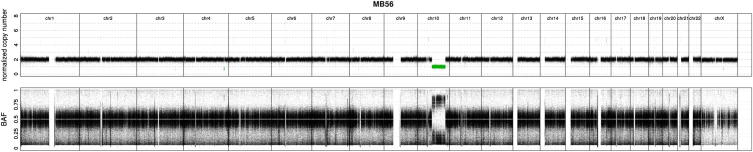
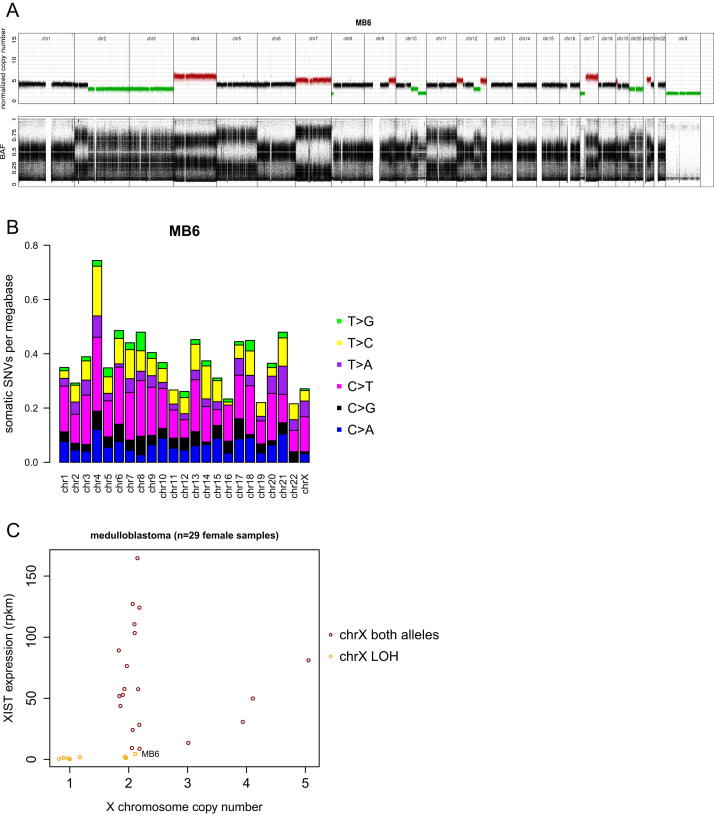
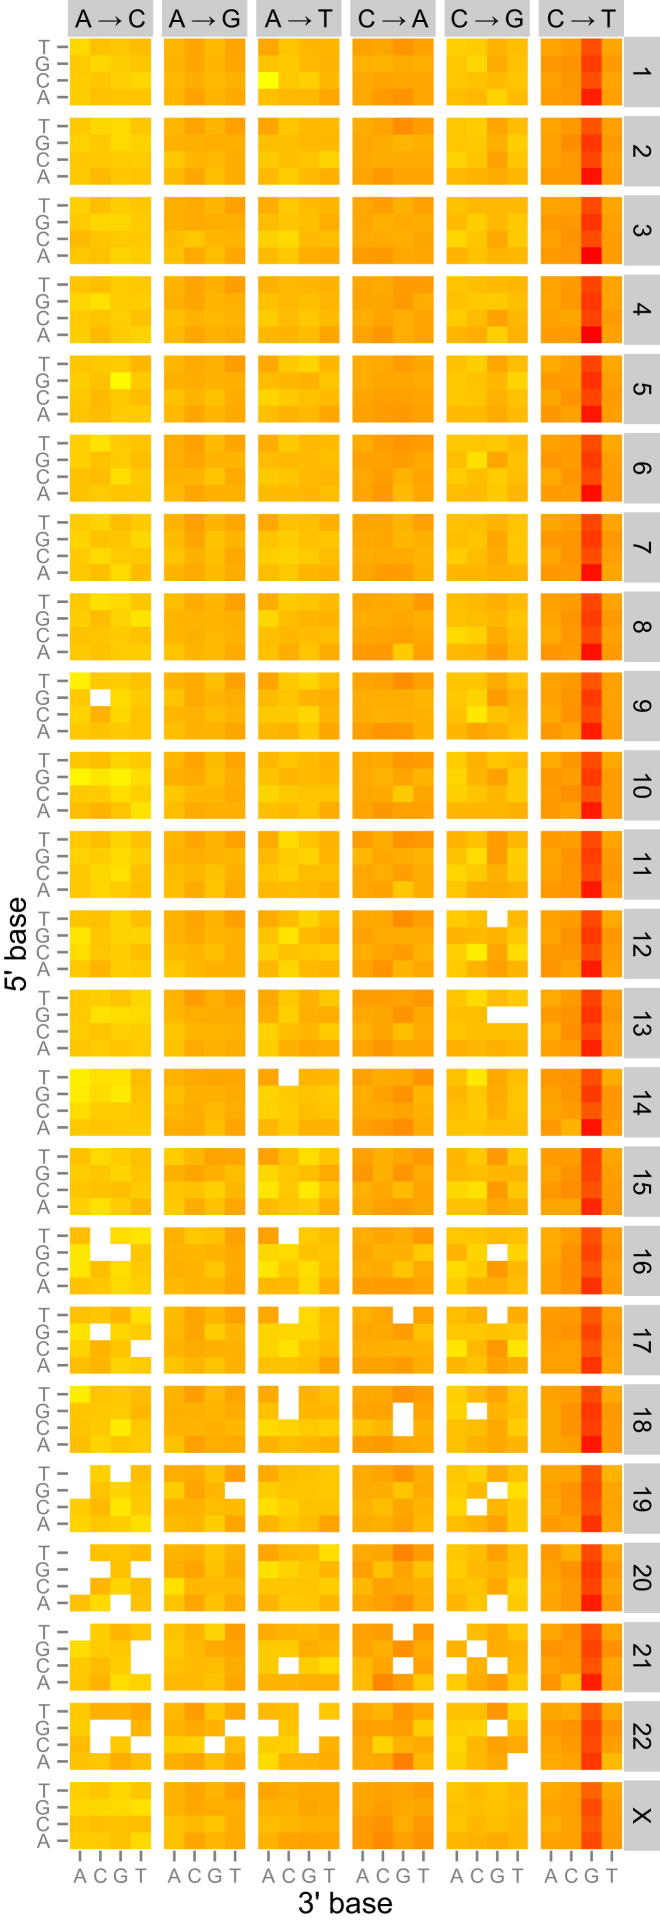
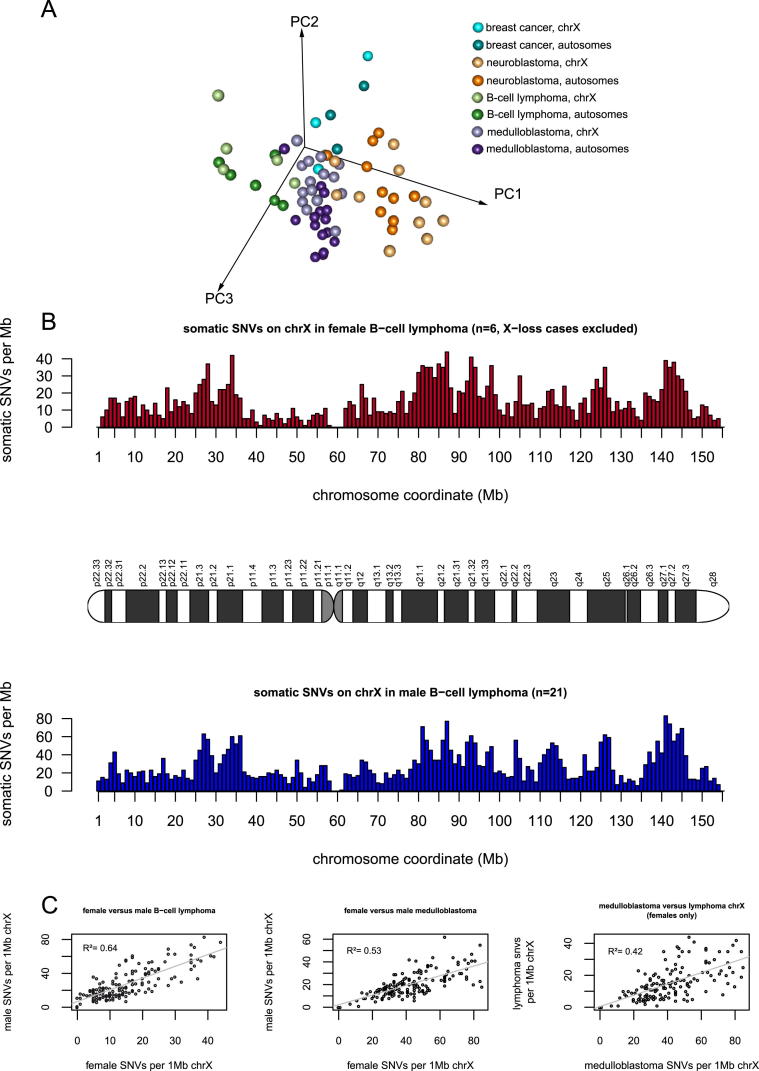
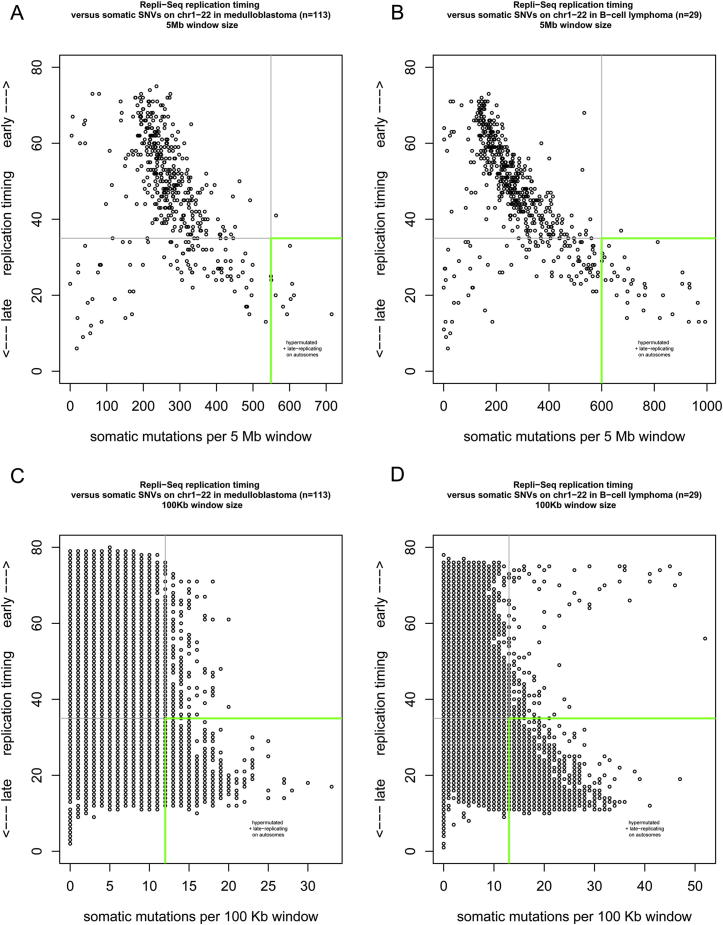
Mutation is a fundamental process in tumorigenesis. However, the degree to which the rate of somatic mutation varies across the human genome and the mechanistic basis underlying this variation remain to be fully elucidated. Here, we performed a cross-cancer comparison of 402 whole genomes comprising a diverse set of childhood and adult tumors, including both solid and hematopoietic malignancies. Surprisingly, we found that the inactive X chromosome of many female cancer genomes accumulates on average twice and up to four times as many somatic mutations per megabase, as compared to the individual autosomes. Whole-genome sequencing of clonally expanded hematopoietic stem/progenitor cells (HSPCs) from healthy individuals and a premalignant myelodysplastic syndrome (MDS) sample revealed no X chromosome hypermutation. Our data suggest that hypermutation of the inactive X chromosome is an early and frequent feature of tumorigenesis resulting from DNA replication stress in aberrantly proliferating cells.


Figures

None
Graphical abstract
Figure 1
Figure 1
Distribution of Somatic Mutations in Medulloblastoma Genomes of Female versus Male Samples (A) Intermutation distance plot of medulloblastoma MB56 (female). Mutations are ordered on the x axis from the first variant on the short arm of chromosome 1 to the last variant on the long arm of chromosome X. The distance between each somatic SNV and the SNV immediately upstream (the intermutation distance) is plotted on the y axis on a log scale. The chromosomes are separated by thin lines; chromosome X mutations are colored in gray. See also Figure S1. (B) Intermutation distance plot for medulloblastoma MB61 (male). (C) To present mutational load per chromosome corrected for the size of the respective chromosome, the mutation rate per megabase was plotted for female MB56. Coloring of bars represents the ratio of the six possible nucleotide changes (C > A, C > G, C > T, T > A, T > C, and T > G) for each chromosome. (D) Mutational load per chromosome for MB61.
Figure 2
Figure 2
The X Chromosome Accumulates Significantly More Mutations Than Autosomes in Cancer Genomes of Female Samples (A) X chromosome mutation ratio of 49 medulloblastoma genomes. The X chromosome mutation ratio (values on y axis) is calculated as mutation rate of X chromosome divided by the mean mutation rate of all autosomes. A ratio of ≥ 2 indicates X chromosome hypermutation. (B) Age at diagnosis of the 49 medulloblastoma patients. (C) XIST expression status of the 49 medulloblastoma genomes. (D–G) (D) Distribution of the X chromosome mutation ratio for males (raw values and corrected for single X copy number state) and females (with both X copies) in medulloblastoma, (E) in neuroblastoma, (F) in pilocytic astrocytoma, and (G) in B cell lymphoma (n = 29, without sample 4120193). p values from t test. See also Figure S2.
Figure 3
Figure 3
Fewer Mutations in Regions Escaping X Chromosome Inactivation (A) Genome-wide intermutation distance plot of lymphoma 4120193 (DLBCL subtype, female). (B) X chromosome-wide intermutation distance plot of somatic mutations along the X chromosome coordinates. Genes that escape X inactivation and are expressed in this sample as determined by RNA-seq data show fewer mutations (marked in gray). (C) X chromosome copy number plot of lymphoma 4120193; 81 Mbs of the Xq arm are present at three copies in the tumor. The asterisk in all three panels marks the same mutation (the first mutation after the centromere).
Figure 4
Figure 4
X Chromosome Hypermutation Is a Feature of Many Different Cancer Types Mutations per chromosome plot for exemplary genomes from female samples of (A) breast cancer, (B) retinoblastoma, (C) B cell lymphoma, (D) neuroblastoma, (E) glioblastoma, and (F) AML. See also Figure S3.
Figure 5
Figure 5
Characteristics of X Chromosome Hypermutation in Medulloblastoma (A and B) Mutational load per chromosome for female tetraploid medulloblastoma MB101 (A) for all somatic SNVs and (B) only for somatic SNVs with a clear ∼50% allele frequency, demonstrating X hypermutation to occur before tetraploidy. (C) Intermutation distance plot for genome-wide somatic indels of MB101. (D) X hypermutation is observed for indels (y axis) in those genomes that display X hypermutation based on SNVs (x axis). Values on axes calculated as mutation rate of X chromosome divided by the mean mutation rate of all autosomes. (E) Mutational load per chromosome for MB101 using all germline single nucleotide substitutions shows that the X chromosome has less germline substitutions than the autosomes. (F) Distribution of somatic SNVs per chromosome into different genomic regions. See also Figure S4.
Figure 6
Figure 6
Autosomal Regions as Highly Mutated as the X Chromosome Are Late Replicating (A) RepliSeq replication timing data (y axis) versus somatic mutations per 1 Mb window (x axis) of the merged mutation set of medulloblastoma genomes (n = 113) including only the autosomes. An autosomal region in this analysis is defined as hypermutated if ≥2-fold mutation rate compared to the mean mutation rate of the autosomes (here, >118 SNVs per 1 Mb). The RepliSeq data are a wavelet-smoothed, weighted average signal where high and low values indicate early and late replication during the S phase, respectively (y axis). (B) Replication timing correlation for B cell lymphoma (n = 29, without sample 4120193). Autosomal regions with >125 SNVs per 1 Mb are defined here as hypermutated. See also Figure S5 for alternative genomic window sizes of 100 Kb and 5 Mb.
Figure 7
Figure 7
Whole-Genome Sequencing of Nonmalignant Somatic Cells Reveals No X Chromosome Hypermutation Mutational load per chromosome plot for genomes from female samples of (A) HSPC clone B6 and (B) HSPC clone G2 of a healthy 73-year-old female, (C) HSPC clone of a 39-year-old healthy female, (D) MDS of Li-Fraumeni syndrome case LFS-MB1, and (E) medulloblastoma of Li-Fraumeni syndrome case LFS-MB1.
Figure S1
Figure S1
X Chromosome Hypermutation Cannot Be Explained by the Copy Number State of Chromosomes, Related to Figure 1 Genome-wide chromosomal copy number state of female diploid medulloblastoma MB56; based on whole-genome sequencing data. Lower panel: B-allele frequency.
Figure S2
Figure S2
Lack of X Chromosome Hypermutation in Cancer Genomes of Female Samples with X Chromosome Loss, Related to Figure 2 (A) Genome-wide chromosomal copy number state of tetraploid female medulloblastoma MB6; based on whole-genome sequencing data. (B) Mutations per megabase per chromosome for MB6. (C) XIST expression versus copy number state of the X chromosome in medulloblastoma.
Figure S3
Figure S3
Genomic Heatmap for Medulloblastoma Female Samples with X Chromosome Hypermutation, Related to Figure 4 Presented is the fraction of mutations at each of the 96 mutated trinucleotides as a heatmap for each chromosome (1-22, X), normalized according to the prevalence of each trinucleotide on the respective chromosome. Log-transformed values of these ratios were plotted in the heatmap, where red indicates a high mutations fraction, yellow low and white no mutations. The 5′ base to each mutated base is shown on the vertical axis and 3′ base on the horizontal axis. Somatic SNVs pooled from 25 medulloblastoma females.
Figure S4
Figure S4
Mutations on the Hypermutated X Chromosome Do Not Show a Unique Mutation Spectrum or Distribution Pattern, Related to Figure 5 (A) Principal component analysis (PCA) comparing the mutation spectrum of the combined autosomes and the hypermutated X of individual samples (n = 34) of four different tumor types. The first three principal components (PC1, PC2, and PC3) separate the different tumor types, but not the autosomes from the hypermutated X chromosomes. (B) The distribution of somatic mutations per 1 Mb window along the X chromosome in B cell lymphoma for a set of females (red) and males (blue). (C) The distribution of somatic mutations per 1 Mb window shows a higher correlation between males and females of the same tumor type as compared to females with X hypermutation of different tumor types.
Figure S5
Figure S5
Autosomal Regions as Highly Mutated as the X Chromosome Are Late Replicating, Related to Figure 6 Replication timing correlation for medulloblastoma (n = 113) for (A) 5 Mb and (C) 100 Kb window size, and for B cell lymphoma (n = 29) for (B) 5 Mb and (D) 100 Kb window size.

References

    1. Barakat T.S., Gribnau J. X chromosome inactivation in the cycle of life. Development. 2012;139:2085–2089. - PubMed
    1. Bass A.J., Lawrence M.S., Brace L.E., Ramos A.H., Drier Y., Cibulskis K., Sougnez C., Voet D., Saksena G., Sivachenko A. Genomic sequencing of colorectal adenocarcinomas identifies a recurrent VTI1A-TCF7L2 fusion. Nat. Genet. 2011;43:964–968. - PMC - PubMed
    1. Bester A.C., Roniger M., Oren Y.S., Im M.M., Sarni D., Chaoat M., Bensimon A., Zamir G., Shewach D.S., Kerem B. Nucleotide deficiency promotes genomic instability in early stages of cancer development. Cell. 2011;145:435–446. - PMC - PubMed
    1. Brown C.J., Hendrich B.D., Rupert J.L., Lafrenière R.G., Xing Y., Lawrence J., Willard H.F. The human XIST gene: analysis of a 17 kb inactive X-specific RNA that contains conserved repeats and is highly localized within the nucleus. Cell. 1992;71:527–542. - PubMed
    1. Burrell R.A., McClelland S.E., Endesfelder D., Groth P., Weller M.-C., Shaikh N., Domingo E., Kanu N., Dewhurst S.M., Gronroos E. Replication stress links structural and numerical cancer chromosomal instability. Nature. 2013;494:492–496. - PMC - PubMed

Supplemental References

    1. Adey A., Shendure J. Ultra-low-input, tagmentation-based whole-genome bisulfite sequencing. Genome Res. 2012;22:1139–1143. - PMC - PubMed
    1. Hansen R.S., Thomas S., Sandstrom R., Canfield T.K., Thurman R.E., Weaver M., Dorschner M.O., Gartler S.M., Stamatoyannopoulos J.A. Sequencing newly replicated DNA reveals widespread plasticity in human replication timing. Proc. Natl. Acad. Sci. USA. 2010;107:139–144. - PMC - PubMed
    1. Li H., Handsaker B., Wysoker A., Fennell T., Ruan J., Homer N., Marth G., Abecasis G., Durbin R., 1000 Genome Project Data Processing Subgroup The Sequence Alignment/Map format and SAMtools. Bioinformatics. 2009;25:2078–2079. - PMC - PubMed
    1. Quinlan A.R., Hall I.M. BEDTools: a flexible suite of utilities for comparing genomic features. Bioinformatics. 2010;26:841–842. - PMC - PubMed
    1. Wang Q., Gu L., Adey A., Radlwimmer B., Wang W., Hovestadt V., Bähr M., Wolf S., Shendure J., Eils R. Tagmentation-based whole-genome bisulfite sequencing. Nat. Protoc. 2013;8:2022–2032. - PubMed

Publication types