. 2013 Nov 5;18(5):726-39.
doi: 10.1016/j.cmet.2013.09.013. Epub 2013 Oct 17.

mTOR complex 2 controls glycolytic metabolism in glioblastoma through FoxO acetylation and upregulation of c-Myc

Affiliations

mTOR complex 2 controls glycolytic metabolism in glioblastoma through FoxO acetylation and upregulation of c-Myc

Kenta Masui et al. Cell Metab. .

Abstract

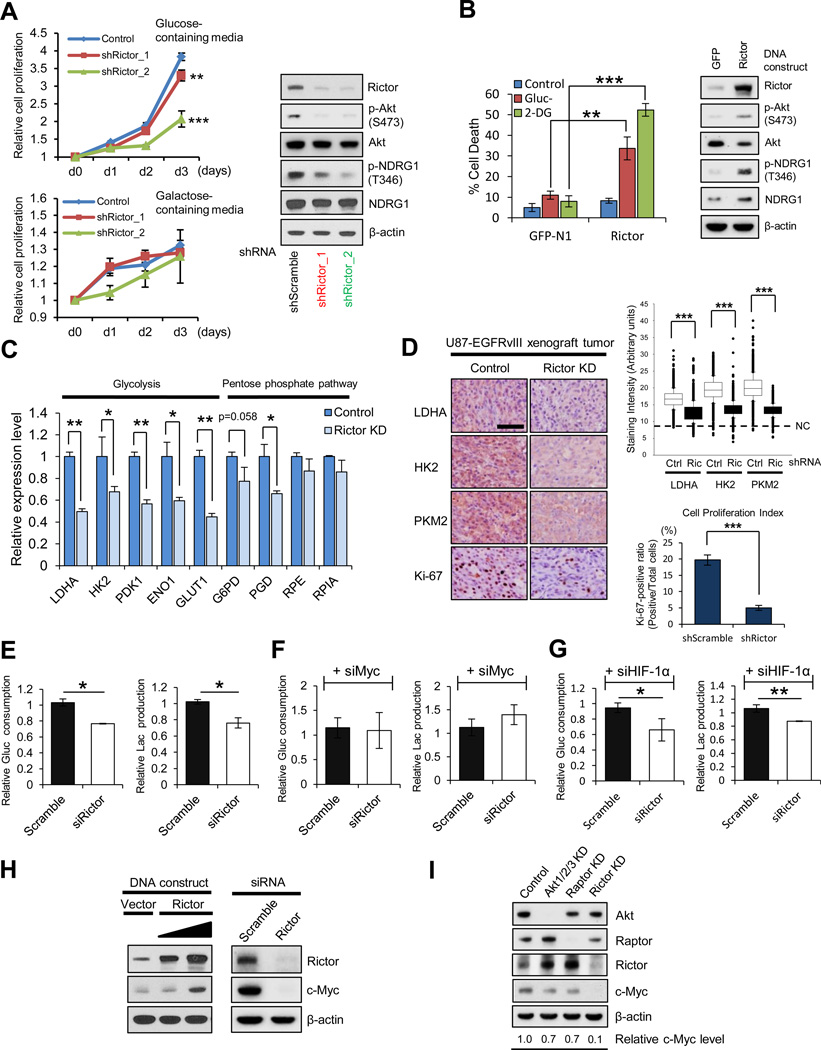
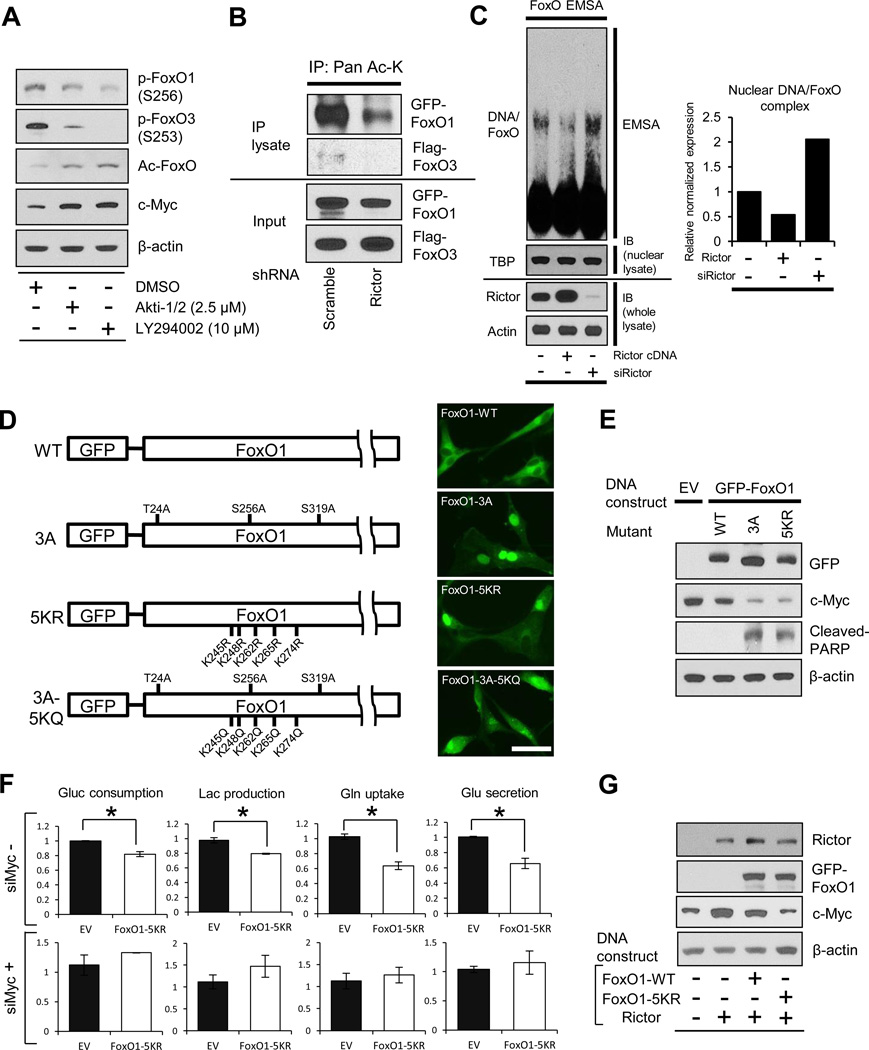
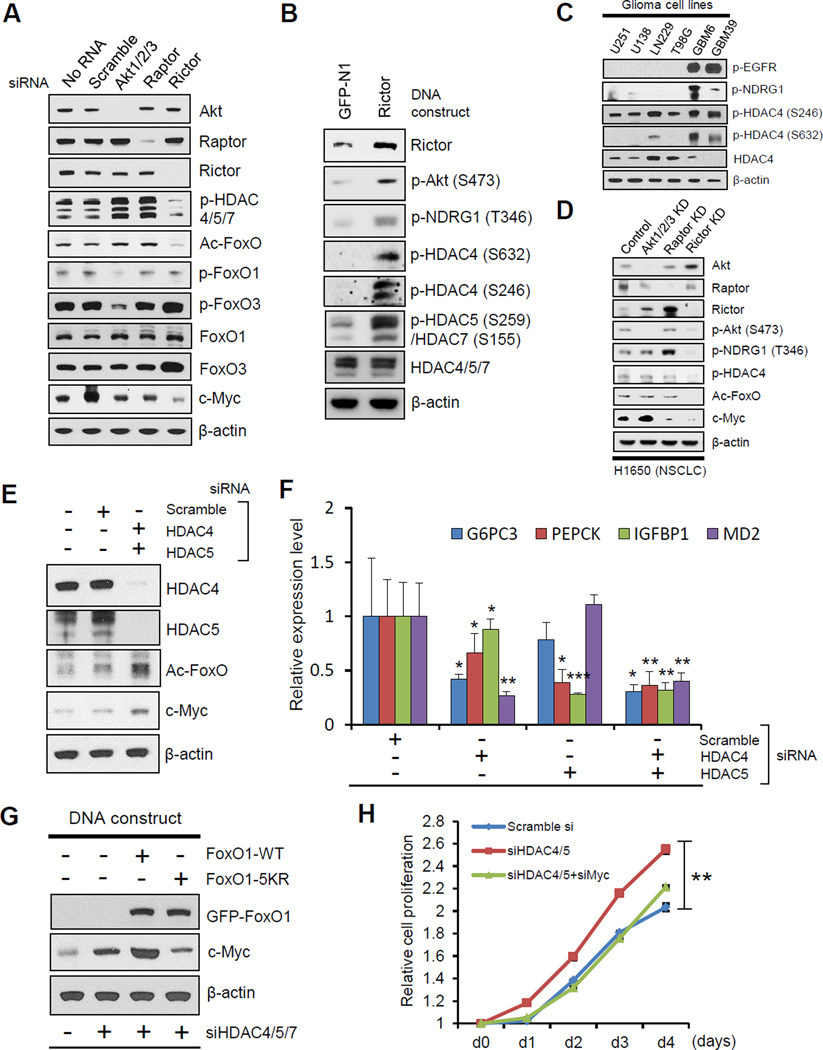
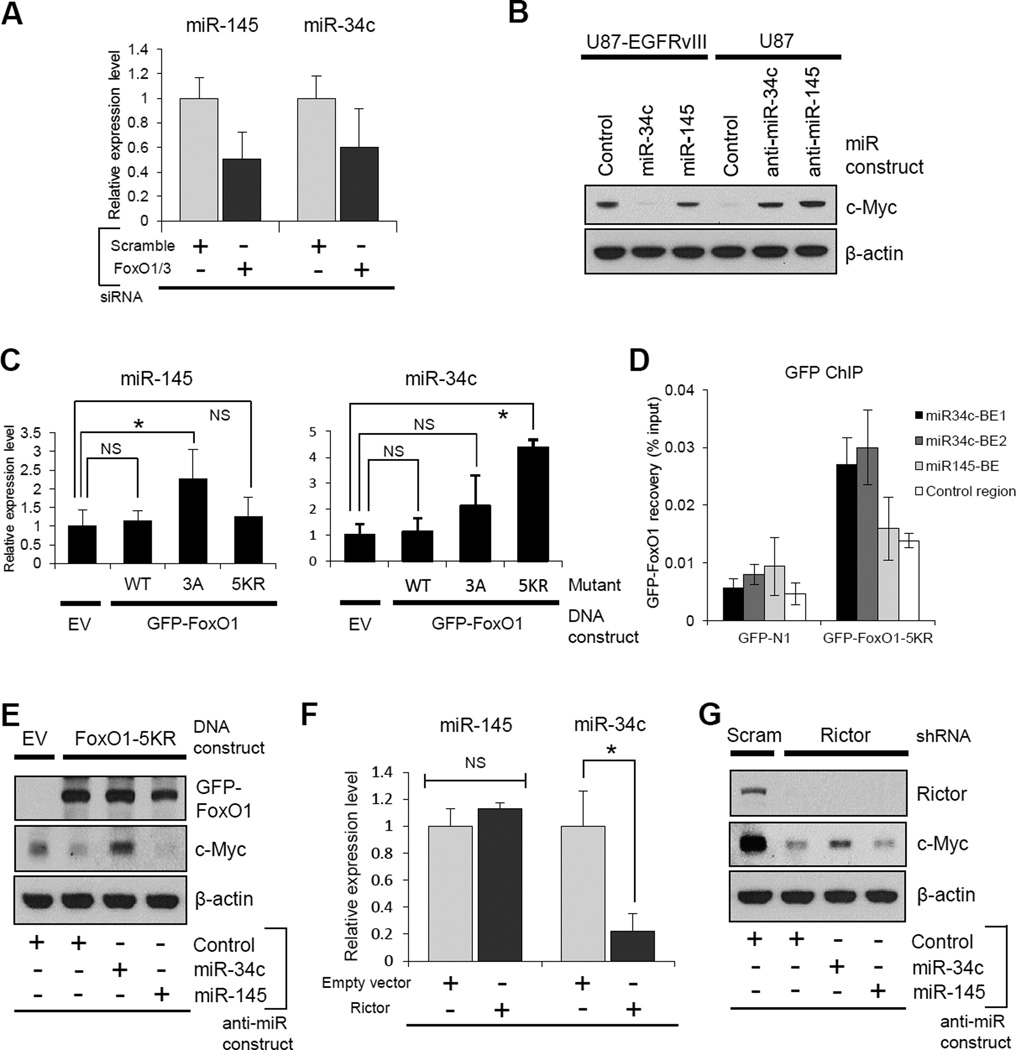
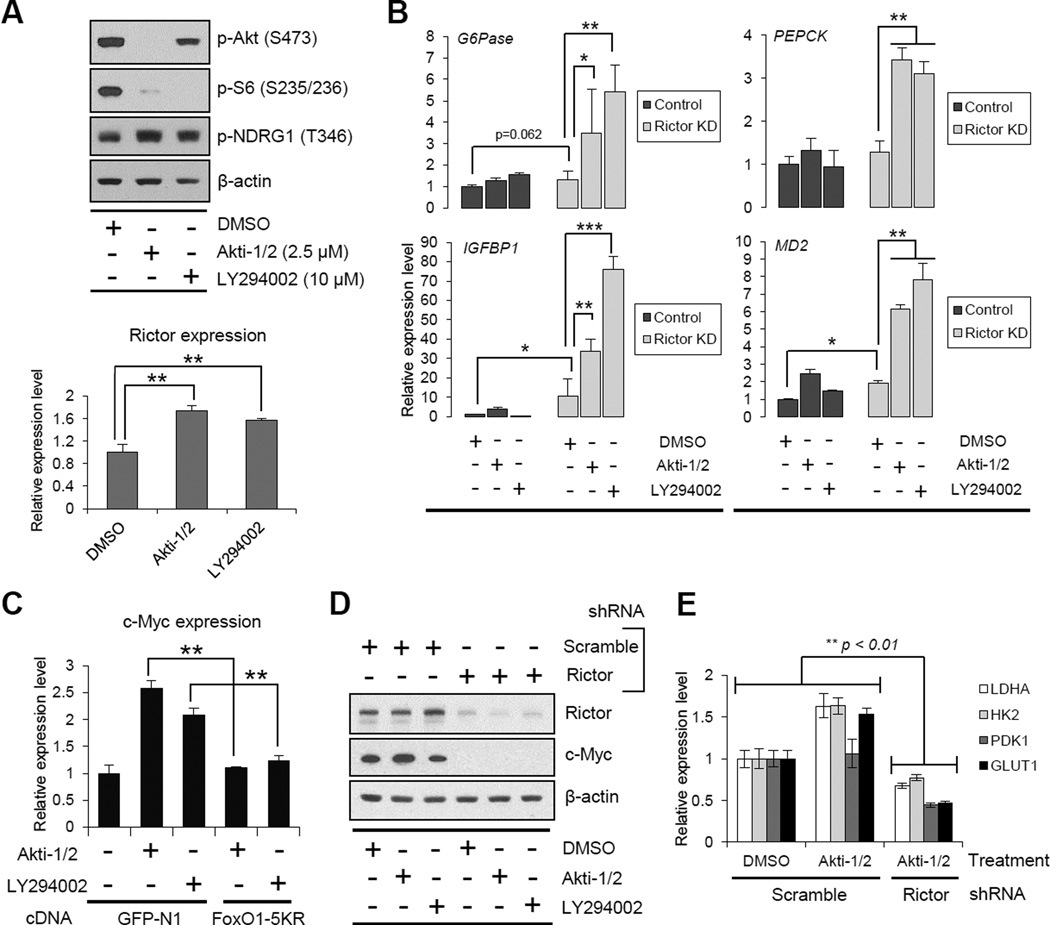
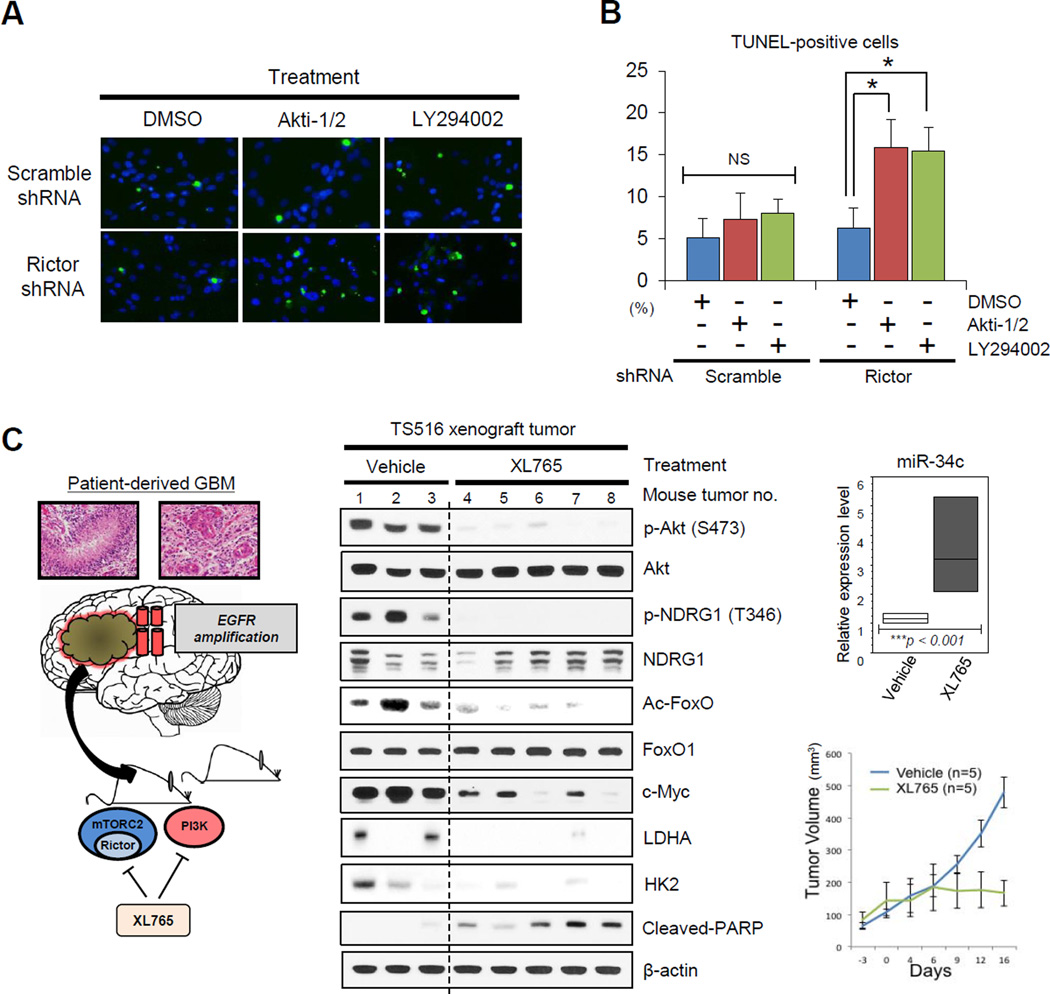
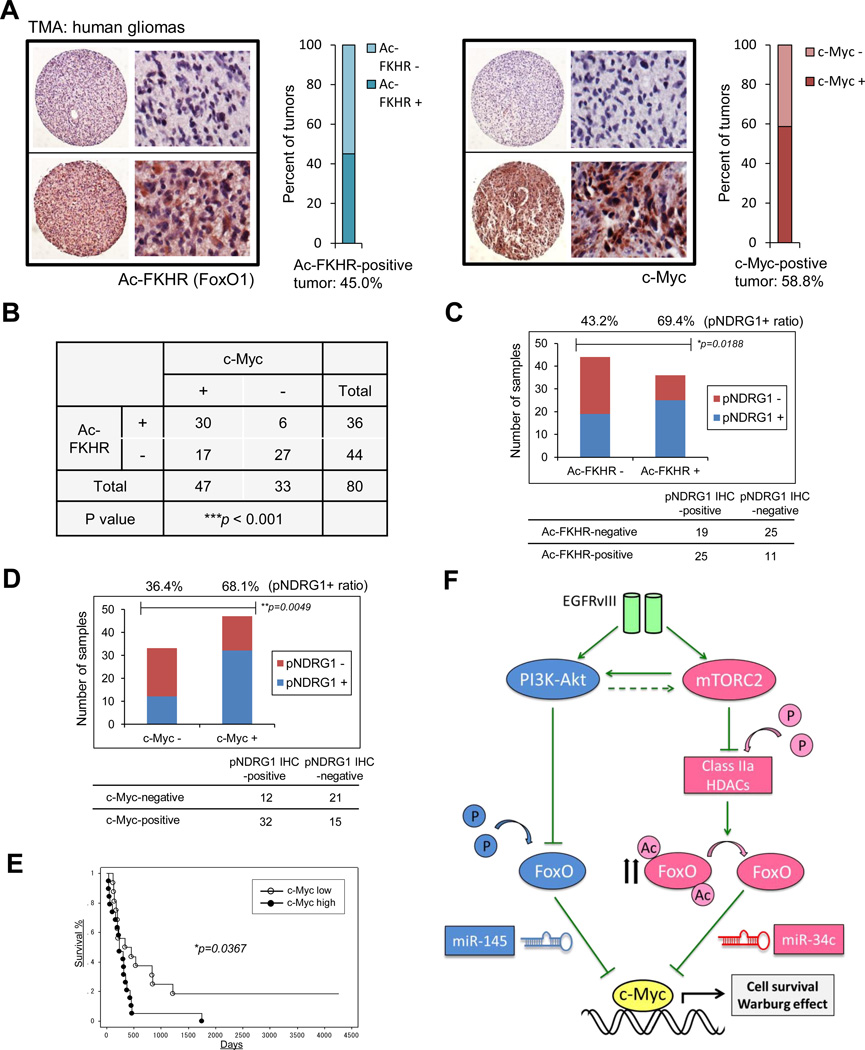
Aerobic glycolysis (the Warburg effect) is a core hallmark of cancer, but the molecular mechanisms underlying it remain unclear. Here, we identify an unexpected central role for mTORC2 in cancer metabolic reprogramming where it controls glycolytic metabolism by ultimately regulating the cellular level of c-Myc. We show that mTORC2 promotes inactivating phosphorylation of class IIa histone deacetylases, which leads to the acetylation of FoxO1 and FoxO3, and this in turn releases c-Myc from a suppressive miR-34c-dependent network. These central features of activated mTORC2 signaling, acetylated FoxO, and c-Myc levels are highly intercorrelated in clinical samples and with shorter survival of GBM patients. These results identify a specific, Akt-independent role for mTORC2 in regulating glycolytic metabolism in cancer.


Conflict of interest statement

All authors report no conflict of interest.

Figures

Figure 1
Figure 1. mTORC2 Is Required for GBM Growth in Glucose through c-Myc
(A) Growth curves of scramble or Rictor knockdown (KD) U87-EGFRvIII cells, cultured in media containing glucose or galactose. Error bars, ± SD. Immunoblot showing the verification of Rictor KD in U87-EGFRvIII cells. (B) Cell deaths of GFP or Rictor overexpressing U87 cells after 48 h treatment with glucose deprivation (Gluc-) or the glycolytic inhibitor, 2-Deoxy-D-glucose (2-DG, 10 mM). Immunoblot showing the verification of Rictor overexpression in U87 cells. (C) mRNA levels of glycolysis and pentose phosphate pathway (PPP) enzymes in control or Rictor KD U87-EGFRvIII cells. (D) Cell-based immunohistochemical analysis for glycolytic enzymes and a proliferative marker Ki-67 in U87-EGFRvIII xenograft tumors with scramble or Rictor shRNA (n = 3). Scale bar, 50 µm. NC denotes the averaged staining intensity obtained by negative control of each sample. (E-G) Relative glucose consumption and lactate production in control versus Rictor KD U87-EGFRvIII cells (E), combined with c-Myc KD (F) or HIF-1α KD (G). (H) Biochemical analysis of c-Myc expression for Rictor overexpression in U87 cells and Rictor KD in U87-EGFRvIII cells. (I) Immunoblot analysis of c-Myc in U87-EGFRvIII cells with indicated siRNAs regarding Akt, mTORC1 (Raptor) and mTORC2 (Rictor). All error bars except growth curves (A), SEM. See also Figure S1.
Figure 2
Figure 2. mTORC2 Regulates c-Myc and Glycolysis through FoxO Acetylation
(A) Phosphorylated FoxO, acetylated FoxO and c-Myc protein levels in U87-EGFRvIII treated with Akt inhibitor (Akti-1/2) or Pan-PI3K inhibitor (LY294002) for 24h. (B) IP analysis of the association of acetyl-lysine (Ac-K) with FoxO plasmids in U87-EGFRvIII cells which were co-transfected with GFP-FoxO1 and Flag-FoxO3, and depleted with or without Rictor. (C) EMSA assay with the use of nuclear extracts from U87 with Rictor overexpression or Rictor KD, showing the DNA/FoxO-protein EMSA complex. Immunoblots for TATA-binding protein (TBP) were used to normalize protein loading for nuclear extracts. Quantitative bar graph demonstrated relative DNA/FoxO complex levels in each group. (D) Schematic illustration of GFP-FoxO1 mutants: 3A, Akt-mediated phosphorylation-resistant; 5KR, acetylation-resistant; 5KQ, constitutively-acetylated form. Immunofluorescent images representing U87-EGFRvIII cells expressing GFP-FoxO1 and mutants. Scale bar, 20 µm. (E) Immunoblot analysis on the effects of wild type, 3A-, or 5KR-FoxO1 on c-Myc and cleaved PARP. (F) Relative glucose consumption, lactate production, glutamine uptake and glutamate secretion in empty vector or FoxO1-5KR mutant overexpressing U87-EGFRvIII cells with or without depletion of c-Myc. (G) Immunoblot assessment of c-Myc in U87 cells co-transfected with Rictor-expressing vector and wild type/mutant FoxO-expressing vector. Error bars, SEM. See also Figure S2.
Figure 3
Figure 3. mTORC2 Controls FoxO Acetylation through Class IIa HDACs, Independent of Akt
(A) Immunoblot analysis of c-Myc, phosphorylated HDAC, and several forms of FoxO in U87-EGFRvIII cells with indicated siRNAs regarding Akt and mTOR complex. (B) Immunoblot showing change in phosphorylated class IIa HDACs from U87 cells overexpressing GFP or Rictor DNA plasmids. (C) Immunoblot analysis for the status of p-EGFR, p-NDRG1 and class IIa HDACs in several glioma cell lines. (D) Immunoblot analysis of phosphorylated HDAC, acetylated FoxO and c-Myc in EGFR-mutated, non-small cell lung cancer (NSCLC) cells (H1650) with indicated KD regarding Akt and mTOR complex. (E) Immunoblot showing change of acetylated FoxO and c-Myc in U87 cells with indicated siRNAs against class IIa HDACs. (F) qRT-PCR from U87 cells of FoxO target genes following siRNA-mediated depletion of HDAC4/5. (G) Immunoblot showing c-Myc amount from U87 cells bearing siRNAs against class IIa HDACs, combined with overexpression of FoxO DNA plasmids. (H) Cell proliferation assay of scramble or class IIa HDAC KD U87 cells, combined with or without c-Myc depletion. p < 0.01 for comparison between siHDAC cells and scramble siRNA cells, or siHDAC/siMyc cells. Error bars, ± SD. All error bars except growth curves (H), SEM. See also Figure S3.
Figure 4
Figure 4. Acetylated FoxO Regulates c-Myc through miR-34c
(A) Relative expression of miR-145 and miR-34c in scramble versus FoxO KD U87 cells. (B) Myc protein levels in U87-EGFRvIII cells with miRNA mimics, and U87 with miRNA inhibitors. (C) Relative expression changes of miR-145 and miR-34c in U87-EGFRvIII cells transfected with indicated FoxO plasmids. (D) ChIP analysis on U87-EGFRvIII cells transfected with control vector or GFP-FoxO1-5KR, and assessed for GFP-FoxO1 recovery on binding elements (BEs) in miR-34c promoter (Kress et al., 2011) and miR-145 promoter (Gan et al., 2010) regions. (E) 5KR-FoxO1-mediated down-regulation of c-Myc was reverted by the inhibition of miR-34c, but not miR-145 in U87-EGFRvIII cells. (F) mRNA changes of miR-145 and miR-34c in U87 cells transfected with empty vector or Rictor-expressing vector. (G) Immunoblot assessment of c-Myc change in U87-EGFRvIII cells co-transfected with shRictor and miRNA inhibitors. Error bars, SEM.
Figure 5
Figure 5. Resistance to PI3K and Akt Inhibitors Is Mediated by mTORC2-dependent Acetylation of FoxO and Consequent Maintenance of c-Myc
(A) mTORC2 activation under Akt/PI3K inhibition in U87-EGFRvIII cells shown by Western blotting for p-NDRG1 protein and qRT-PCR for Rictor mRNA. (B) qRT-PCR analysis for FoxO target genes in U87-EGFRvIII cells treated by PI3K/Akt inhibitors for 24 h, combined with or without Rictor KD. Targeting both PI3K/Akt and mTORC2 dramatically restores FoxO activity. (C) qRT-PCR from U87-EGFRvIII cells of c-Myc gene following treatment with PI3K/Akt inhibitor, transfected with or without FoxO1-5KR. (D) Immunoblot assessment of c-Myc in U87-EGFRvIII cells treated by PI3K/Akt inhibitors, combined with or without Rictor KD. (E) mRNA levels of Myc-related metabolic enzymes in U87-EGFRvIII cells treated by PI3K/Akt inhibitors, combined with or without Rictor KD. Error bars, SEM. See also Figure S4.
Figure 6
Figure 6. Combined Inhibition of PI3K/Akt and mTORC2 Suppresses Acetylated FoxO-Myc Signaling and Promotes Tumor Cell Death
(A) TUNEL staining in U87-EGFRvIII cells treated by PI3K/Akt inhibitors for 24 h, combined with or without Rictor KD. Green, TUNEL staining; blue, DAPI staining. (B) Quantified TUNEL-positive U87-EGFRvIII cells treated by PI3K/Akt inhibitors, combined with or without Rictor KD in the bar graph. (C) An EGFR-amplified patient-derived TS516 GBM tumor sphere was implanted into immunodeficient mice which were subsequently treated with the dual PI3K/mTOR inhibitor XL765. Representative immunoblots displaying the status of FoxO acetylation, c-Myc and glycolytic enzyme expression, and apoptotic tumor cell death (cleaved PARP). Relative expression of miR-34c is shown in the box graph. Tumor volumes were measured by using length and width for vehicle-treated (n = 5) and XL765-treated (n = 5) groups. Error bars, SEM.
Figure 7
Figure 7. mTORC2 Signaling, Acetylated FoxO and c-Myc Expression Are Highly Inter-correlated in Biopsy Samples, and Associated with Poor Prognosis in GBM Patients
(A) Ac-FoxO and c-Myc immunostaining of GBM tissue microarray (TMA) comprising 80 GBM samples and 26 normal brain tissue. View of the TMA slide and an example of a negative and a positive core at high magnification to show cytoplasmic staining of Ac-FoxO and cytoplasmic/nuclear staining of c-Myc. Ac-FoxO and c-Myc are both individually up-regulated in 45.0% and 58.8 % of tumors, respectively. (B) Immunohistochemical analysis of TMAs based on correlation of Ac-FoxO with c-Myc. (C) Bar graph showing differential association of Ac-FoxO-positve or -negative tumors with p-NDRG1 IHC positivity based on TMA. (D) Differential association of c-Myc +/− tumors with p-NDRG1 immunopositivity based on TMA. P-value was determined by χ2 for independence test (B-D). (E) Kaplan-Meier survival analysis for overall survival of 36 primary and secondary GBM samples classified by c-Myc expression. Log-rank (Mantel-Cox) test was used to determine p values for Kaplan-Meier survival curve analyses. (F) mTORC2 inhibits FoxO activity via acetylation which could bypass PI3K/Akt inhibition, leading to the up-regulation of c-Myc, a key downstream effector of cell proliferation and tumor metabolism in GBM. See also Figure S5.

Comment in

References

    1. Albihn A, Johnsen JI, Henriksson MA. MYC in oncogenesis and as a target for cancer therapies. Adv Cancer Res. 2010;107:163–224. - PubMed
    1. Babic I, Anderson ES, Tanaka K, Guo D, Masui K, Li B, Zhu S, Gu Y, Villa GR, Akhavan D, et al. EGFR Mutation-Induced Alternative Splicing of Max Contributes to Growth of Glycolytic Tumors in Brain Cancer, Cell Metabolism. Cell Metab. 2013;17:1000–1008. - PMC - PubMed
    1. Bensaad K, Tsuruta A, Selak MA, Vidal MN, Nakano K, Bartrons R, Gottlieb E, Vousden KH. TIGAR, a p53-inducible regulator of glycolysis and apoptosis. Cell. 2006;126:107–120. 2006. - PubMed
    1. Biggs WH, 3rd, Meisenhelder J, Hunter T, Cavenee WK, Arden KC. Protein kinase B/Akt-mediated phosphorylation promotes nuclear exclusion of the winged helix transcription factor FKHR1. Proc. Natl. Acad. Sci. U S A. 1999;96:7421–7426. - PMC - PubMed
    1. Bouchard C, Marquardt J, Brás A, Medema RH, Eilers M. Myc-induced proliferation and transformation require Akt-mediated phosphorylation of FoxO proteins. EMBO J. 2004;23:2830–2840. - PMC - PubMed

Publication types

MeSH terms