

Thrombospondin 1 mediates high-fat diet-induced muscle fibrosis and insulin resistance in male mice
- PMID: 24140711
- PMCID: PMC3836064
- DOI: 10.1210/en.2013-1587
Thrombospondin 1 mediates high-fat diet-induced muscle fibrosis and insulin resistance in male mice
Abstract
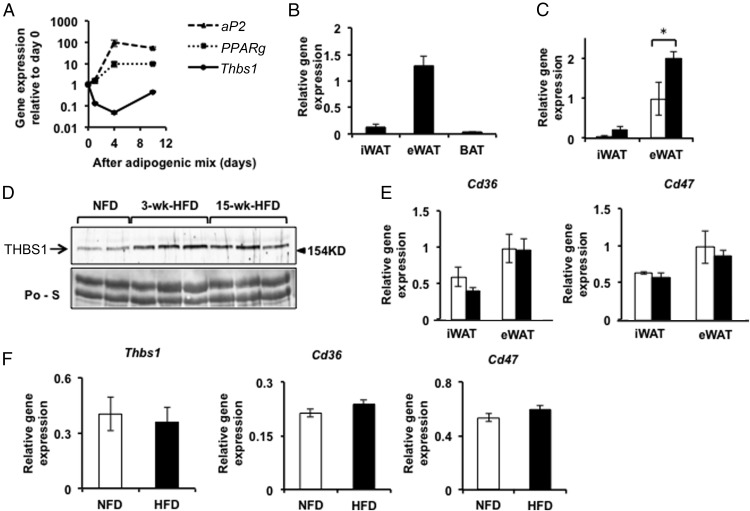
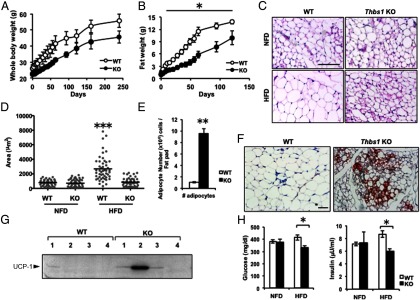
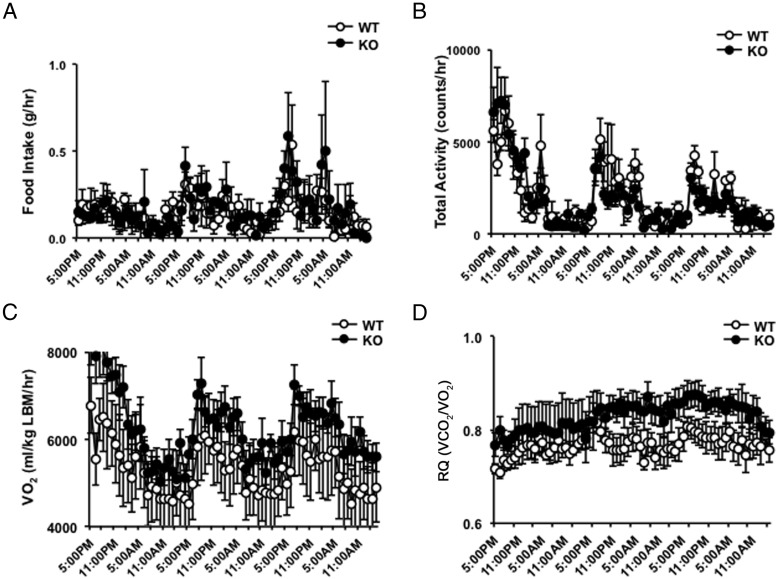
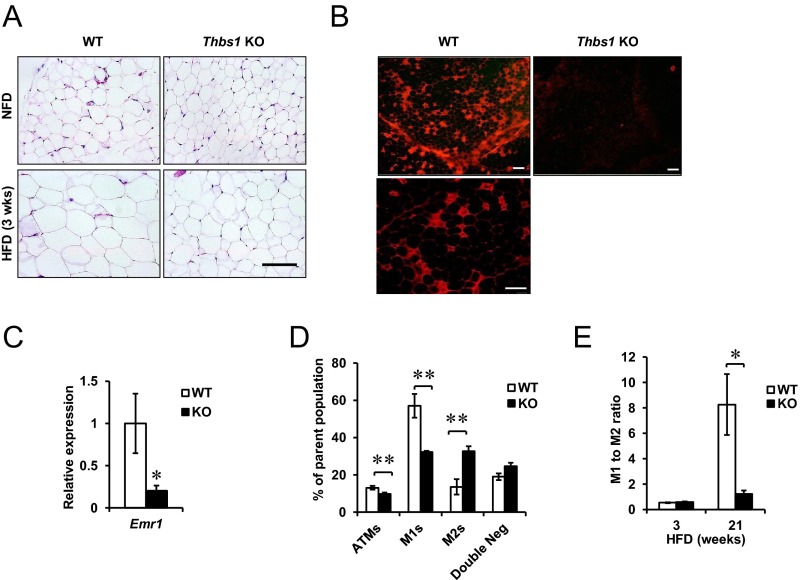
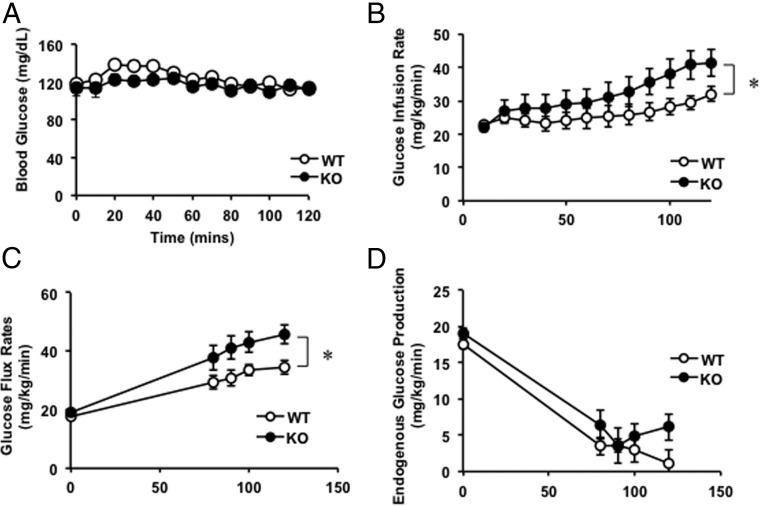
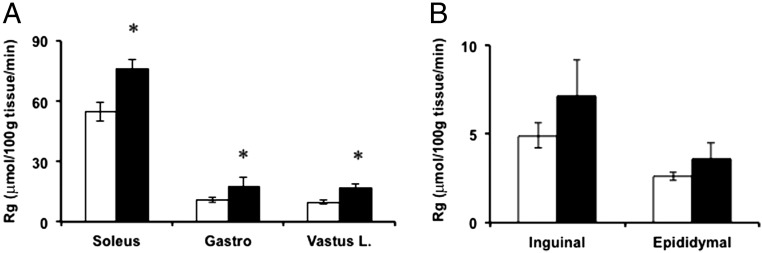
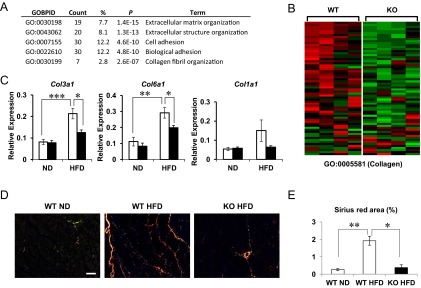
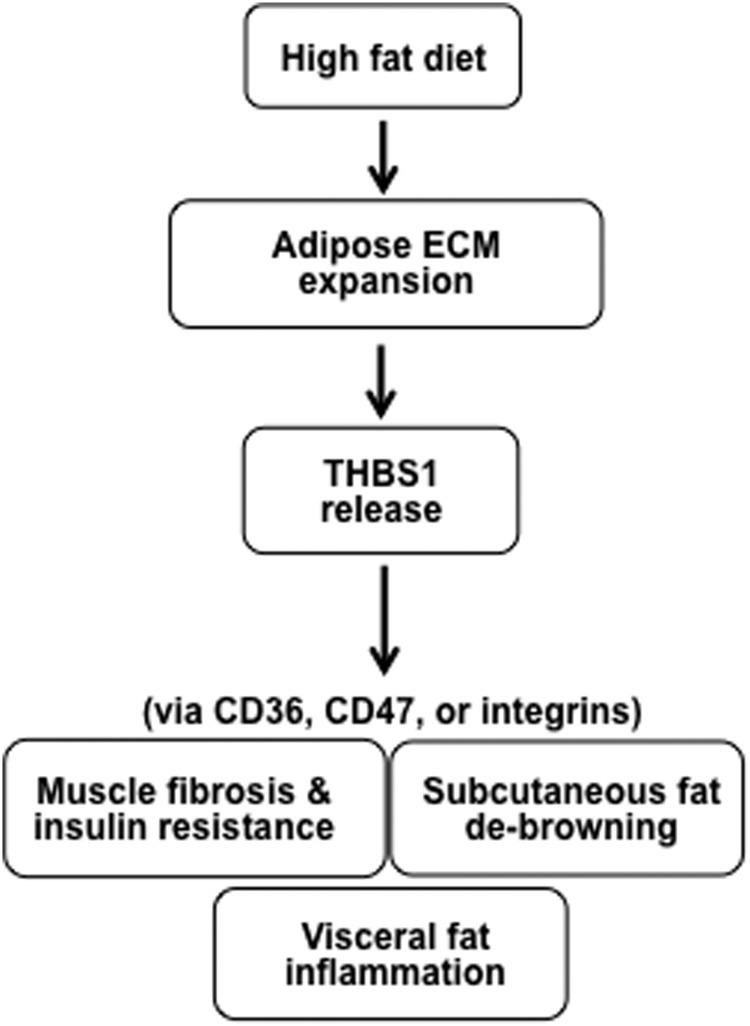
Thrombospondin 1 (THBS1 or TSP-1) is a circulating glycoprotein highly expressed in hypertrophic visceral adipose tissues of humans and mice. High-fat diet (HFD) feeding induces the robust increase of circulating THBS1 in the early stages of HFD challenge. The loss of Thbs1 protects male mice from diet-induced weight gain and adipocyte hypertrophy. Hyperinsulinemic euglycemic clamp study has demonstrated that Thbs1-null mice are protected from HFD-induced insulin resistance. Tissue-specific glucose uptake study has revealed that the insulin-sensitive phenotype of Thbs1-null mice is mostly mediated by skeletal muscles. Further assessments of the muscle phenotype using RNA sequencing, quantitative PCR, and histological studies have demonstrated that Thbs1-null skeletal muscles are protected from the HFD-dependent induction of Col3a1 and Col6a1, coupled with a new collagen deposition. At the same time, the Thbs1-null mice display a better circadian rhythm and higher amplitude of energy expenditure with a browning phenotype in sc adipose tissues. These results suggest that THBS1, which circulates in response to a HFD, may induce insulin resistance and fibrotic tissue damage in skeletal muscles as well as the de-browning of sc adipose tissues in the early stages of a HFD challenge. Our study may shed new light on the pathogenic role played by a circulating extracellular matrix protein in the cross talk between adipose tissues and skeletal muscles during obesity progression.
Figures
Similar articles
-
Disruption of hypoxia-inducible factor 1 in adipocytes improves insulin sensitivity and decreases adiposity in high-fat diet-fed mice.Diabetes. 2011 Oct;60(10):2484-95. doi: 10.2337/db11-0174. Epub 2011 Aug 26. Diabetes. 2011. PMID: 21873554 Free PMC article.
-
Thrombospondin-1 regulates adiposity and metabolic dysfunction in diet-induced obesity enhancing adipose inflammation and stimulating adipocyte proliferation.Am J Physiol Endocrinol Metab. 2013 Aug 1;305(3):E439-50. doi: 10.1152/ajpendo.00006.2013. Epub 2013 Jun 11. Am J Physiol Endocrinol Metab. 2013. PMID: 23757408 Free PMC article.
-
Inflammation is necessary for long-term but not short-term high-fat diet-induced insulin resistance.Diabetes. 2011 Oct;60(10):2474-83. doi: 10.2337/db11-0194. Epub 2011 Sep 12. Diabetes. 2011. PMID: 21911747 Free PMC article.
-
Osteopontin is required for the early onset of high fat diet-induced insulin resistance in mice.PLoS One. 2010 Nov 12;5(11):e13959. doi: 10.1371/journal.pone.0013959. PLoS One. 2010. PMID: 21103061 Free PMC article.
-
Why do humans need thrombospondin-1?J Cell Commun Signal. 2023 Sep;17(3):485-493. doi: 10.1007/s12079-023-00722-5. Epub 2023 Jan 23. J Cell Commun Signal. 2023. PMID: 36689135 Free PMC article. Review.
Cited by
-
CD47 deficiency protects mice from diet-induced obesity and improves whole body glucose tolerance and insulin sensitivity.Sci Rep. 2015 Mar 9;5:8846. doi: 10.1038/srep08846. Sci Rep. 2015. PMID: 25747123 Free PMC article.
-
Beta-adrenergic agonist induces unique transcriptomic signature in inguinal white adipose tissue.Physiol Rep. 2023 Mar;11(6):e15646. doi: 10.14814/phy2.15646. Physiol Rep. 2023. PMID: 36967237 Free PMC article.
-
Thrombospondin 1 as a novel biological marker of obesity and metabolic syndrome.Metabolism. 2015 Nov;64(11):1490-9. doi: 10.1016/j.metabol.2015.07.016. Epub 2015 Jul 26. Metabolism. 2015. PMID: 26298466 Free PMC article.
-
Identifying pathological myopia associated genes with GenePlexus in protein-protein interaction network.Front Genet. 2025 Mar 5;16:1533567. doi: 10.3389/fgene.2025.1533567. eCollection 2025. Front Genet. 2025. PMID: 40110040 Free PMC article.
-
Thrombospondin-1 in maladaptive aging responses: a concept whose time has come.Am J Physiol Cell Physiol. 2020 Jul 1;319(1):C45-C63. doi: 10.1152/ajpcell.00089.2020. Epub 2020 May 6. Am J Physiol Cell Physiol. 2020. PMID: 32374675 Free PMC article. Review.
References
-
- Chun TH, Hotary KB, Sabeh F, Saltiel AR, Allen ED, Weiss SJ. A pericellular collagenase directs the 3-dimensional development of white adipose tissue. Cell. 2006;125:577–591 - PubMed
Publication types
MeSH terms
Substances
Grants and funding
- DK095137/DK/NIDDK NIH HHS/United States
- DK089503/DK/NIDDK NIH HHS/United States
- P30 DK092926/DK/NIDDK NIH HHS/United States
- K01 DK084079/DK/NIDDK NIH HHS/United States
- R01 DK095137/DK/NIDDK NIH HHS/United States
- P30 DK089503/DK/NIDDK NIH HHS/United States
- HL106332/HL/NHLBI NIH HHS/United States
- P60 DK020572/DK/NIDDK NIH HHS/United States
- DK084079/DK/NIDDK NIH HHS/United States
- P30 DK020572/DK/NIDDK NIH HHS/United States
- T32GM007315/GM/NIGMS NIH HHS/United States
- DK020572/DK/NIDDK NIH HHS/United States
- R01 DK090262/DK/NIDDK NIH HHS/United States
- DK059637/DK/NIDDK NIH HHS/United States
- R21 HL106332/HL/NHLBI NIH HHS/United States
- DK090262/DK/NIDDK NIH HHS/United States
- U24 DK059637/DK/NIDDK NIH HHS/United States
- T32 GM007315/GM/NIGMS NIH HHS/United States
LinkOut - more resources
Full Text Sources
Other Literature Sources
Medical
Molecular Biology Databases
Miscellaneous
