. 2013 Nov 12;128(20):2211-23.
doi: 10.1161/CIRCULATIONAHA.113.004698. Epub 2013 Oct 18.

Age-associated defects in EphA2 signaling impair the migration of human cardiac progenitor cells

Affiliations

Age-associated defects in EphA2 signaling impair the migration of human cardiac progenitor cells

Polina Goichberg et al. Circulation. .

Erratum in

  • Correction.
    [No authors listed] [No authors listed] Circulation. 2015 Jul 28;132(4):e30. doi: 10.1161/CIR.0000000000000187. Circulation. 2015. PMID: 26216092 No abstract available.
  • Correction.
    [No authors listed] [No authors listed] Circulation. 2015 Dec 1;132(22):e361. doi: 10.1161/CIR.0000000000000339. Circulation. 2015. PMID: 26621664 No abstract available.

Retraction in

Expression of concern in

  • Expression of Concern.
    [No authors listed] [No authors listed] Circ Res. 2019 Jan 18;124(2):e4-e5. doi: 10.1161/RES.0000000000000241. Circ Res. 2019. PMID: 30582460 No abstract available.
  • Expression of Concern.
    [No authors listed] [No authors listed] Circulation. 2019 Jan 15;139(3):e5-e6. doi: 10.1161/CIR.0000000000000639. Circulation. 2019. PMID: 30615475 No abstract available.

Abstract

Background: Aging negatively impacts on the function of resident human cardiac progenitor cells (hCPCs). Effective regeneration of the injured heart requires mobilization of hCPCs to the sites of damage. In the young heart, signaling by the guidance receptor EphA2 in response to the ephrin A1 ligand promotes hCPC motility and improves cardiac recovery after infarction.

Methods and results: We report that old hCPCs are characterized by cell-autonomous inhibition of their migratory ability ex vivo and impaired translocation in vivo in the damaged heart. EphA2 expression was not decreased in old hCPCs; however, the elevated level of reactive oxygen species in aged cells induced post-translational modifications of the EphA2 protein. EphA2 oxidation interfered with ephrin A1-stimulated receptor auto-phosphorylation, activation of Src family kinases, and caveolin-1-mediated internalization of the receptor. Cellular aging altered the EphA2 endocytic route, affecting the maturation of EphA2-containing endosomes and causing premature signal termination. Overexpression of functionally intact EphA2 in old hCPCs corrected the defects in endocytosis and downstream signaling, enhancing cell motility. Based on the ability of phenotypically young hCPCs to respond efficiently to ephrin A1, we developed a novel methodology for the prospective isolation of live hCPCs with preserved migratory capacity and growth reserve.

Conclusions: Our data demonstrate that the ephrin A1/EphA2 pathway may serve as a target to facilitate trafficking of hCPCs in the senescent myocardium. Importantly, EphA2 receptor function can be implemented for the selection of hCPCs with high therapeutic potential, a clinically relevant strategy that does not require genetic manipulation of stem cells.

Keywords: aging; cell movement; receptor, EphA2; stem cells.


Conflict of interest statement

Conflict of Interest Disclosures: None.

Figures

Figure 1
Figure 1
Old hCPCs display cell-autonomous defects in migratory response. AC, Primary cultures of actively growing hCPCs (young) were subjected to serial passages (replicative senescence: old), or to doxorubicin exposure (stress-induced senescence: old). Young and old hCPCs express c-kit (green). Nuclei are stained with DAPI (blue). Phalloidin, grey. Localization of Ki-67 (A: red) decreases, and p16INK4a (B: red), and DDR foci (C: γH2A.X, green; 53BP1, red) increase in old hCPCs. Rectangles define areas illustrated at higher magnification in the insets (C). Data are mean ± SD (n=3–5). Only hCPCs with 2 or more γH2A.X foci were included in the quantitative analysis. Replicative senescence: *P=0.009, P=0.04, §P=0.02; Stress-induced senescence: *P<0.0001, P=0.04, §P=0.03. D, Transwell migration of young and old hCPCs after ephrin A1 stimulation, or in the presence of HGF. This assay shows a decreased migration of old hCPCs. Data are mean ± SD (n=8–12). *P=0.038 vs. control; P<0.0001 vs. control; **P<0.0001 vs. ephrin A1 only; #P<0.0001 vs. young. E, Young and old hCPCs exposed to a polarized source of HGF. EphA2 (green) accumulates at the leading lamella (asterisk) of young cells. Individual fluorescent signals in the rectangles are shown in the adjacent panels. F, Time-lapse images of young (green) and old (red) hCPCs pre-stimulated with ephrin A1 and injected in the border zone of the acutely infarcted mouse heart. Arrows point to the position of clusters of young hCPCs. Note the lack of movement of old hCPCs. The apparent decrease in fluorescence intensity in some of the panels is dictated by a slight shift in the focal plane during image acquisition. See accompanying Video 1 in the online-only Data Supplement. G, Cell displacement with time. Green and red dots correspond to individual young and old hCPCs, respectively. Solid lines represent average values. The dotted line indicates the velocity of young hCPCs in the absence of ephrin A1. Data are mean ± SD (n=4). *P<0.0001. H, Expression of ephrin A1 in young and old human myocardium. *P=0.013. Optical density (O.D.) data were normalized to the expression of cardiac α-actinin (α-CA) and GAPDH. Young hearts: 34–38 years-old; Old: 68–70 years-old. I, Distribution of ephrin A1 (white) in p16INK4a-positive (green, arrows) and negative cardiomyocytes (α-sarcomeric actin: α-SA, red) in young and old human hearts.
Figure 1
Figure 1
Old hCPCs display cell-autonomous defects in migratory response. AC, Primary cultures of actively growing hCPCs (young) were subjected to serial passages (replicative senescence: old), or to doxorubicin exposure (stress-induced senescence: old). Young and old hCPCs express c-kit (green). Nuclei are stained with DAPI (blue). Phalloidin, grey. Localization of Ki-67 (A: red) decreases, and p16INK4a (B: red), and DDR foci (C: γH2A.X, green; 53BP1, red) increase in old hCPCs. Rectangles define areas illustrated at higher magnification in the insets (C). Data are mean ± SD (n=3–5). Only hCPCs with 2 or more γH2A.X foci were included in the quantitative analysis. Replicative senescence: *P=0.009, P=0.04, §P=0.02; Stress-induced senescence: *P<0.0001, P=0.04, §P=0.03. D, Transwell migration of young and old hCPCs after ephrin A1 stimulation, or in the presence of HGF. This assay shows a decreased migration of old hCPCs. Data are mean ± SD (n=8–12). *P=0.038 vs. control; P<0.0001 vs. control; **P<0.0001 vs. ephrin A1 only; #P<0.0001 vs. young. E, Young and old hCPCs exposed to a polarized source of HGF. EphA2 (green) accumulates at the leading lamella (asterisk) of young cells. Individual fluorescent signals in the rectangles are shown in the adjacent panels. F, Time-lapse images of young (green) and old (red) hCPCs pre-stimulated with ephrin A1 and injected in the border zone of the acutely infarcted mouse heart. Arrows point to the position of clusters of young hCPCs. Note the lack of movement of old hCPCs. The apparent decrease in fluorescence intensity in some of the panels is dictated by a slight shift in the focal plane during image acquisition. See accompanying Video 1 in the online-only Data Supplement. G, Cell displacement with time. Green and red dots correspond to individual young and old hCPCs, respectively. Solid lines represent average values. The dotted line indicates the velocity of young hCPCs in the absence of ephrin A1. Data are mean ± SD (n=4). *P<0.0001. H, Expression of ephrin A1 in young and old human myocardium. *P=0.013. Optical density (O.D.) data were normalized to the expression of cardiac α-actinin (α-CA) and GAPDH. Young hearts: 34–38 years-old; Old: 68–70 years-old. I, Distribution of ephrin A1 (white) in p16INK4a-positive (green, arrows) and negative cardiomyocytes (α-sarcomeric actin: α-SA, red) in young and old human hearts.
Figure 2
Figure 2
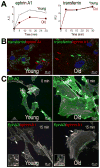
Endocytosis of ephrin A1 is impaired in old hCPCs. A, Young and old hCPCs were simultaneously treated with fluorescently-labeled ephrin A1 and transferrin and analyzed by flow-cytometry. The relative amount of intracellular ephrin A1 decreased in old hCPCs, while the quantity of transferrin did not vary in young and old hCPCs. A.U., arbitrary units. B, hCPCs exposed for 15 min to ephrin A1 (red) and transferrin (green). The distribution of the two ligands in cytosolic vesicles is similar in young hCPCs but differs in old hCPCs. Ephrin A1, red arrows; transferrin, green arrows. C, EphA2 (green) is located on the plasma membrane of untreated young and old hCPCs (0 min). EphA2 co-localizes with ephrin A1 (red) in the endocytic vesicles (orange) of ligand-stimulated young and old hCPCs (15 min). Intracellular and peri-nuclear distribution of endocytic vesicles in young hCPCs (lower left, arrows), and in proximity of the plasma membrane in old hCPCs (lower right, arrows). Rectangles define areas illustrated at higher magnification in the insets. D and E, Dynamic analysis of the translocation of ephrin A1-containing endosomes in EGFP-expressing hCPCs (green) treated with fluorescently-labeled ephrin A1 (red). D, Time-lapse images of EGFP-positive young and old hCPCs; overlaid trajectory of individual vesicles (red) illustrated with a color-coded time scale (blue-start, yellow-end). See accompanying Video 2 in the online-only Data Supplement. E, The distance of the vesicles from the plasma-membrane was computed as percent of cell diameter. Data are mean ± SD (n=3). *P=0.03 vs. old at 25 min. F, Images of EphA2 vesicles (upper, white) and color-coded depiction of their size (lower) 15 min after ephrin A1 stimulation. Note larger EphA2-containing endosomes (yellow-red color) in the center of a young cell (lower left). G, Area of EphA2 clusters formed in young and old hCPCs after ephrin A1 exposure. Data are mean ± SD (n=12). *P<0.0001 vs. 5 min, P<0.0001 vs. 5 min; **P<0.0001 vs. 15 min; #P<0.0001 vs. corresponding time in young.
Figure 2
Figure 2
Endocytosis of ephrin A1 is impaired in old hCPCs. A, Young and old hCPCs were simultaneously treated with fluorescently-labeled ephrin A1 and transferrin and analyzed by flow-cytometry. The relative amount of intracellular ephrin A1 decreased in old hCPCs, while the quantity of transferrin did not vary in young and old hCPCs. A.U., arbitrary units. B, hCPCs exposed for 15 min to ephrin A1 (red) and transferrin (green). The distribution of the two ligands in cytosolic vesicles is similar in young hCPCs but differs in old hCPCs. Ephrin A1, red arrows; transferrin, green arrows. C, EphA2 (green) is located on the plasma membrane of untreated young and old hCPCs (0 min). EphA2 co-localizes with ephrin A1 (red) in the endocytic vesicles (orange) of ligand-stimulated young and old hCPCs (15 min). Intracellular and peri-nuclear distribution of endocytic vesicles in young hCPCs (lower left, arrows), and in proximity of the plasma membrane in old hCPCs (lower right, arrows). Rectangles define areas illustrated at higher magnification in the insets. D and E, Dynamic analysis of the translocation of ephrin A1-containing endosomes in EGFP-expressing hCPCs (green) treated with fluorescently-labeled ephrin A1 (red). D, Time-lapse images of EGFP-positive young and old hCPCs; overlaid trajectory of individual vesicles (red) illustrated with a color-coded time scale (blue-start, yellow-end). See accompanying Video 2 in the online-only Data Supplement. E, The distance of the vesicles from the plasma-membrane was computed as percent of cell diameter. Data are mean ± SD (n=3). *P=0.03 vs. old at 25 min. F, Images of EphA2 vesicles (upper, white) and color-coded depiction of their size (lower) 15 min after ephrin A1 stimulation. Note larger EphA2-containing endosomes (yellow-red color) in the center of a young cell (lower left). G, Area of EphA2 clusters formed in young and old hCPCs after ephrin A1 exposure. Data are mean ± SD (n=12). *P<0.0001 vs. 5 min, P<0.0001 vs. 5 min; **P<0.0001 vs. 15 min; #P<0.0001 vs. corresponding time in young.
Figure 3
Figure 3
Fusion of ephrin A1/EphA2 vesicles with early and late endosomes is altered in old hCPCs. A and B, Time-dependent changes in the sub-cellular distribution of internalized ephrin A1 in young and old hCPCs stimulated with ephrin A1. After 5 min, ephrin A1 (red) co-localizes with EEA1 (green) and LAMP1 (blue). At 15 and 25 min, the association of ephrin A1 with EEA1 is apparent in young hCPCs and much less in old hCPCs. The two rectangles define the areas illustrated at higher magnification in panel B. Green arrows in young hCPCs point to the co-localization of ephrin A1 with EEA1. Light blue arrows in old hCPCs indicate ephrin A1 association with LAMP1. These vesicles are not labeled with EEA1. C, Quantitative analysis of EphA2 co-localization with EEA1 in young and old hCPCs treated with ephrin A1. Data are mean ± SD (n=6). *P<0.0001 vs. 5 min, P<0.0001 vs. 5 min; **P<0.0001 vs. 15 min; #P<0.0001 vs. corresponding time in young. D, Time-dependent changes in the association of EphA2 (blue) with EEA1 (green) and LAMP1 (red) in young and old hCPCs after treatment with ephrin A1. Rectangles define areas illustrated at higher magnification in the insets.
Figure 3
Figure 3
Fusion of ephrin A1/EphA2 vesicles with early and late endosomes is altered in old hCPCs. A and B, Time-dependent changes in the sub-cellular distribution of internalized ephrin A1 in young and old hCPCs stimulated with ephrin A1. After 5 min, ephrin A1 (red) co-localizes with EEA1 (green) and LAMP1 (blue). At 15 and 25 min, the association of ephrin A1 with EEA1 is apparent in young hCPCs and much less in old hCPCs. The two rectangles define the areas illustrated at higher magnification in panel B. Green arrows in young hCPCs point to the co-localization of ephrin A1 with EEA1. Light blue arrows in old hCPCs indicate ephrin A1 association with LAMP1. These vesicles are not labeled with EEA1. C, Quantitative analysis of EphA2 co-localization with EEA1 in young and old hCPCs treated with ephrin A1. Data are mean ± SD (n=6). *P<0.0001 vs. 5 min, P<0.0001 vs. 5 min; **P<0.0001 vs. 15 min; #P<0.0001 vs. corresponding time in young. D, Time-dependent changes in the association of EphA2 (blue) with EEA1 (green) and LAMP1 (red) in young and old hCPCs after treatment with ephrin A1. Rectangles define areas illustrated at higher magnification in the insets.
Figure 4
Figure 4
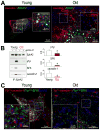
EphA2 binding to downstream effectors in endosomes is inhibited in old hCPCs. A, Co-localization of caveolin-1 (red), EEA1 (green) and EphA2 (blue) in the cytosol of young hCPCs exposed to ephrin A1 for 25 min. This co-localization is markedly attenuated in old hCPCs. Rectangles define areas illustrated at higher magnification in the insets. B, Immunoprecipitation and Western blotting of EphA2 protein (IP: EphA2) from young and old hCPCs in the presence (+) or absence (−) of ephrin A1. pTyr, phospho-tyrosine. O.D. data were normalized to the efficiency of EphA2 immunoprecipitation relative to unstimulated cells (−). Data are mean ± SD (n=3). pTyr: *P=0.037; SFK: *P=0.033; caveolin-1: *P=0.023. C, Accumulation of Tyr14-caveolin-1 (red), Tyr416-SFK (green) and EphA2 (blue) in endocytic vesicles of young and old hCPCs stimulated with ephrin A1. Rectangles define areas illustrated at higher magnification in the insets. DG, Young hCPCs pre-treated with SFK inhibitor (SFKi) or DMSO vehicle (control) were exposed to ephrin A1 for 25 min or left unstimulated (−). D, Color-coded images illustrating the intensity of Tyr14-caveolin-1 labeling in hCPCs. E, Color-coded representation of the caveolin-1 labeling pattern in ephrin A1-treated hCPCs. F, Ephrin A1-induced EphA2 endocytosis (white) in control and SFKi-treated hCPCs. G, Fluorometric measurement of the internalized fluorescently labeled ephrin A1 at 15 min. Data are mean ± SD (n=3). *P=0.021.
Figure 4
Figure 4
EphA2 binding to downstream effectors in endosomes is inhibited in old hCPCs. A, Co-localization of caveolin-1 (red), EEA1 (green) and EphA2 (blue) in the cytosol of young hCPCs exposed to ephrin A1 for 25 min. This co-localization is markedly attenuated in old hCPCs. Rectangles define areas illustrated at higher magnification in the insets. B, Immunoprecipitation and Western blotting of EphA2 protein (IP: EphA2) from young and old hCPCs in the presence (+) or absence (−) of ephrin A1. pTyr, phospho-tyrosine. O.D. data were normalized to the efficiency of EphA2 immunoprecipitation relative to unstimulated cells (−). Data are mean ± SD (n=3). pTyr: *P=0.037; SFK: *P=0.033; caveolin-1: *P=0.023. C, Accumulation of Tyr14-caveolin-1 (red), Tyr416-SFK (green) and EphA2 (blue) in endocytic vesicles of young and old hCPCs stimulated with ephrin A1. Rectangles define areas illustrated at higher magnification in the insets. DG, Young hCPCs pre-treated with SFK inhibitor (SFKi) or DMSO vehicle (control) were exposed to ephrin A1 for 25 min or left unstimulated (−). D, Color-coded images illustrating the intensity of Tyr14-caveolin-1 labeling in hCPCs. E, Color-coded representation of the caveolin-1 labeling pattern in ephrin A1-treated hCPCs. F, Ephrin A1-induced EphA2 endocytosis (white) in control and SFKi-treated hCPCs. G, Fluorometric measurement of the internalized fluorescently labeled ephrin A1 at 15 min. Data are mean ± SD (n=3). *P=0.021.
Figure 5
Figure 5
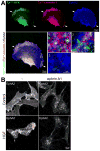
EphA2 and c-Met signaling pathways interact in hCPCs. A, Accumulation of Tyr416-SFK (green), Tyr14-caveolin-1 (red) and EphA2 (blue) in the areas of membrane activity (arrows) formed in young hCPCs in response to HGF. Individual fluorescent signals (upper panels); merge (lower left panel). Rectangles define areas illustrated at higher magnification in the 3 insets. EphA2 co-localization with Tyr416-SFK and Tyr14-caveolin-1 is depicted in insets 1 and 2. Inset 3 shows the absence of this phenomenon. B, EphA2 (white) endocytosis in young hCPCs treated with HGF (lower left), ephrin A1 (upper right), or both (lower right). Control, untreated hCPCs.
Figure 6
Figure 6
Oxidative stress inhibits EphA2 signaling in hCPCs. A, DHE labeling in young and old hCPCs. Arrows point to accumulations of oxidized DHE in the nuclei of old cells. B, Fluorometric measurement of H2DCFDA intensity. Data are mean ± SD (n=6). *P=0.018. CE, Young hCPCs were pre-treated with H2O2 or left untreated (control) for 30 min. Cells were then stimulated with ephrin A1 for 25 min (+) or left unstimulated (−). C, Phospho-tyrosine level of the EphA2 receptor (pTyr-EphA2) by immunoprecipitation and Western blotting (IP: EphA2). O.D. data are normalized to the efficiency of EphA2 immunoprecipitation, expressed relative to control. Data are mean ± SD (n=3). *P=0.049. D, Color-coded images of Tyr416-SFK labeling in ephrin A1-treated hCPCs. E, Ephrin A1-induced EphA2 endocytosis (white) in control and H2O2-treated hCPCs. F, Transwell migration assay of young hCPCs (young), H2O2-exposed young hCPCs (young-H2O2) and untreated old hCPCs (old). The number of spontaneously migrated cells (−) and in response to HGF (+) are shown. Data are mean ± SD (n=4). *P=0.004 vs. (−) young hCPCs. G, Two-dimensional gel electrophoresis of the EphA2 receptor (2D:EphA2) in untreated young hCPCs, young hCPCs exposed to H2O2 (young-H2O2), and untreated old hCPCs; pI values are indicated. The overlay histogram shows the line scan of the O.D. distribution for each condition. H, Co-localization of caveolin-1 (red) and EphA2 (green) in the cytosol of old hCPCs exposed to ephrin A1. This co-localization is markedly increased in cells pre-treated with NAC (right). Rectangles define areas illustrated at higher magnification in the insets. Control, no NAC. I, Oxidized DHE (red, arrows) is detected in the nuclei of old hCPCs in the absence of PEG-catalase (left: control). Treatment with PEG-catalase (right) attenuated oxidative stress in old hCPCs. J, Ephrin A1 (red) co-localizes with EEA1 (green) in old hCPCs treated with PEG-catalase (right). LAMP1 (blue). Rectangles define the areas illustrated at higher magnification in the insets. Control, no PEG-catalase.
Figure 6
Figure 6
Oxidative stress inhibits EphA2 signaling in hCPCs. A, DHE labeling in young and old hCPCs. Arrows point to accumulations of oxidized DHE in the nuclei of old cells. B, Fluorometric measurement of H2DCFDA intensity. Data are mean ± SD (n=6). *P=0.018. CE, Young hCPCs were pre-treated with H2O2 or left untreated (control) for 30 min. Cells were then stimulated with ephrin A1 for 25 min (+) or left unstimulated (−). C, Phospho-tyrosine level of the EphA2 receptor (pTyr-EphA2) by immunoprecipitation and Western blotting (IP: EphA2). O.D. data are normalized to the efficiency of EphA2 immunoprecipitation, expressed relative to control. Data are mean ± SD (n=3). *P=0.049. D, Color-coded images of Tyr416-SFK labeling in ephrin A1-treated hCPCs. E, Ephrin A1-induced EphA2 endocytosis (white) in control and H2O2-treated hCPCs. F, Transwell migration assay of young hCPCs (young), H2O2-exposed young hCPCs (young-H2O2) and untreated old hCPCs (old). The number of spontaneously migrated cells (−) and in response to HGF (+) are shown. Data are mean ± SD (n=4). *P=0.004 vs. (−) young hCPCs. G, Two-dimensional gel electrophoresis of the EphA2 receptor (2D:EphA2) in untreated young hCPCs, young hCPCs exposed to H2O2 (young-H2O2), and untreated old hCPCs; pI values are indicated. The overlay histogram shows the line scan of the O.D. distribution for each condition. H, Co-localization of caveolin-1 (red) and EphA2 (green) in the cytosol of old hCPCs exposed to ephrin A1. This co-localization is markedly increased in cells pre-treated with NAC (right). Rectangles define areas illustrated at higher magnification in the insets. Control, no NAC. I, Oxidized DHE (red, arrows) is detected in the nuclei of old hCPCs in the absence of PEG-catalase (left: control). Treatment with PEG-catalase (right) attenuated oxidative stress in old hCPCs. J, Ephrin A1 (red) co-localizes with EEA1 (green) in old hCPCs treated with PEG-catalase (right). LAMP1 (blue). Rectangles define the areas illustrated at higher magnification in the insets. Control, no PEG-catalase.
Figure 7
Figure 7
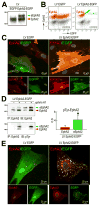
Functional EphA2 receptor potentiates ephrin A1 signaling in old hCPCs. A, Old hCPCs were infected with a lentivirus (LV) carrying EphA2-EGFP or EGFP only. Western blotting: EphA2-EGFP fusion protein (eEphA2) has a higher molecular weight (green arrow) than endogenous EphA2 (red arrow). Molecular weight is indicated in kDa. B, Flow-cytometry: EphA2 (red), eEphA2 (green), and EGFP in old hCPCs. Secondary IgG, control (grey). C, In the absence of ephrin A1, exogenous EphA2 (orange: native EGFP fluorescence and immunolabeled red) is highly expressed and is localized on the membrane of old hCPCs. Individual fluorescent signals are illustrated in the lower panels. D, Immunoprecipitation of EphA2 protein (IP: EphA2) and immunoblotting of phospho-tyrosine (IB: pTyr) in LV EphA2-EGFP old hCPCs in the presence (+) or absence (−) of ephrin A1. O.D. data were normalized to the efficiency of eEphA2 and EphA2 immunoprecipitation relative to unstimulated cells (−). Data are mean ± SD (n=4). *P=0.035. Exogenous EphA2 (eEphA2, green arrows) has a higher molecular weight than endogenous EphA2 (EphA2, red arrows). E, EphA2 endocytosis after 15 min stimulation with ephrin A1 of LV EGFP and LV EphA2-EGFP old hCPCs. The number of EphA2-containing vesicles is higher in LV EphA2-EGFP hCPCs. F, Exogenous EphA2 (native EGFP fluorescence and immunolabeled red) co-localizes with caveolin-1 (blue) in old LV EphA2-EGFP hCPCs stimulated for 15 min with ephrin A1. This is apparent in area 1 (arrows) shown at higher magnification in the adjacent panel. Endogenous EphA2 (immunolabeled red) failed to co-localize with caveolin-1 (see area 2 at low and high magnification). G and H, In old LV EphA2-EGFP hCPCs, exogenous EphA2 (orange: native EGFP fluorescence and immunolabeled red) co-localizes with EEA1 (G, blue; green arrow in inset 1) but not with LAMP1 (H, blue; green arrows in the insets) after stimulation with ephrin A1 for 15 min. Endogenous EphA2 (immunolabeled red) does not co-localize with EEA1 (G, blue arrow in inset 2) but co-localizes with LAMP1 (H; blue arrows in the insets). I, Time-lapse images of chemotaxis of old LV EphA2-EGFP and LV EGFP hCPCs in response to HGF. See accompanying Video 3 in the online-only Data Supplement. J, Fraction of migrating cells. Data are mean ± SD (n=4). *P=0.002.
Figure 7
Figure 7
Functional EphA2 receptor potentiates ephrin A1 signaling in old hCPCs. A, Old hCPCs were infected with a lentivirus (LV) carrying EphA2-EGFP or EGFP only. Western blotting: EphA2-EGFP fusion protein (eEphA2) has a higher molecular weight (green arrow) than endogenous EphA2 (red arrow). Molecular weight is indicated in kDa. B, Flow-cytometry: EphA2 (red), eEphA2 (green), and EGFP in old hCPCs. Secondary IgG, control (grey). C, In the absence of ephrin A1, exogenous EphA2 (orange: native EGFP fluorescence and immunolabeled red) is highly expressed and is localized on the membrane of old hCPCs. Individual fluorescent signals are illustrated in the lower panels. D, Immunoprecipitation of EphA2 protein (IP: EphA2) and immunoblotting of phospho-tyrosine (IB: pTyr) in LV EphA2-EGFP old hCPCs in the presence (+) or absence (−) of ephrin A1. O.D. data were normalized to the efficiency of eEphA2 and EphA2 immunoprecipitation relative to unstimulated cells (−). Data are mean ± SD (n=4). *P=0.035. Exogenous EphA2 (eEphA2, green arrows) has a higher molecular weight than endogenous EphA2 (EphA2, red arrows). E, EphA2 endocytosis after 15 min stimulation with ephrin A1 of LV EGFP and LV EphA2-EGFP old hCPCs. The number of EphA2-containing vesicles is higher in LV EphA2-EGFP hCPCs. F, Exogenous EphA2 (native EGFP fluorescence and immunolabeled red) co-localizes with caveolin-1 (blue) in old LV EphA2-EGFP hCPCs stimulated for 15 min with ephrin A1. This is apparent in area 1 (arrows) shown at higher magnification in the adjacent panel. Endogenous EphA2 (immunolabeled red) failed to co-localize with caveolin-1 (see area 2 at low and high magnification). G and H, In old LV EphA2-EGFP hCPCs, exogenous EphA2 (orange: native EGFP fluorescence and immunolabeled red) co-localizes with EEA1 (G, blue; green arrow in inset 1) but not with LAMP1 (H, blue; green arrows in the insets) after stimulation with ephrin A1 for 15 min. Endogenous EphA2 (immunolabeled red) does not co-localize with EEA1 (G, blue arrow in inset 2) but co-localizes with LAMP1 (H; blue arrows in the insets). I, Time-lapse images of chemotaxis of old LV EphA2-EGFP and LV EGFP hCPCs in response to HGF. See accompanying Video 3 in the online-only Data Supplement. J, Fraction of migrating cells. Data are mean ± SD (n=4). *P=0.002.
Figure 8
Figure 8
Adhesion to ephrin A1 enriches the pool of young hCPCs. A, Schematic representation of the sorting steps for the separation of hCPCs with functional (green) and dysfunctional (brown) EphA2 receptors. The heterogeneous cell pool is exposed to ephrin A1-coated surfaces. The non-adherent fraction contains primarily old cells. The adherent fraction is enriched with young hCPCs. B, Adhesion assay to ephrin A1 or to control human IgG-coated plates. The efficiency of adhesion in young and old hCPCs is expressed relative to the input cell number. Data are mean ± SD (n=4). *P<0.0001 vs. control young; **P<0.0001 vs. young hCPCs that adhered to ephrin A1. C, Expression of p16INK4a (upper panels, green) and γH2A.X (lower panels, green) in hCPCs separated according to the adhesion assay, i.e., unsorted control, and adherent and non-adherent hCPCs. D, Percent of hCPCs positive for p16INK4a and γH2A.X. Data are mean ± SD (n=5). *P=0.0023 vs. control, **P<0.0001 vs. adherent, P=0.0048 vs. control, #P<0.0001 vs. adherent.

Comment in

References

    1. Leri A, Kajstura J, Anversa P. Role of cardiac stem cells in cardiac pathophysiology: A paradigm shift in human myocardial biology. Circ Res. 2011;109:941–961. - PMC - PubMed
    1. Anversa P, Kajstura J, Rota M, Leri A. Regenerating new heart with stem cells. J Clin Invest. 2013;123:62–70. - PMC - PubMed
    1. Torella D, Rota M, Nurzynska D, Musso E, Monsen A, Shiraishi I, Zias E, Walsh K, Rosenzweig A, Sussman MA, Urbanek K, Nadal-Ginard B, Kajstura J, Anversa P, Leri A. Cardiac stem cell and myocyte aging, heart failure, and insulin-like growth factor-1 overexpression. Circ Res. 2004;94:514–524. - PubMed
    1. Gonzalez A, Rota M, Nurzynska D, Misao Y, Tillmanns J, Ojaimi C, Padin-Iruegas ME, Muller P, Esposito G, Bearzi C, Vitale S, Dawn B, Sanganalmath SK, Baker M, Hintze TH, Bolli R, Urbanek K, Hosoda T, Anversa P, Kajstura J, Leri A. Activation of cardiac progenitor cells reverses the failing heart senescent phenotype and prolongs lifespan. Circ Res. 2008;102:597–606. - PubMed
    1. Kajstura J, Gurusamy N, Ogorek B, Goichberg P, Clavo-Rondon C, Hosoda T, D’Amario D, Bardelli S, Beltrami AP, Cesselli D, Bussani R, del Monte F, Quaini F, Rota M, Beltrami CA, Buchholz BA, Leri A, Anversa P. Myocyte turnover in the aging human heart. Circ Res. 2010;107:1374–1386. - PubMed

Publication types