. 2013 Dec;16(12):1821-9.
doi: 10.1038/nn.3547. Epub 2013 Oct 20.

Integration of the olfactory code across dendritic claws of single mushroom body neurons

Affiliations

Integration of the olfactory code across dendritic claws of single mushroom body neurons

Eyal Gruntman et al. Nat Neurosci. 2013 Dec.

Abstract

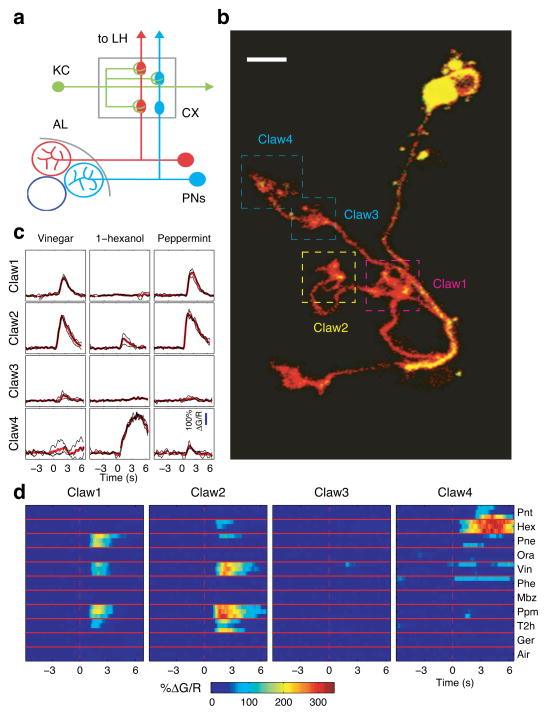
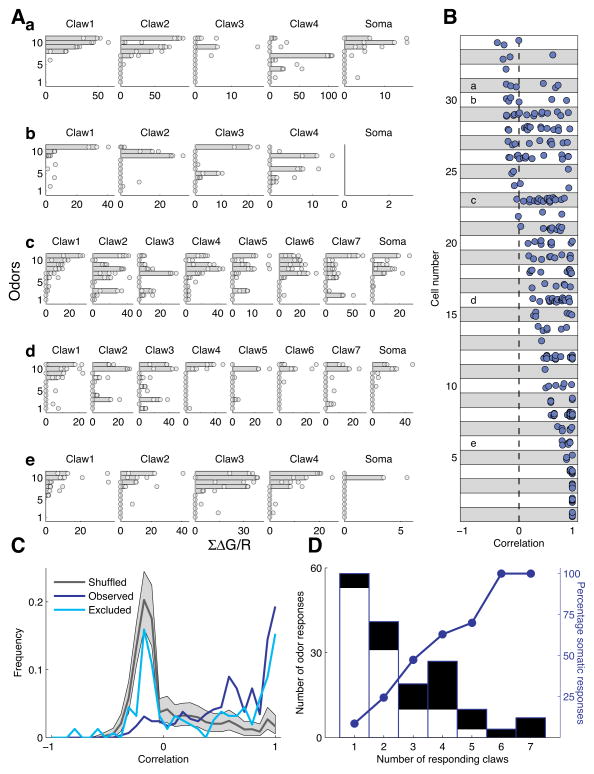
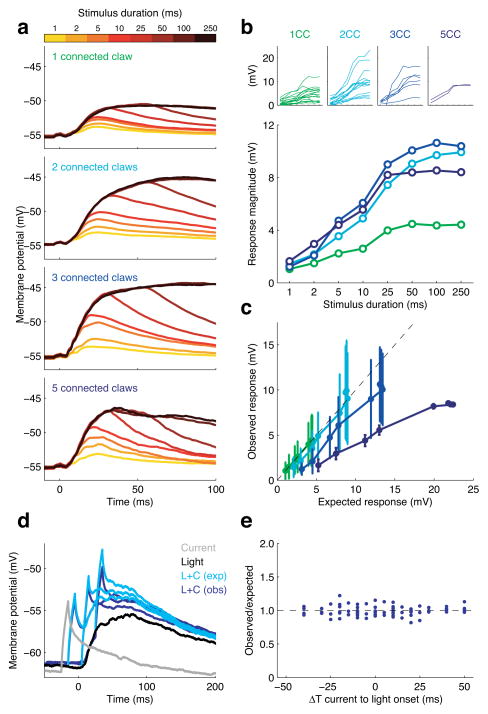
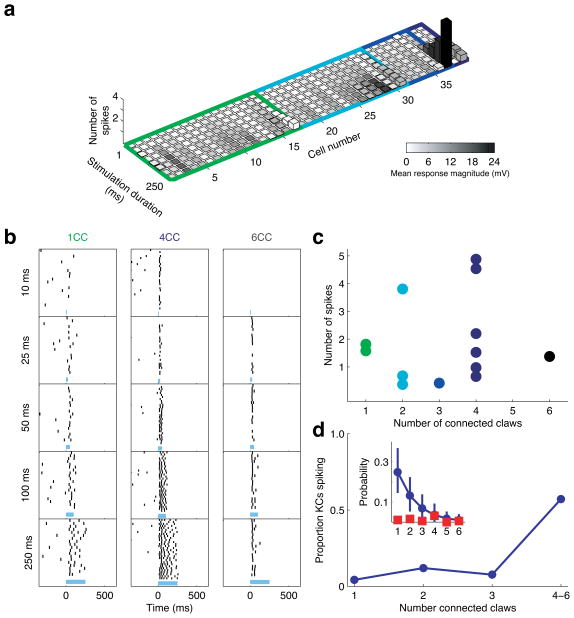
In the olfactory system, sensory inputs are arranged in different glomerular channels, which respond in combinatorial ensembles to the various chemical features of an odor. We investigated where and how this combinatorial code is read out deeper in the brain. We exploited the unique morphology of neurons in the Drosophila mushroom body, which receive input on large dendritic claws. Imaging odor responses of these dendritic claws revealed that input channels with distinct odor tuning converge on individual mushroom body neurons. We determined how these inputs interact to drive the cell to spike threshold using intracellular recordings to examine mushroom body responses to optogenetically controlled input. Our results provide an elegant explanation for the characteristic selectivity of mushroom body neurons: these cells receive different types of input and require those inputs to be coactive to spike. These results establish the mushroom body as an important site of integration in the fly olfactory system.


Conflict of interest statement

Competing Financial Interests The authors declare no competing financial interests.

Figures

Figure 1
Figure 1. Imaging dendritic claws of Kenyon cells reveals distinct odor responses
a) Schematic of the Drosophila olfactory circuit. Projection Neurons (PNs) in the antennal lobe (AL) send axons to mushroom body calyx (CX) where they make synaptic contact with Kenyon cells (KCs) via large synaptic boutons that are enwrapped by claw-shaped dendrites. b) An example KC with five claws labeled with GCaMP3 and the anatomical marker myr-tdTomato. Image is a projection of a z-series that bracketed the cell body and dendritic region of the MB. Boxes demarcate claws whose odor responses were characterized. Note that, in this particular example, we imaged four of the total five claws (fifth claw located on bottom left, not demarcated). Scale bar, 5 μm. c) Odor response timecourses (ΔG/R) from dendritic claws numbered in b. Responses from individual trials are shown in black (n=3), mean responses in red. Odor valve opening is at t=0. Note distinct odor responses in claws 3 and 4 despite their close physical proximity. d)Δ G/R responses of each claw from b to panel of 10 odorants (3 trials per odor).
Figure 2
Figure 2. KC dendrites collect inputs with diverse odor response profiles
A) Odor response profiles of dendritic claws and the cell bodies from five different KCs (a–e). All the claws imaged from a single KC are presented in a single row with each sub-panel depicting the results from a single claw (or soma). Points are responses to a single odor presentation, while bars represent the median. Claws are arranged by the order in which they were imaged; odors are ordered for each cell based on the sorted response of the first imaged claw. B) Pairwise correlations of claw response profiles (n=34 KCs). Correlation of claws from the same KC are demarcated within a box. KCs are ordered according to the minimal correlation score. Of the 34 total KCs, 13 cells had pairs of claws with correlation below 0, while 25 cells had pairs with correlation below 0.5. Letters refer to the KCs shown in A. C) Correlation between claws is higher than expected by chance. Shuffled dataset was generated by calculating correlations on random sets of claws (see Methods). Excluded dataset was generated by excluding odors that evoked somatic responses for each KC separately and calculating pairwise correlation on the reduced response profiles. Note that the negative correlation peak is a result of sparse responses to different odors (e.g claws that respond to different odors will appear negatively correlated). D) Somatic responses as a function of responding claws. The height of each bar indicates the number of instances where n claws of a KC responded to an odor. The black fill denotes instances where there was also a somatic response in at least 2 of the 3 odor presentations. Blue curve shows the probability of somatic response as a function of number of responding claws.
Figure 3
Figure 3. Detecting functional and anatomical connectivity between PNs and KCs using ChR2-based stimulation
a) Experimental schematic. ChR2-YFP was expressed in PNs innervating 3 of the 54 total glomeruli. Whole-cell KC recordings enabled detection of functional connectivity while intracellular dye-filling enabled characterization of anatomical connectivity b) PN spiking responses to photostimulation. c) Mean PN spiking rates (n=8) obtained with different photostimulation durations. d) Postsynaptic responses of an example KC. Black traces indicate membrane potential recorded on a sample of individual trials, and magenta traces the mean (n=50 trials). Blue shading indicates timing of photostimulation. Note that for this KC, the strongest stimulation evoked a response containing several spikes (denoted by an asterisk). e) Overlay of single trial responses of a KC to increasing PN photostimulation, showing the increase in the evoked response, which culminates with a single spike (denoted by an asterisk). Same KC as in d. f) Examples of PN to KC connections. Magenta: individual dye-filled KC claws. Green: YFP expressing PN boutons. Right: merge showing contact. Scale bar, 2 μM. g) Comparison of the number of connected claws expected from random connectivity (blue bars) with the number observed experimentally (red dots). Blue bars denote the 99% confidence interval of the expected probability of each connection level, calculated using a binomial distribution with probability of connection p=0.05 (see Methods). Note that we observed 2 KCs connected via five claws in our sample of 39 connected cells, while the expected probability of observing 5 connected claws if connectivity were random is p < 0.00001.
Figure 4
Figure 4. Additivity of synaptic input in KCs
a) Average timecourses of KC membrane potential in response to different durations of photostimulation (colorbar). KC responses are grouped according to the number of claws receiving direct PN input (connected claws, CC). b) Response magnitudes increase with number of connected claws. Each line in the large panel depicts the mean peak responses of KCs with n connected claws. Insets above show the mean peak responses for each individual KC grouped by the number of connected claws. c) Multiple synaptic inputs interact sublinearly in KCs. Expected response amplitudes were calculated for each duration of photostimulation (see panel b), assuming linear additivity of inputs across multiple claws. Experimentally observed responses for cells with 3 and 5 active claws fell below this linear prediction, indicating that multiple inputs interact sublinearly. Bars indicate ± SEM. d) Overlay of KC membrane potential responses to combined photostimulation and somatic current injection, with current delivered at three different times relative to photostimulation. Observed responses (dark blue) closely matched those expected from linear summation (light blue) of isolated light and current responses. e) Observed/Expected ratio for current and light stimulations across a range of different relative timings (n=7 KCs).
Figure 5
Figure 5. Kenyon cells require activation of multiple dendritic claws to spike
a) Histogram depicting both subthreshold (grayscale heatmap) and suprathreshold (z-axis) responses to PN photostimulation in synaptically connected KCs (n=39 KCs). Colored frames demarcate cells according to the number of connected claws; colors as in Fig. 4b. Bar height indicates number of spikes above spontaneous firing. Note the sparsity of spiking responses in this dataset, selected solely for synaptic connectivity to ChR2-expressing PNs, where only two cells showed reliable spiking responses (>0.5 sp/trial), one connected via 3 claws and another via 5. b) Example KC spiking responses to photostimulation. In this dataset (distinct from a), n=191 KCs were recorded, and those exhibiting a reliable spiking response were selected for anatomical analysis to determine the number of connected claws for each cell. Each column of rasters shows an example of spiking activity observed for a particular level of connectivity. Duration of photostimulation shown at left and timing indicated by blue bar c) Number of spikes evoked by photostimulation in KCs with different numbers of claws connected to ChR2-expressing PNs (n=13 spiking KCs). d) Proportion of KCs exhibiting a spiking response across different levels of connectivity. KCs with 4 to 6 connected claws combined for analysis. Inset: Blue points indicate expected distribution of connectivity levels (99th percentile confidence interval), red points indicate observed frequency of spiking cells with different numbers of connected claws (see Methods).

Similar articles

Cited by

References

    1. Hallem EA, Carlson JR. Coding of odors by a receptor repertoire. Cell. 2006;125:143–160. - PubMed
    1. Benton R, Vannice KS, Gomez-Diaz C, Vosshall LB. Variant ionotropic glutamate receptors as chemosensory receptors in Drosophila. Cell. 2009;136:149–162. - PMC - PubMed
    1. Vosshall LB, Wong AM, Axel R. An olfactory sensory map in the fly brain. Cell. 2000;102:147–159. - PubMed
    1. Chou YH, et al. Diversity and wiring variability of olfactory local interneurons in the Drosophila antennal lobe. Nat Neurosci. 2010;13:439–449. - PMC - PubMed
    1. Olsen SR, Bhandawat V, Wilson RI. Divisive normalization in olfactory population codes. Neuron. 2010;66:287–299. - PMC - PubMed

Publication types

MeSH terms

LinkOut - more resources