. 2013 Dec;16(12):1870-8.
doi: 10.1038/nn.3555. Epub 2013 Oct 20.

Parallel, multi-stage processing of colors, faces and shapes in macaque inferior temporal cortex

Affiliations

Parallel, multi-stage processing of colors, faces and shapes in macaque inferior temporal cortex

Rosa Lafer-Sousa et al. Nat Neurosci. 2013 Dec.

Abstract

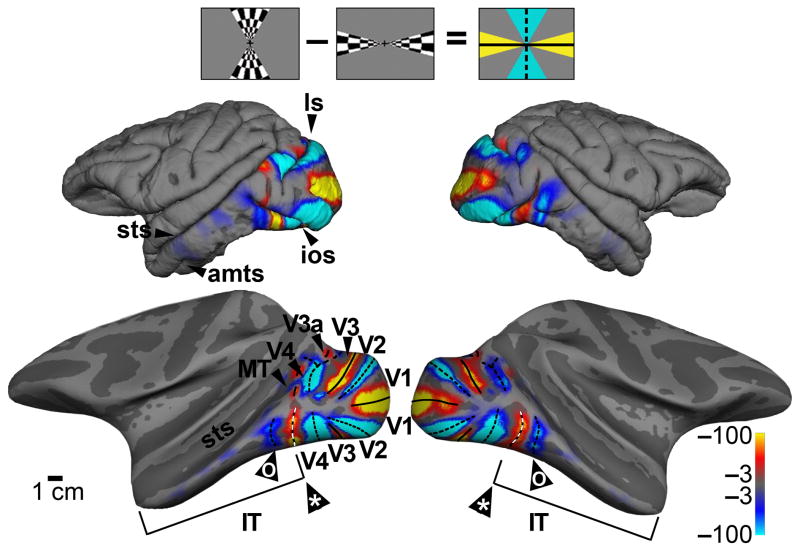
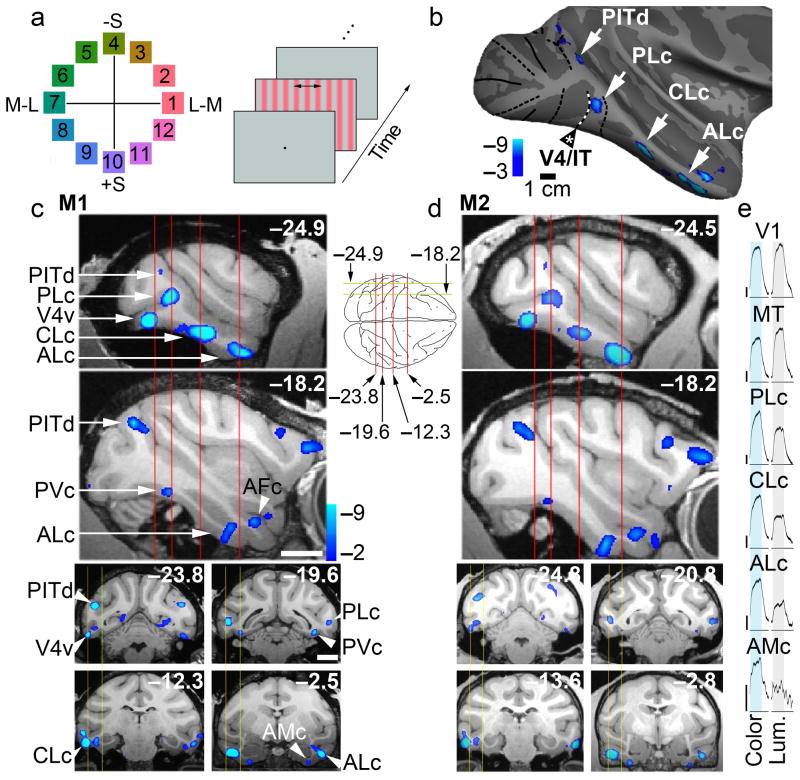
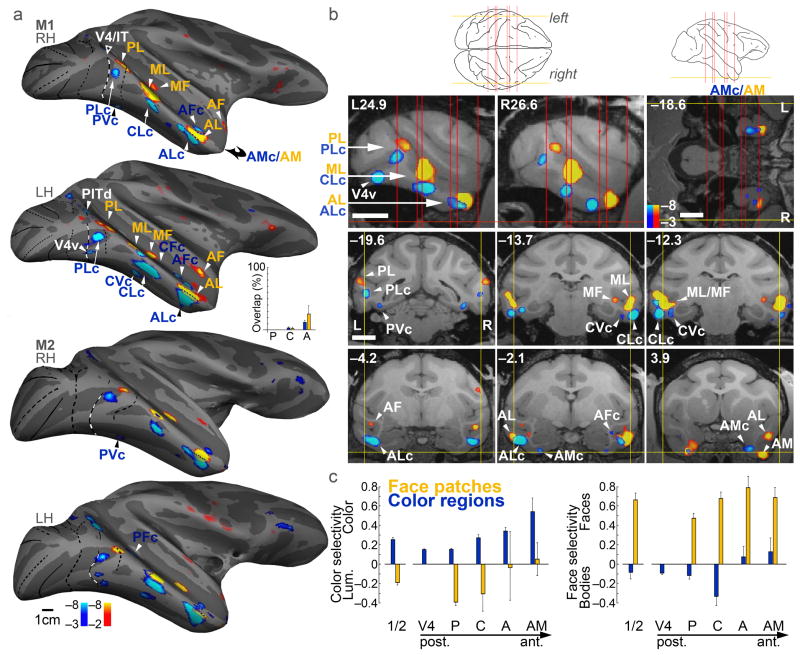
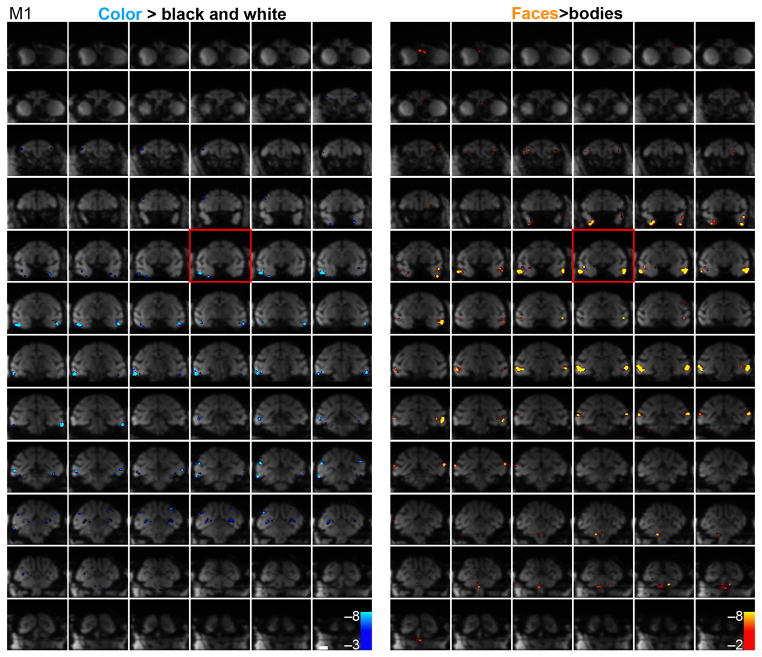
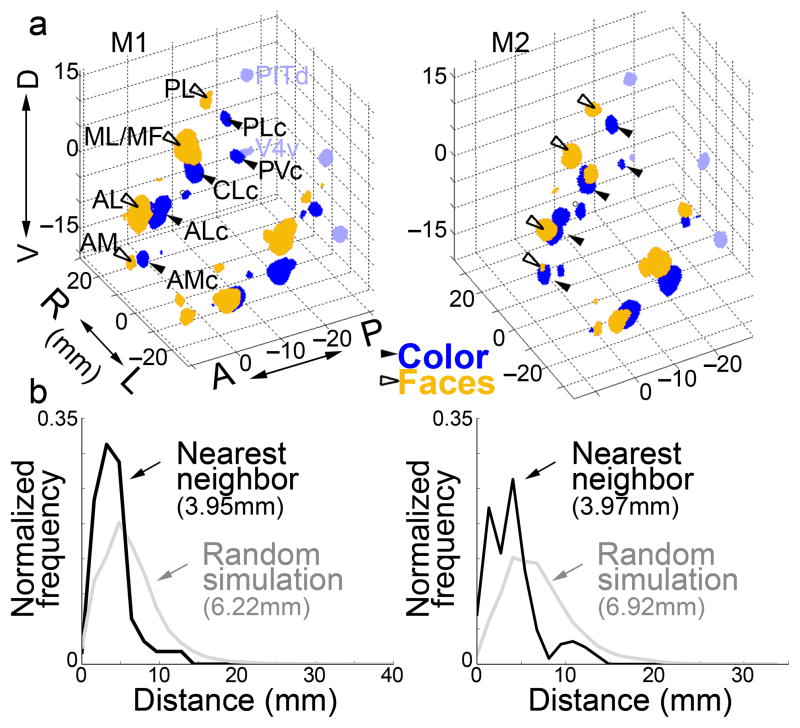
Visual-object processing culminates in inferior temporal cortex (IT). To assess the organization of IT, we measured functional magnetic resonance imaging responses in alert monkeys to achromatic images (faces, fruit, bodies and places) and colored gratings. IT contained multiple color-biased regions, which were typically ventral to face patches and yoked to them, spaced regularly at four locations predicted by known anatomy. Color and face selectivity increased for more anterior regions, indicative of a broad hierarchical arrangement. Responses to non-face shapes were found across IT, but were stronger outside color-biased regions and face patches, consistent with multiple parallel streams. IT also contained multiple coarse eccentricity maps: face patches overlapped central representations, color-biased regions spanned mid-peripheral representations and place-biased regions overlapped peripheral representations. These results show that IT comprises parallel, multi-stage processing networks subject to one organizing principle.


Figures

Figure 1
Figure 1
Identification of the boundaries of inferior temporal cortex and retinotopic visual areas using fMRI and retinotopic mapping. Stronger responses to stimulation along vertical meridians are shown in blue-cyan; stronger responses to stimulation along the horizontal meridian are shown in orange-red. Icon at top shows the visual stimulus. Pial surface view, top; computationally inflated view, bottom (representative activation shown for M1). In addition to a clear V4/IT boundary (*), the maps reveal a vertical meridian representation within IT (o). Color scale bars show significance as the common logarithm of the probability of error. ls, lunate sulcus; sts, superior temporal sulcus; ios, inferior occipital sulcus; amts, anterior middle temporal sulcus.
Figure 2
Figure 2
Functional architecture of color-biased regions in alert macaque IT. a, Color stimuli shown in the equiluminant plane of the DKL color space; colors 1 and 7 modulate only the L and M cones; colors 10 and 4 modulate only the S cones; other colors modulate all cone classes (Supplementary Fig. 2). Right panel shows the stimulus paradigm: color-gray gratings presented in 32 s blocks, maintaining mean luminance of 55 cd/m2, interleaved with neutral gray, in two stimulus orders. b, Regions (blue-cyan) of M1, right hemisphere, showed greater activation to colors 7 & 8 than achromatic contrast gratings (PLc, posterior lateral color; CLc, central lateral color; ALc, anterior lateral color). c, Top two panels show color-biased activation in sagittal slices at locations indicated by the yellow lines on the top-down view of the brain schematic. Bottom four panels show color-biased activation in coronal sections corresponding to the red planes of section in the sagittal slices. Scale bars, 1cm; slices given in Talairach coordinates (mm). d, Data as in panel c, for a second monkey. Functional data has been superimposed on high-resolution anatomical scans. e, Time-course traces averaging activity during all color-grating blocks and achromatic-luminance-grating blocks within each visual region. Vertical scale is 1% fMRI response (upward deflections correspond to increases in neural activity). Total number of runs for M1, 49; for M2, 21; 17 blocks/run (272 measurements/run); 16 TR/block; TR=2sec. See Supplementary Fig. 3a for the time course of the response to individual colors within each region of IT.
Figure 3
Figure 3
Color-biased fMRI activation (blue-cyan) found at corresponding locations to face patches (orange-red). a, Activity in two monkeys (M1, M2) on an inflated brain, lateral view, rotated 20° up to show the ventral surface. Left hemispheres (LH) have been horizontally flipped. Area boundaries as in Figure 1. See text for naming conventions. Inset shows the percent of face-patches that were color-biased (orange bars), and the percent of color-biased regions that were part of face patches (blue bars); overlap increased from P→A (orange bars, p=0.04; blue bars, p=0.0008, multiple linear regression, N=4). b, Slices through M1 (Talairach coordinates), showing color-biased and face-biased activation. Top left two panels, sagittal slices (L, left; R, right; section plane: yellow lines, left schematic). Top right panel, horizontal slice (section plane: yellow line, right schematic, and horizontal red line, sagittal slices). Bottom six panels show coronal sections (plane of section: red lines in schematics). Scale bar, 1cm. c, Color selectivity and face selectivity for face patches (orange bars) and color-biased regions (blue bars). Color regions were significantly more color selective than face regions (p= 9×10⁻⁴), and face regions were significantly more face selective than color regions (p= 4×10⁻¹⁰) (unpaired two-tailed t-tests, N=16; 4 color regions/hemi, 4 face regions/hemi, 4 hemis). Color selectivity increased along the P→A axis (R2=0.055, p=0.0002; multiple linear regression, N=4). Error bars show s. e. The “1/2” bars show selectivity averaged across ROIs, within ROIs defined by ½ the data set.
Figure 4
Figure 4
Raw functional echo planar (EPI) coronal images showing MION activation every 1 mm; color-biased activation (blue, left panels) and face-biased activation (blue, right panels) of M1. See Supplementary Figure 5 for these data obtained in M2. Spurious activation outside the brain has been masked. The slice corresponding to Talairach coordinate 0 along the P-A axis is boxed in red. Scale bar, 1 cm.
Figure 5
Figure 5
Quantification of the spatial relationship of color-biased regions and face patches in alert macaque IT. a, 3-D plot showing color-biased regions (blue, solid arrowheads) and face patches (orange, open arrowheads) in both hemispheres for both animals (M1, M2); see text for labeling convention; color-biased regions in the V4 Complex in light blue. Axes show Talairach coordinates (D, dorsal; V, ventral; R, right; L, left; A, anterior; P, posterior). b, Histograms of distances from each IT color-selective voxel to its nearest face-selective voxel (M1, left; M2, right), and a simulation of the outcome if the regions were distributed randomly, allowing for overlap. The average separation (~4mm) was significantly closer than expected by chance (6–7mm; Mann–Whitney–Wilcoxon test M1, p=1×10⁻¹⁷, N = 278 voxel to voxel distances; M2, p=5×10⁻¹⁰, N = 247). The observed distributions also show a lower variance than the simulated distributions (Squared Ranks Test: M1, p<10−3; M2, p<10−6). We also computed the average distance of a face voxel to its nearest color voxel, and a random simulation, in each hemisphere separately (N=4). The distances were significantly shorter than random in all four hemispheres (Mann–Whitney–Wilcoxon, M1 LH, p=1×10⁻¹³; M1 RH, p=3×10⁻¹⁵; M2 LH, p=5×10⁻²⁷; M2 RH, p=9×10⁻¹²). The mean of the average values obtained in the four hemispheres was 4.0 mm (s.d. 0.2), and was significantly different from random (6.6 mm, s.d. 0.5, t-test p=5×10⁻⁵).
Figure 6
Figure 6
Responses to images of faces, body-parts, fruit/vegetables and places across IT. a, Activation maps showing regions more responsive to intact pictures (blue-cyan) than to scrambled versions (orange-red)(top), and maps showing regions more responsive to one class of pictures over all other intact pictures(bottom), from left to right: faces, body parts, fruit/vegetables, places. Supplementary Figure 6 shows results for individual comparisons. stg, superior temporal gyrus. b, Time course of response within color-biased regions (top), face patches (middle), and other visually responsive parts of IT (bottom). The face stimuli indicated by an “*” comprised familiar faces and were not included in the quantification. Time courses are the average of four hemispheres; shading indicates standard error. c, Quantification of the responses different image classes within the color-biased regions along IT, posterior (P), central (C), anterior (A) and anterior-ventral-medial (AM). d, Quantification of responses within face patches. e, Quantification of responses within other parts of IT. f–h, Quantification of the response to color within the color-biased regions, face patches and “other” regions along IT. Responses in f–h were computed as the % signal during color (colors 7&8) minus the % signal during the achromatic grating. Negative values indicate a luminance bias, while positive values indicate a color bias. Error bars s.e. (N=4 hemispheres). All quantification was performed on data sets obtained independently of the data used to generate the regions of interest.
Figure 7
Figure 7
Inferior temporal cortex contains multiple representations of the visual field, which correlate with responses to faces, non-face objects and places. a, Eccentricity mapping with location of face-patches (black contours) and color-biased regions (white contours) overlaid. Regions more responsive to a central flickering checkered disc (radius 3.5°) shown in blue-cyan; regions more responsive to stimulation with an annulus of flickering checkers (radius 3.5°–20°) shown in orange-red. b, Representative time courses for the eccentricity stimulus within V1, IT, the central representation within IT, the peripheral representation within IT, the face patches, the color-biased regions and the place-biased regions. c, Bar plots quantifying the responses to central and peripheral stimulation within the various regions of interest. Error bars s.e. (N= 4 hemispheres). d,e, Responses to objects (d) and colors (e) within regions of interest defined using the eccentricity mapping. Error bars s.e. (N= 4 hemispheres).
Figure 8
Figure 8
Projection of the anatomical designations described by Kravitz et al (2012) on the lateral surface of M1 on which has been painted the face-biased (orange-red) and color-biased activation (blue-cyan) patterns.

Similar articles

Cited by

References

    1. DiCarlo JJ, Zoccolan D, Rust NC. How does the brain solve visual object recognition? Neuron. 2012;73:415–434. - PMC - PubMed
    1. Tsao DY, FW, Knutsen TA, Mandeville JB, Tootell RBH. Faces and objects in macaque cerebral cortex. Nat Neurosci. 2003;6:989–995. - PMC - PubMed
    1. Pinsk MA, DeSimone K, Moore T, Gross CG, Kastner S. Representations of faces and body parts in macaque temporal cortex: a functional MRI study. Proc Natl Acad Sci U S A. 2005;102:6996–7001. - PMC - PubMed
    1. Ku SP, Tolias AS, Logothetis NK, Goense J. fMRI of the face-processing network in the ventral temporal lobe of awake and anesthetized macaques. Neuron. 2011;70:352–362. - PubMed
    1. Freiwald WA, Tsao DY. Functional compartmentalization and viewpoint generalization within the macaque face-processing system. Science. 2010;330:845–851. - PMC - PubMed

Publication types