. 2013 Nov;19(11):1496-504.
doi: 10.1038/nm.3363. Epub 2013 Oct 20.

Renal tubular Sirt1 attenuates diabetic albuminuria by epigenetically suppressing Claudin-1 overexpression in podocytes

Affiliations

Renal tubular Sirt1 attenuates diabetic albuminuria by epigenetically suppressing Claudin-1 overexpression in podocytes

Kazuhiro Hasegawa et al. Nat Med. 2013 Nov.

Abstract

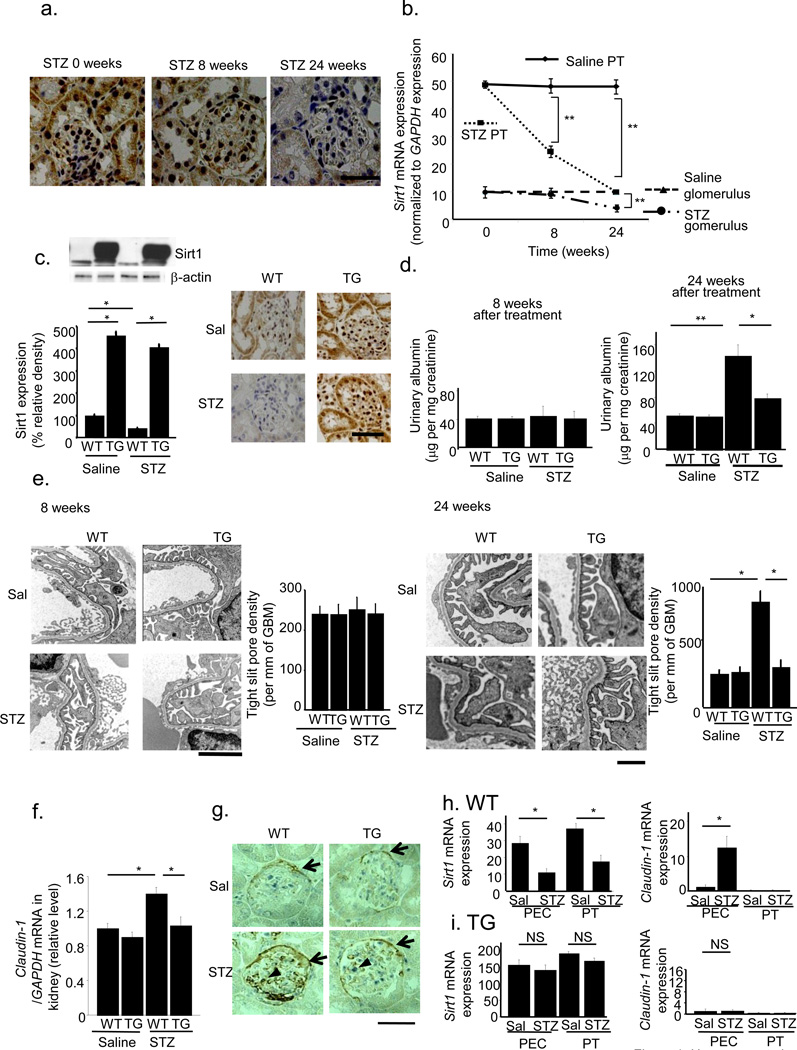
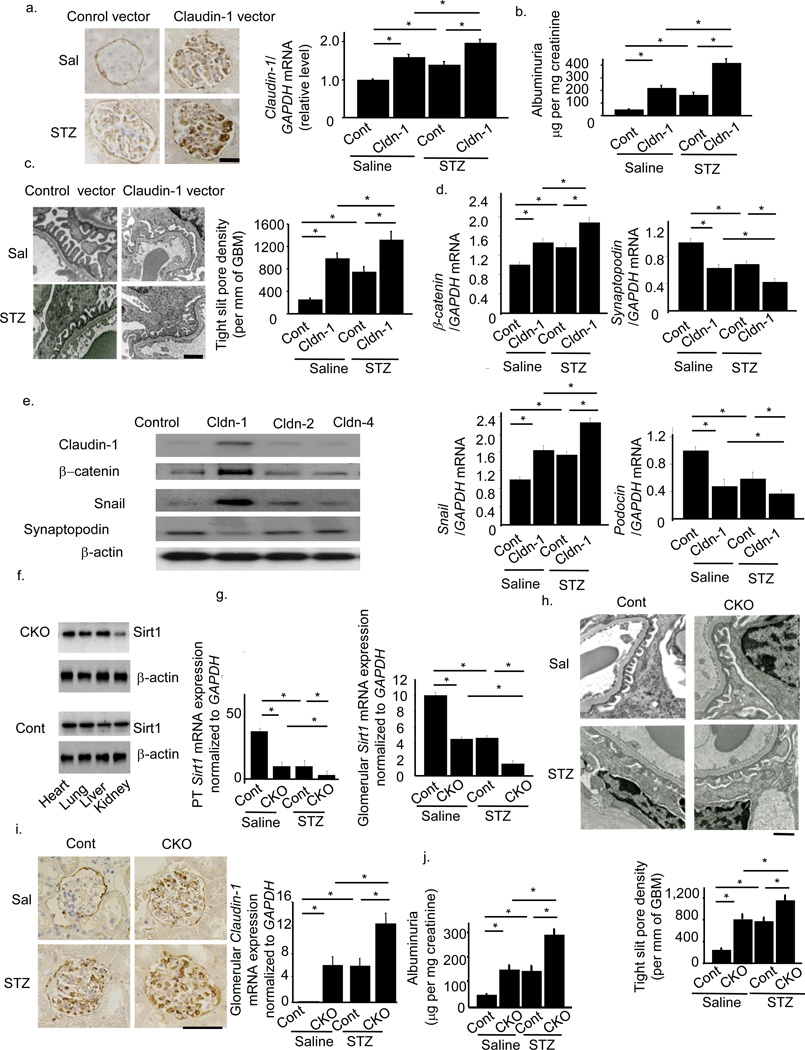
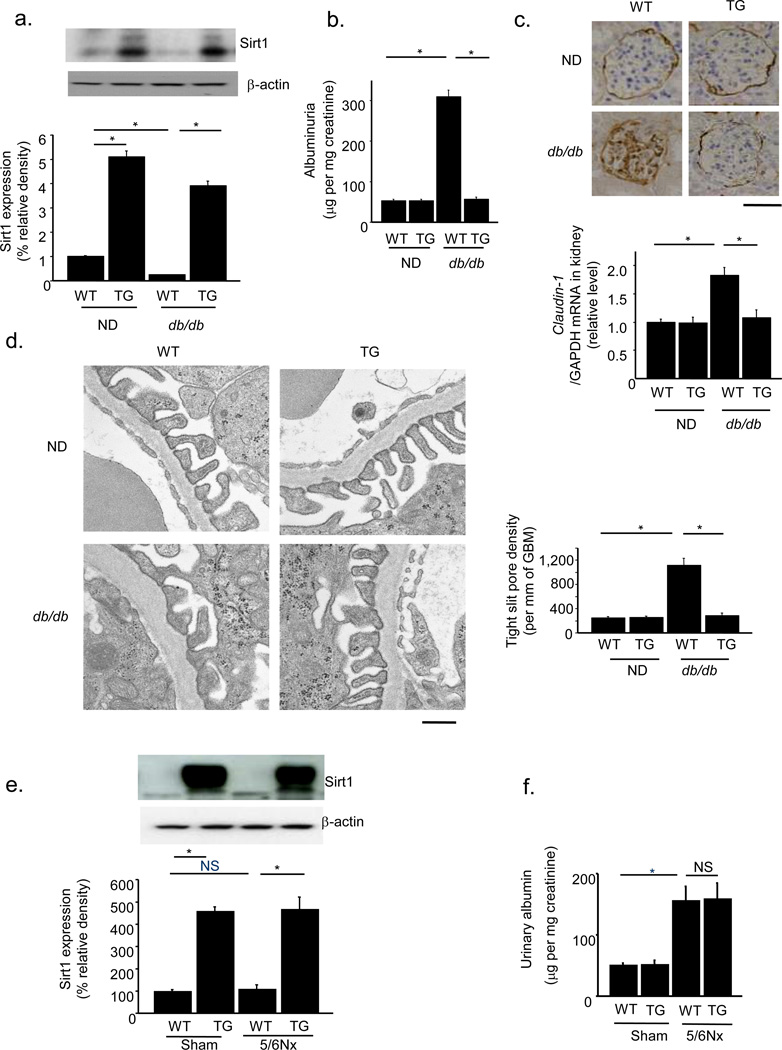
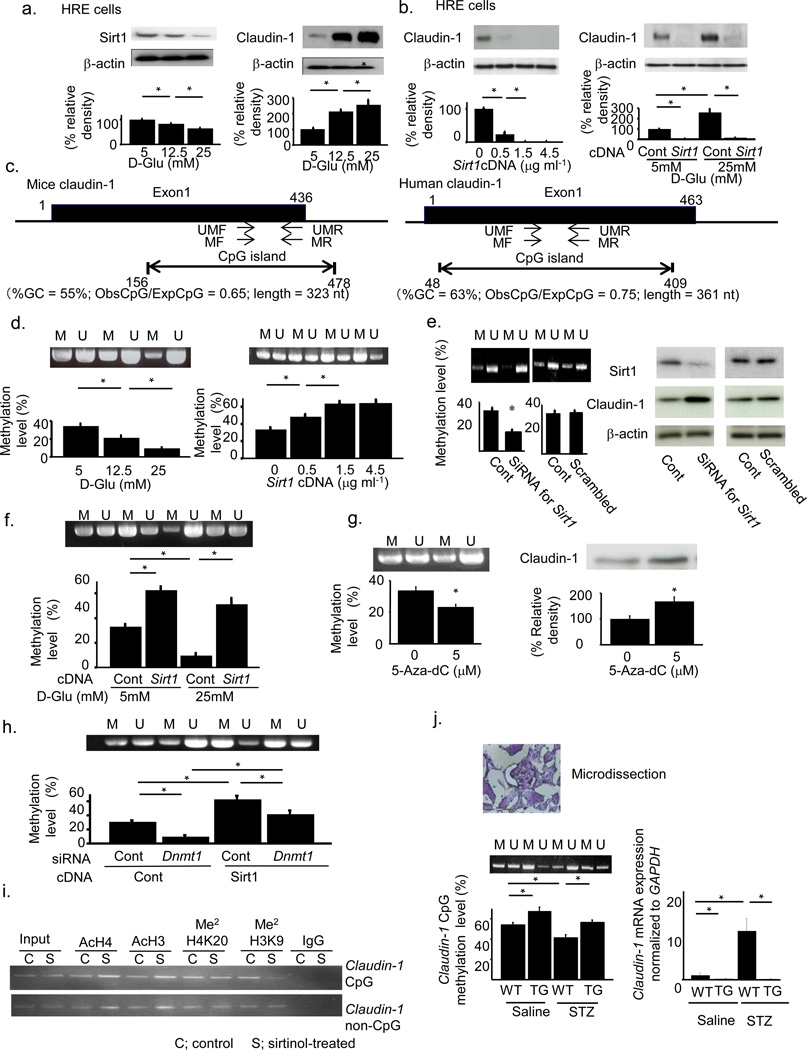
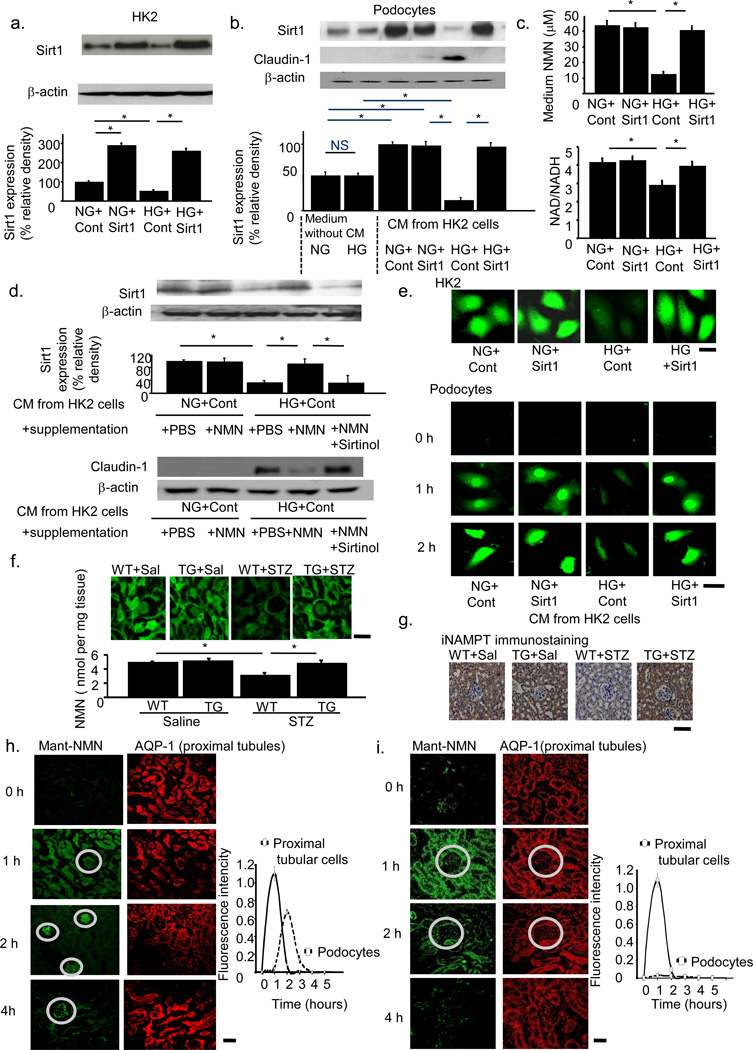
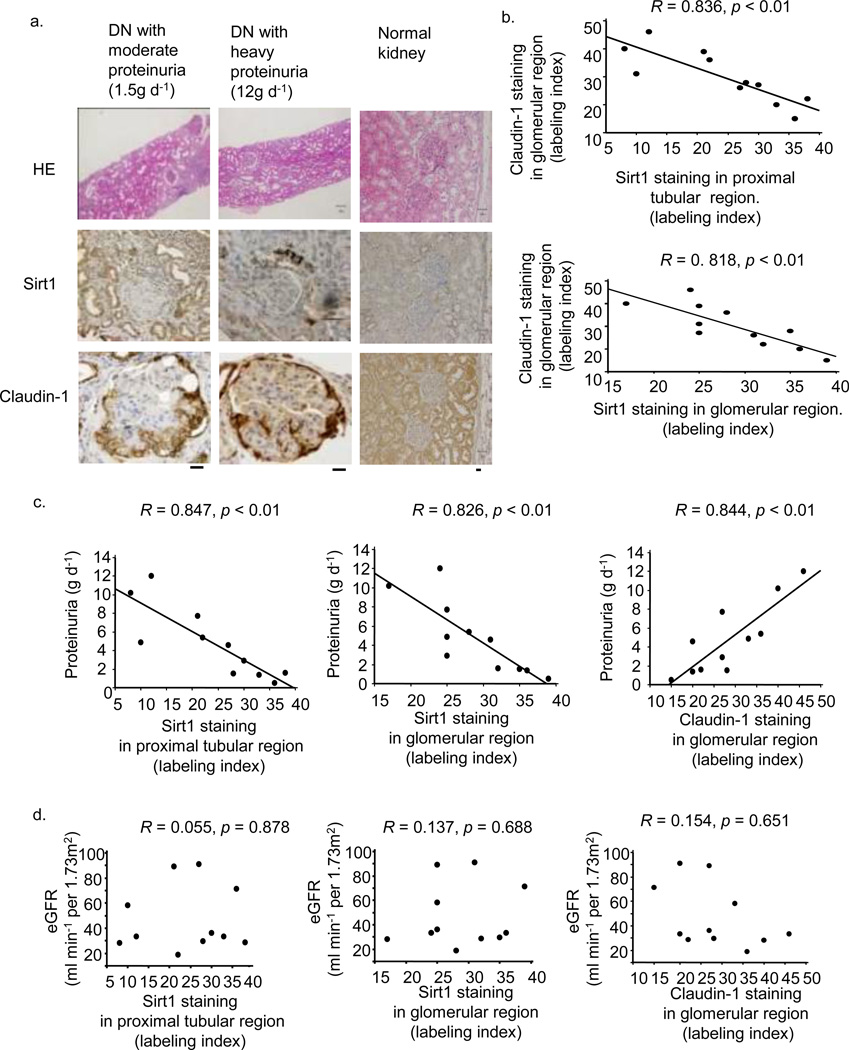
Sirtuin 1 (Sirt1), a NAD(+)-regulated deacetylase with numerous known positive effects on cellular and whole-body metabolism, is expressed in the renal cortex and medulla. It is known to have protective effects against age-related disease, including diabetes. Here we investigated the protective role of Sirt1 in diabetic renal damage. We found that Sirt1 in proximal tubules (PTs) was downregulated before albuminuria occurred in streptozotocin-induced or obese (db/db) diabetic mice. PT-specific SIRT1 transgenic and Sirt1 knockout mice showed prevention and aggravation of the glomerular changes that occur in diabetes, respectively, and nondiabetic knockout mice exhibited albuminuria, suggesting that Sirt1 in PTs affects glomerular function. Downregulation of Sirt1 and upregulation of the tight junction protein Claudin-1 by SIRT1-mediated epigenetic regulation in podocytes contributed to albuminuria. We did not observe these phenomena in 5/6 nephrectomized mice. We also demonstrated retrograde interplay from PTs to glomeruli using nicotinamide mononucleotide (NMN) from conditioned medium, measurement of the autofluorescence of photoactivatable NMN and injection of fluorescence-labeled NMN. In human subjects with diabetes, the levels of SIRT1 and Claudin-1 were correlated with proteinuria levels. These results suggest that Sirt1 in PTs protects against albuminuria in diabetes by maintaining NMN concentrations around glomeruli, thus influencing podocyte function.


Conflict of interest statement

COMPETING INTERESTS STATEMENT

The authors have declared that no conflict of interest exists.

Figures

Figure 1
Figure 1
Alleviation of albuminuria in diabetes-induced albuminuria in transgenic (TG) mice with proximal tubule (PT)-specific Sirt1 overexpression. (a,b) Temporal changes in Sirt1 expression 0, 8, and 24 weeks after streptozotocin (STZ) treatment in wild-type (WT) mice. (a) Immunostaining for Sirt1 in the kidney. The scale bar represents 50 µm. (b) Sirt1 mRNA expression levels normalized to that of GAPDH in PT and glomeruli of saline- or STZ-treated mice. (c) Immunoblotting (left) and immunostaining (right) for Sirt1 expression in the kidneys of TG and WT mice treated with saline (Sal) or STZ at 24 weeks after STZ treatment. Sirt1 band in TG mice consisted of a band for endogenous mouse Sirt1 (100 kDa) and one for FLAG-tagged overexpressed human Sirt1 (101 kDa). Band intensity was normalized to that for β-actin. Scale bar, 50 µm. (d) Urinary albumin excretions at 8 weeks (left) and 24 weeks (right) after STZ treatment. (e) Representative electron photomicrographs 8 weeks (left) and 24 weeks (right) after STZ treatment. Bar graphs represent the tight slit pore densities. Scale bar, 500 nm. (f) The mRNA levels for Claudin-1. (g) Immunostaining for Claudin-1. Arrows indicate stained PECs. Triangles indicate stained cells in the glomeruli. Bars, 50 µm. (h,i) The expression of Sirt1 (left) and Claudin-1 (right) mRNA in micro-dissected parietal epithelial cells (PECs) and proximal tubules (PT) of WT mice (h) and TG mice (i) treated with saline or STZ. **P < 0.01, *P < 0.05, n = 8.
Figure 2
Figure 2
Direct effects of Claudin-1 on podocytes, mice with streptozotocin-induced diabetes, and the phenotypes of proximal tubule (PT)-specific Sirt1 knockout mice. (a) Claudin-1 staining after intravenous injection of NPHS2-Claudin-1 (Cldn-1) or control vector (Cont) into saline (Sal)-treated or streptozotocin (STZ)-treated mice. The right panel shows mRNA expression for Claudin-1. Scale bar, 50 µm. (b) Albuminuria in Cont+Sal, Cldn-1+Sal, Cont+STZ and Cldn-1+STZ mice. (c) Electron photomicrographs of kidneys from mice in each experimental group. The bar graph shows tight slit pore densities. Scale bar, 500 nm. (d) Expression levels for Claudin-1, β-catenin, Snail, Synaptopodin, and Podocin mRNAs in micro-dissected glomeruli in all four groups of mice. (e) Immunoblotting analysis for the expression of Claudin-1, β–catenin, Snail, and Synaptopodin in cultured podocytes transfected with expression vectors for Claudin-1, Claudin-2, Claudin-4 or empty vector pcDNA3. (f) Production of PT-specific Sirt1−/− (conditional knockout, CKO) mice. Immunoblotting analysis for Sirt1 expression in the heart, lung, liver, and kidney of CKO and control (Cont) mice. (g) Expression of Sirt1 in PTs (left) and glomeruli (right) of CKO and Cont mice (h) Electron photomicrographs of a kidney in STZ-treated CKO and control mice. The bar graph shows quantification of tight slit pore densities. Scale bar, 500 nm. (i) Immunostaining for Claudin-1 in kidneys (left) and mRNA expression for Claudin-1 in micro-dissected glomeruli (right) from Cont+Sal, Cont+STZ, CKO+Sal and CKO+Sal mice. Scale bar, 50 µm. (j) Albuminuria in each experimental group. *P < 0.05, n = 8.
Figure 3
Figure 3
Proximal tubule-specific Sirt1 overexpression alleviates diabetic albuminuria in db/db mice but not in 5/6th nephrectomized (5/6Nx) mice. (a) Immunoblotting for Sirt1 in the kidneys of TG mice and wild-type littermates (WT) crossed with db/db or non-diabetic mice (ND). The lower panel shows the results of densitometry analysis of band intensity. (b) Albuminuria in WT-ND, TG-ND, WT-db/db and TG-db/db mice. (c) Immunostaining for Claudin-1 in kidneys from each experimental group. The lower panel shows mRNA expression for Claudin-1. Scale bar, 50 µm. (d) Electron photomicrographs of a kidney from each mice group (left). The bar graph (right) shows the tight slit pore densities. Scale bar, 500 nm. (e) Immunoblotting for Sirt1 in the kidneys of TG and WT mice after 5/6Nx or sham operation. The lower panel shows densitometry analysis of band intensity. (f) Albuminuria in TG and WT mice after 5/6Nx or sham operation. *P < 0.05, n = 8.
Figure 4
Figure 4
Epigenetic regulation of Claudin-1 gene expression by Sirt1. (a) Effects of glucose concentration on the expression of Sirt1 (left) and Claudin-1 (right). (b) Effects of Sirt1 overexpression (left) and combined effects of glucose and Sirt1 (right) on Claudin-1 expression. (c) CpG islands and positions of primers for methylated (MF and MR) and unmethylated (UMF and UMR) genes on the Claudin-1 gene of mice (left) and human (right). (d) Effects of glucose concentration (left) and Sirt1 overexpression (right) on Claudin-1 gene methylation. (e) Effects of transfection with siRNA for Sirt1 on Claudin-1 gene methylation (left) and Claudin-1 protein expression (right). (f) Combined effects of glucose and Sirt1 on Claudin-1 gene methylation. (g) Methylation of Claudin-1 gene (left) and the level of Claudin-1 protein (right) after treatment with the DNA methyltransferase (Dnmt) inhibitor 5-aza-dC. (h) Methylation of the Claudin-1 gene with or without transfection with Sirt1 expression vectors or Dnmt1 siRNA. (i) ChIP assays using HRE cells cultured with sirtinol (S, 20 mM) or vehicle (C). Antibodies against acetylated histone 4 (AcH4), acetylated histone 3 (AcH3), dimethylated H4K20 (Me2H4K20), and dimethylated H3K9 (Me2H3K9) were used. (j) Claudin-1 CpG methylation in the kidneys of TG mice treated with or without streptozotocin (STZ). Left; Methylation-specific PCR and real-time methylation-specific PCR using micro-dissected PECs. Right; Claudin-1 mRNA expression in PECs. (d,e,f,g,h,j) M indicates methylated DNA and U unmethylated DNA. *P < 0.05, n = 5.
Figure 5
Figure 5
Evidence for the retrograde interplay from tubular cells to podocytes. (a) HK-2 cells were cultured under the four conditions of NG (normal glucose)+Cont (control vector), NG+Sirt1 (Sirt1 expression vector), HG (high glucose)+Cont and HG+Sirt1. Immunoblotting for Sirt1 (upper) and densitometry analysis (lower). (b) Sirt1 (upper) and Claudin-1 (lower) expression in podocytes cultured in conditioned medium (CM) from each of the above four experimental conditions or in NG or HG conditions without CM. (c) NMN concentrations (upper) and NAD/NADH ratio (lower) of each CM. (d) Sirt1 (upper) and Claudin-1 (lower) expression in podocytes cultured in each CM supplemented with NMN, phosphate-buffered saline (PBS), or sirtinol. (e) Intracellular autofluorescence of NMN in HK-2 cells (upper) and podocytes (lower) at 0, 1, and 2 h after CM transfer. CM were from the four conditions of HK-2 cell culture media. Scale bar, 20 µm. (f,g) Tissue NMN concentrations (f) and iNAMPT immunostaining (g) of kidneys from proximal tubule-specific Sirt1 transgenic (TG) mice and wild-type littermates (WT) mice 24 weeks after treatment with saline (Sal) or streptozotocin (STZ). Scale bar, 50 µm. (h,i) Representative confocal images for Mant fluorescence in normal (h) and PT-specific Sirt1-deficient mice (i). Mant-NMN (green, left) was detected at 0, 1, 2, 4 h after injection. Sequential sections were stained with anti-AQP-1 antibody (h,i; right). Glomeruli are indicated in circles. Temporal profiles of the mean Mant-NMN intensity in tubular and podocyte regions are shown in the graph, n = 5. *P < 0.05, n = 5. Scale bar, 50 µm.
Figure 6
Figure 6
Glomerular Sirt1 or Claudin-1 immunostaining in human renal biopsy specimens. (a) Representative photomicrograph of HE staining or immunostaining for Sirt1 and Claudin-1 in needle renal biopsy specimens of subjects with diabetic nephropathy (DN) (sample names: DN-3 and 6, Supplementary Table 3) and a control (sample name: CO-1). Bars; 50 nm. (b) The relationship between immunostaining for Claudin-1 and that for Sirt1 in the proximal tubular region (upper) and glomerular region (lower) in renal biopsy specimens from subjects with DN, n = 11. (c) The relationships between proteinuria and immunostaining for proximal tubular Sirt1 (left), glomerular Sirt1 (middle), and Claudin-1 (right), n = 11. (d) The relationships between eGFR and immunostaining for proximal tubular Sirt1 (left), glomerular Sirt1 (middle) and Claudin-1 (right), n = 11.

Comment in

References

    1. Roxburgh SA, et al. Allelic depletion of grem1 attenuates diabetic kidney disease. Diabetes. 2009;58:1641–1650. - PMC - PubMed
    1. Rodgers JT, et al. Nutrient control of glucose homeostasis through a complex of PGC-1alpha and SIRT1. Nature. 2005;434:113–118. - PubMed
    1. Bordone L, Guarente L. Calorie restriction, SIRT1 and metabolism: understanding longevity. Nature Rev. Mol. Cell Bio. 2005;6:298–305. - PubMed
    1. Purushotham A, et al. Hepatocyte-specific deletion of SIRT1 alters fatty acid metabolism and results in hepatic steatosis and inflammation. Cell Metab. 2009;9:327–338. - PMC - PubMed
    1. Wang RH, et al. Hepatic Sirt1 deficiency in mice impairs mTorc2/Akt signaling and results in hyperglycemia, oxidative damage, and insulin resistance. J. Clin. Invest. 2011;121:4477–4490. - PMC - PubMed

Publication types

MeSH terms