. 2014 Aug 7;33(32):4144-55.
doi: 10.1038/onc.2013.457. Epub 2013 Oct 21.

FOXM1 targets NBS1 to regulate DNA damage-induced senescence and epirubicin resistance

Affiliations

FOXM1 targets NBS1 to regulate DNA damage-induced senescence and epirubicin resistance

P Khongkow et al. Oncogene. .

Abstract

FOXM1 is implicated in genotoxic drug resistance but its mechanism of action remains elusive. We show here that FOXM1-depletion can sensitize breast cancer cells and mouse embryonic fibroblasts (MEFs) into entering epirubicin-induced senescence, with the loss of long-term cell proliferation ability, the accumulation of γH2AX foci, and the induction of senescence-associated β-galactosidase activity and cell morphology. Conversely, reconstitution of FOXM1 in FOXM1-deficient MEFs alleviates the accumulation of senescence-associated γH2AX foci. We also demonstrate that FOXM1 regulates NBS1 at the transcriptional level through an forkhead response element on its promoter. Like FOXM1, NBS1 is overexpressed in the epirubicin-resistant MCF-7Epi(R) cells and its expression level is low but inducible by epirubicin in MCF-7 cells. Consistently, overexpression of FOXM1 augmented and FOXM1 depletion reduced NBS1 expression and epirubicin-induced ataxia-telangiectasia mutated (ATM)phosphorylation in breast cancer cells. Together these findings suggest that FOXM1 increases NBS1 expression and ATM phosphorylation, possibly through increasing the levels of the MRN(MRE11/RAD50/NBS1) complex. Consistent with this idea, the loss of P-ATM induction by epirubicin in the NBS1-deficient NBS1-LBI fibroblasts can be rescued by NBS1 reconstitution. Resembling FOXM1, NBS1 depletion also rendered MCF-7 and MCF-7Epi(R) cells more sensitive to epirubicin-induced cellular senescence. In agreement, the DNA repair-defective and senescence phenotypes in FOXM1-deficent cells can be effectively rescued by overexpression of NBS1. Moreover, overexpression of NBS1 and FOXM1 similarly enhanced and their depletion downregulated homologous recombination (HR) DNA repair activity. Crucially, overexpression of FOXM1 failed to augment HR activity in the background of NBS1 depletion, demonstrating that NBS1 is indispensable for the HR function of FOXM1. The physiological relevance of the regulation of NBS1 expression by FOXM1 is further underscored by the strong and significant correlation between nuclear FOXM1 and total NBS1 expression in breast cancer patient samples, further suggesting that NBS1 as a key FOXM1 target gene involved in DNA damage response, genotoxic drug resistance and DNA damage-induced senescence.


Figures
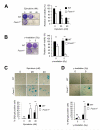
Figure 1
Figure 1. FOXM1 deletion inhibits colony formation and induces cellular senescence in response to DNA damage in MEFs
(A) Clonogenic assays were performed to assess the colony formation efficiency of Foxm1–/– and WT MEFs. A total of 2,000 cells were seeded in six well plates, treated with 0, 20 and 40 nM of epirubicin and grown for 15 days. The cells were then stained with crystal violet (left panel). The result (right panel) represents average of three independent experiments ± SD. Statistical significance was determined by Student’s t-test (**P ≤ 0.01). B) Clonogenic assay of Foxm1–/– and WT MEFs were either non-radiated or exposed to 5 Gy of γ-irradiation. (C) SA-β-gal staining of Foxm1–/– and WT MEFs treated with 0, 20 and 40 nM of epirubicin. 15 days after treatment, cells were stained for SA-β-galactosidase activities. (D) SA-β-gal staining of Foxm1–/– and WT MEFs treated with γirradiation (0 and 5 Gy). The graphs (C) and (D) show the percentage of SA-β-galactpsidase-positive cells as measured from five different fields from two independent experiments. Bars represent average ± SD. Statistical significance was determined by Student’s t-test (**P ≤ 0.01, significant; ns, non-significant).
Figure 2
Figure 2. Knockdown of FOXM1 suppresses growth and induces senescence in MCF-7 and MCF-7EpiR cells
(A) MCF-7 and (B) MCF-7EpiR were transfected with NS (non-targeting) siRNA or FOXM1 siRNA. Twenty-four hours after transfection, cells were seeded in six well plates, treated with epirubicin, grown for 15 days and then stained with crystal violet (left panel). The results (right panel) represent average of three independent experiments ± SD. Statistical significance was determined by Student’s t-test (*P≤0.05, **P ≤ 0.01, ***P≤0.005; ns, non-significant). In parallel, (C) MCF-7 and (D) MCF-7EpiR transfected with NS siRNA or siFOXM1 were seeded in six well plates, treated with epirubicin. Five days after treatment, cells were stained for SA-β-galactosidase activity. The graphs (C) and (D) show the percentage of SA-β-galactpsidase-positive cells as measured from five different fields from two independent experiments. Bars represent average ± SD. Statistical significance was determined by Student’s t-test (*P≤0.05, **P ≤ 0.01, ***P≤0.005, significant; ns, non-significant).
Figure 3
Figure 3. FOXM1 depletion in MCF-7 cells causes the accumulation of significantly higher numbers of γH2AX foci in response to γ-irradiation
(A) MCF-7 and (B) MCF-7EpiR were transfected with NS siRNA or FOXM1 siRNA. Twenty-four hours after transfection, cells cultured on chamber slides were either non-radiated or exposed to 5 Gy of γ-irradiation for 24, 48 and 72 h. Cells were then fixed and immunostained for γH2AX foci (green). Nuclei were counterstained with DAPI (blue). Images were acquired with Leica TCS SP5 (63 × magnification). For each time point, images of at least 100 cells were captured and used for quantification of γH2AX foci number. Results represent average of three independent experiments ± S.D. Statistical analyses were conducted using Student’s t-tests against the correspondent time point (**P ≤ 0.01, significant; ns, non-significant).
Figure 4
Figure 4. FOXM1 regulates NBS1 expression and ATM activity in MCF-7 and MCF7-EpiR cells
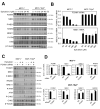
(A) MCF-7 and MCF7-EpiR cells were treated with 1μM epirubicin for 0, 4, 8, 16, 24 and 48 h. Following treatment, the expression levels of FOXM1, NBS1, P-NBS1, RAD50, MRE11, P-ATM, ATM and β-Tubulin were determined by Western blotting. (B) Real time-quantitative PCR (qRT-PCR) was used to determine FOXM1 and NBS1 mRNA transcript levels (normalised against L19 mRNA levels). Bars represent the mean + SD of three independent experiments. (C) and (D) MCF-7 and MCF7EpiR cells were transfected with either NS siRNA or FOXM1 siRNA. Twenty-four after transfection, the cells were either untreated or treated with 1 μM epirubicin for 24 h. (C) The protein expression was determined by Western blot analysis using antibodies against FOXM1, NBS1, P-NBS1, RAD50, MRE11, P-ATM, ATM, P-CHK2 ,CHK2 and β-Tubulin. (D) FOXM1, NBS1, MRE11 and RAD50 transcripts were next analysed by qRT-PCR in the untreated cells (all gene transcripts were normalised against L19). Statistical significance was determined by Student’s t test (**P ≤ 0.01, ***P≤0.005, significant; ns, non-significant).
Figure 5
Figure 5. NBS1 and P-ATM expression is downregulated in FOXM1-deficient MEFs
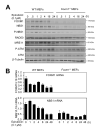
(A) WT and Foxm1–/– MEFs were treated with 0.1 μM epirubicin for 0, 0.5, 1, 2, 4, 16 and 24 h. The harvested cells were subjected to western blot analysis, and the protein expression levels of FOXM1, NBS1, P-NBS1, RAD50, MRE11, P-ATM, ATM and β-Tubulin determined. (B) WT and Foxm1–/– MEFs were exposed to 0.1 μM of epirubicin for 0, 1, 2, 4, 8, 24 and 48 h and the mRNA transcript levels of FOXM1 and NBS1 determined by qRT-PCR after normalizing against L19 the house keeping gene. Bars represent average ± SD. Statistical significance was determined by Student’s t-test.
Figure 6
Figure 6. FOXM1 regulates ATM phosphorylation and NBS1 expression through a FHRE site within its promoter
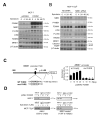
(A) MCF-7 cells were transfected with pcDNA3 empty vector or pcDNA3-FOXM1 plasmids following which the cells were subjected to 1 μM epirubicin treatment for 0, 6 24 and 48 h. Western blots were performed to analyse the protein expression level changes of FOXM1, NBS1, P-ATM, ATM, RAD50, MRE11 and β-Tubulin. (B) MCF7-EpiR cells were transfected with NS siRNA or NBS1 siRNA. Twenty-four hours after the transfection, cells were treated with 1 μM epirubicin for 0, 4, 24 and 48 h and harvested for western blots. Protein expression levels of the indicated proteins: NBS1, PNBS1, FOXM1, ATM, P-ATM, RAD50, MRE11, PARP and β-Tubulin were analysed (arrow indicates cleaved PARP proteins). (C) MCF-7 cells were transciently transfected with 20 ng of pGL3-NBS1 WT or pGL3-NBS1 mutant promoter together with the control Renilla plasmid and increasing amounts (0, 10, 15 and 20 ng) of FOXM1 expression vector. After 24 h, cells were assayed for luciferase activity. The relative luciferase activity was calculated after normalising with the control Renilla activity. (D) MCF-7 either untransfected or transfected with pcDNA3-FOXM1, and MCF7-EpiR either untreated or treated with 1 μM epirubicin for 16 h were used for chromatin immunoprecipitation (ChIP) assays using the IgG negative control and anti-FOXM1 antibody, as indicated. After reversal of cross-linking, the coimmunoprecipitated DNA was amplified by PCR, using primers amplifying the FOXM1 FHRE-binding site containing region (−300/−24bp) and a control region (−1097/−826pb), and resolved in 2% agarose gel. Inverted ethidium bromide stained images are shown.
Figure 7
Figure 7. Correlation between NBS1 and FOXM1 expression in breast cancer samples
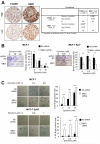
(A) Correlation of FOXM1 and NBS1 expression were assessed and scored by immunohistochemistry in breast cancer samples from 116 patients. FOXM1 and NBS1 staining were detected in both nuclear and cytoplasmic compartments. Statistical analysis of the expression patterns revealed that there was a strong and significant correlation between FOXM1 nuclear staining and total NBS1 staining (Pearson coefficient=0.318, p=0.002). (B) NBS1 depletion induces senescence associated-phenotypes in MCF-7 breast cancer cells. MCF-7 and MCF-7 EpiR were transfected with NS siRNA or NBS1 siRNA. 24 hours after transfection, 2,000 cells were seeded in six well plates, treated with epirubicin, grown for 15 days and then stained with crystal violet (left panel). The result (right panel) represents average of three independent experiments ± SD. Statistical significance was determined by Student’s t-test (**P ≤ 0.01, significant; ns, non-significant). In parallel, (C) MCF-7 and MCF-7 EpiR transfected with NS siRNA or siNBS1 were seeded in six well plates, treated with epirubicin for 5 days. Cells were stained for SA-β-galactosidase activities. The graphs show the percentage of SA-β-galactpsidase-positive cells as measured from five different fields from two independent experiments. Bars represent average ± SD. Statistical significance was determined by Student’s t-test (***P≤0.005, significant).
Figure 8
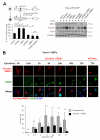
Figure 8. NBS1 and FOXM1 are required for homologous recombination repair
(A) HR repair was assayed in HeLa cells harbouring a DR-GFP reporter system. Cells were either transfected with control pcDNA3, pcDNA3-FOXM1 or pFlag-NBS1 or with NS siRNA, FOXM1 siRNA or NBS1 siRNA, or with co-transfection control, pFlag-NBS1 plus FOXM1 siRNA. 48 h after transfection, the cells were transfected with I-Scel plasmid. Cleavage of an I-Scel and repair by HR leads to GFP expression in cells. The percentage of GFP positive cells was determined by FACS analysis at Day 3 posttransection. Bars are average ± SD. of three independent experiments. In parallel, cells were also harvested for Western blot analysis. (B) Ectopic expression of NBS1 in Foxm1–/– MEFs reduces the accumulation of γH2AX foci. Foxm1–/– MEFs were either transfected with pmCherry control plasmids or cotransfected with pmCherry and NBS1 plasmids (Red) and treated with 0.1 μM of epirubicin for 0, 4, 24, 48 and 72 h. The cells were then immunostained for γH2AX foci (Green) and nuclei were counterstained with DAPI (blue) to determine DNA double-strand breaks. γH2AX foci quantification is shown. Bars represent the average of γH2AX foci per cell from three independent experiments ± SD. Statistical significance was determined by Student’s t-test (*P≤0.05, **P ≤ 0.01, ***P≤0.005, significant; ns, non-significant).

References

    1. Stearns V, Davidson NE, Flockhart DA. Pharmacogenetics in the treatment of breast cancer. Pharmacogenomics J. 2004;4(3):143–53. - PubMed
    1. Seviour EG, Lin SY. The DNA damage response: Balancing the scale between cancer and ageing. Aging. 2010 Dec;2(12):900–7. - PMC - PubMed
    1. Helleday T, Lo J, van Gent DC, Engelward BP. DNA double-strand break repair: from mechanistic understanding to cancer treatment. DNA Repair. 2007 Jul 1;6(7):923–35. - PubMed
    1. So S, Davis AJ, Chen DJ. Autophosphorylation at serine 1981 stabilizes ATM at DNA damage sites. J Cell Biol. 2009 Dec 28;187(7):977–90. - PMC - PubMed
    1. Riches LC, Lynch AM, Gooderham NJ. Early events in the mammalian response to DNA double-strand breaks. Mutagenesis. 2008 Sep;23(5):331–9. - PubMed

Publication types

MeSH terms