. 2013 Nov;15(11):1307-16.
doi: 10.1038/ncb2859. Epub 2013 Oct 20.

An excitable signal integrator couples to an idling cytoskeletal oscillator to drive cell migration

Affiliations

An excitable signal integrator couples to an idling cytoskeletal oscillator to drive cell migration

Chuan-Hsiang Huang et al. Nat Cell Biol. 2013 Nov.

Abstract

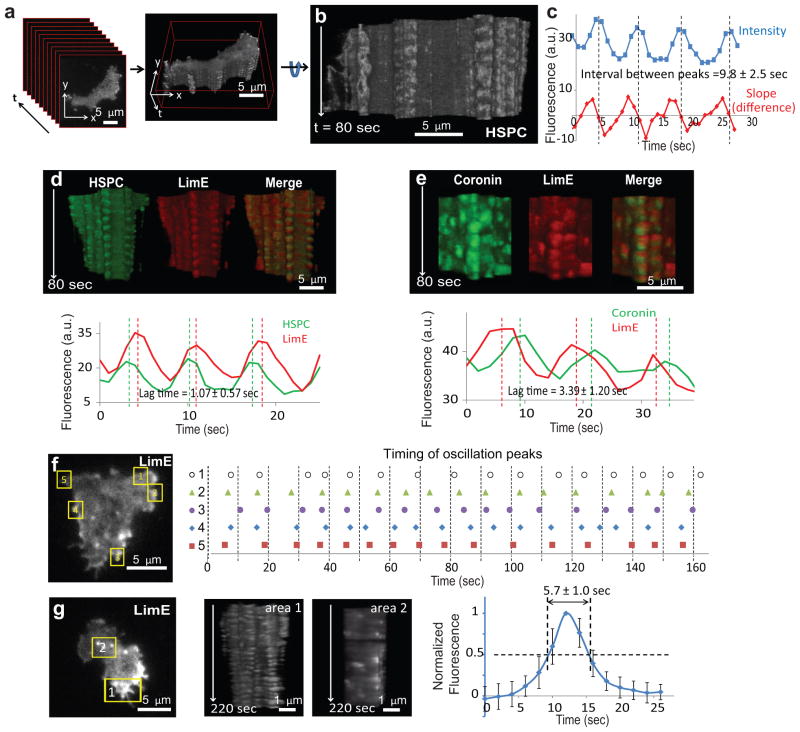
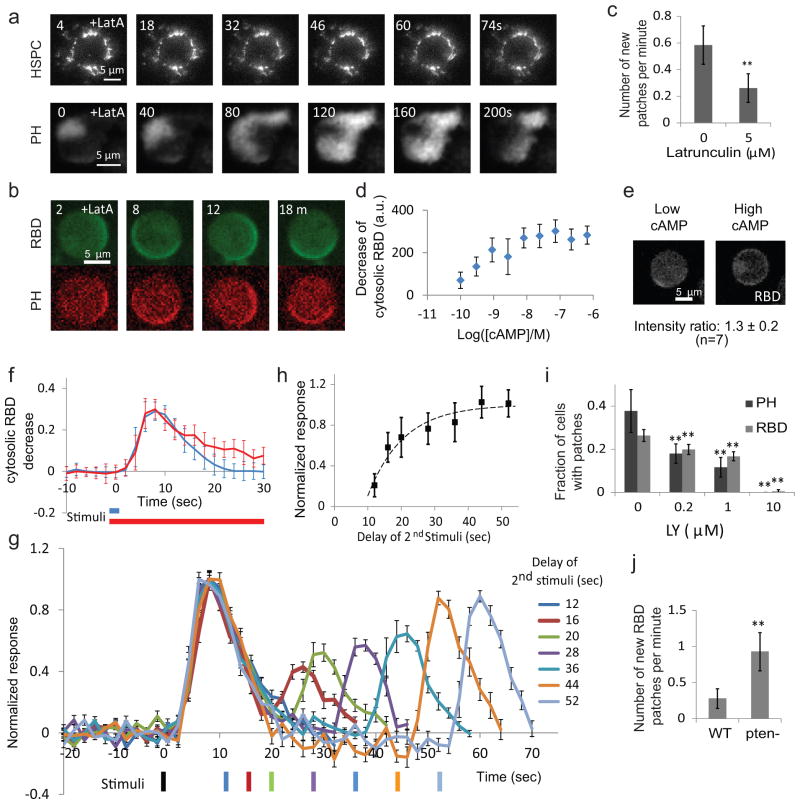
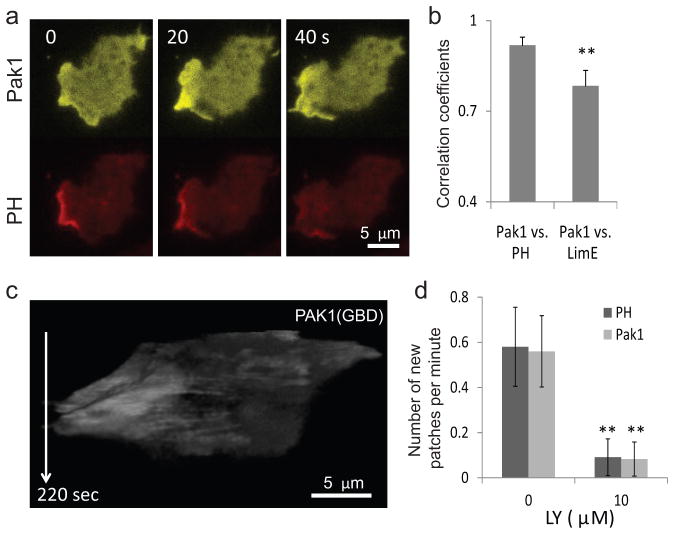
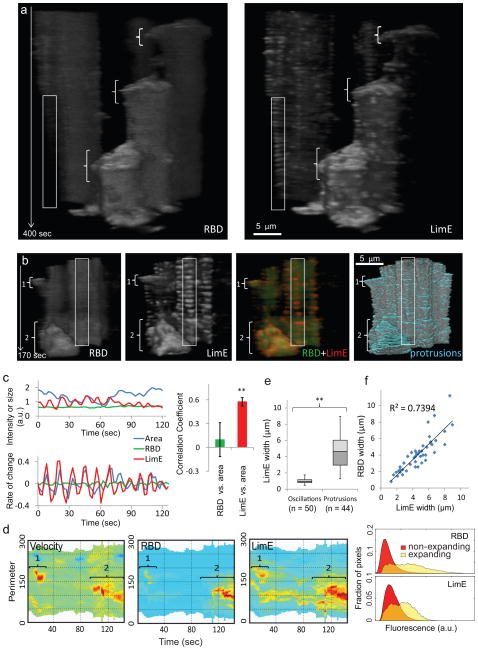
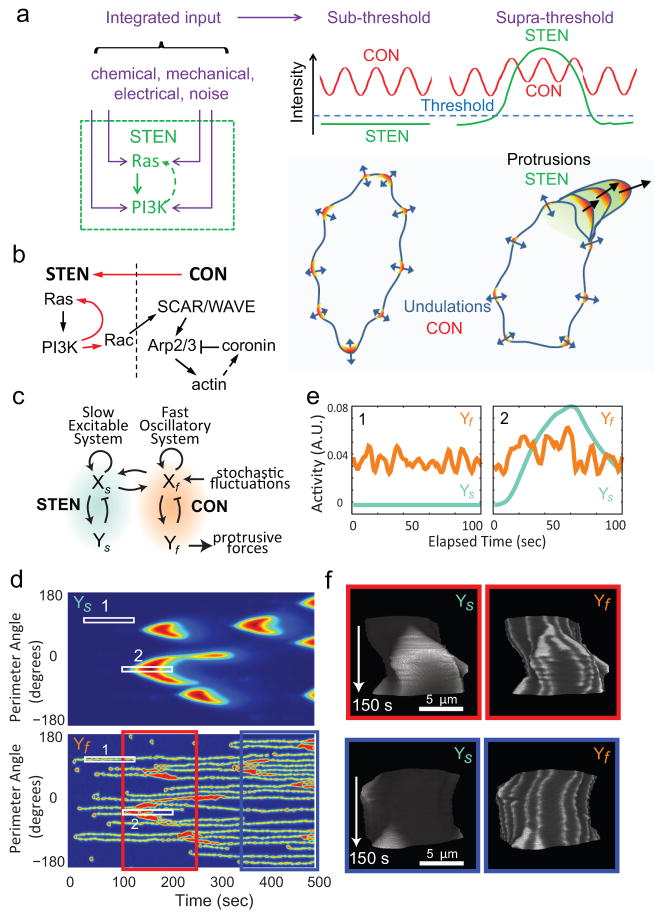
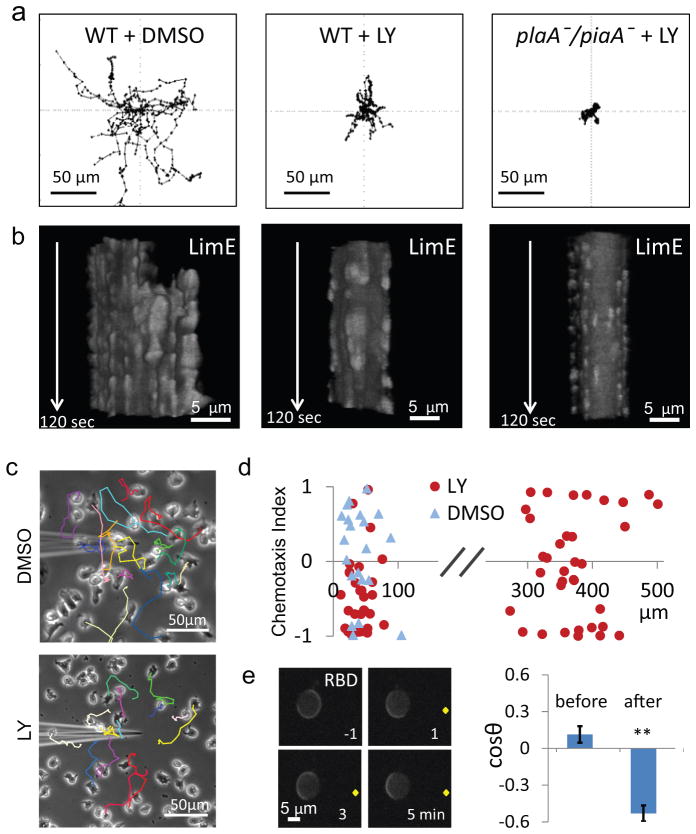
It is generally believed that cytoskeletal activities drive random cell migration, whereas signal transduction events initiated by receptors regulate the cytoskeleton to guide cells. However, we find that the cytoskeletal network, involving SCAR/WAVE, Arp 2/3 and actin-binding proteins, is capable of generating only rapid oscillations and undulations of the cell boundary. The signal transduction network, comprising multiple pathways that include Ras GTPases, PI(3)K and Rac GTPases, is required to generate the sustained protrusions of migrating cells. The signal transduction network is excitable, exhibiting wave propagation, refractoriness and maximal response to suprathreshold stimuli, even in the absence of the cytoskeleton. We suggest that cell motility results from coupling of 'pacemaker' signal transduction and 'idling motor' cytoskeletal networks, and various guidance cues that modulate the threshold for triggering signal transduction events are integrated to control the mode and direction of migration.


Conflict of interest statement

COMPETING FINANCIAL INTERESTS

The authors declare no competing financial interests.

Figures

Figure 1
Figure 1. Fast oscillations of the cytoskeletal activities revealed by t-stacking
(a, b) A t-stack generated by stacking frames of a TIRF video of a cell expressing HSPC300-GFP (Supplementary Video S1). Supplementary Video S2 shows rotation of the t-stack along its t-axis. (c) Intensity plot (blue) and plot of difference between successive points (red) of an oscillatory region. Peaks of the intensity plot were interpolated from the zero points of the difference plot (dotted lines). The mean ± S.D. of intervals between peaks (n=178 cycles from 16 cells) is shown. (d) T-stacks from a cell co-expressing HSPC300-GFP and LimE-RFP (top), and the corresponding intensity plots along an oscillatory region on the periphery (bottom). Dotted lines mark the interpolated peaks. The mean ± S.D. of lags between the peaks of HSPC300 and LimE intensity (n=117 cycles from 16 cells) is shown. Frame rate: 1 spf. (e) T-stacks from a cell co-expressing coronin-GFP and LimE-RFP (top), and the corresponding intensity plots along an oscillatory region on the periphery (bottom). Dotted lines mark the interpolated peaks. The mean ± S.D. of lags between the peaks of coronin and LimE intensity (n=256 cycles from 14 cells) is shown. Frame rate: 2 spf. (f) Timing of peaks of LimE intensity in five oscillatory regions (1–5) within the same cell. (g) T-stacks of a peripheral region (area 1) and an internal region (area 2) from a cell expressing LimE. The temporal profile of the internal flashes and the half-maximum width (mean ± S.D. over n=70 flashes in 14 cells) is shown on the right.
Figure 2
Figure 2. The slow, excitable signaling network
(a) Frames from time-lapse TIRF videos of HPSC300-GFP in a cell in 1 μM latrunculin (upper), and PH-GFP in a cell in 5 μM latrunculin (lower). (b) Frames from a time-lapse video of a latrunculin-treated cell co-expressing RBD-GFP and PH-RFP observed by confocal microscopy. (c) The effect of latrunculin on the frequency of new PH-GFP patches (mean ± S.D., n=18 and 28, ** p<0.001, t-test). (d) Decrease of cytosolic RBD fluorescence (mean ± S.D. for n=13, 16, 16, 20, 15, 15, 15, 15, 7 cells from lowest to highest cAMP concentrations). (e) Example of partial membrane recruitment of RBD-GFP upon low dose (left) and global recruitment upon high dose cAMP stimuli (right). The intensity ratio of patch to global recruitment is shown (mean ± S.D. for 7 cells). (f) Comparison between responses to 2-second (blue) or 20-second (red) stimuli. Responses (mean ± S.D. for n=27 and 30 cells, respectively) of the cytosolic RBD-GFP decrease were normalized to pre-stimulus level. (g) Responses to two 2-second cAMP stimuli separated by increasing durations. Black bar: first stimulus. The other bars are color-coded to show the delay. All values (mean ± S.E., n=10, 10, 7, 10, 8, 9, 10 for 12, 16, 20, 28, 36, 44, 52 seconds, respectively ) were normalized to the peak of the first response. (h) The peak magnitude (mean ± S.D., n as in (g) for each time point) of the 2nd response plotted against the interval between stimuli. The absolute refractory period (8.8 ± 1.1 seconds) and recovery half-life (7.38 ± 1.74 seconds) were calculated as described in Methods. (i) Fraction of cells with spontaneous PH and RBD patches in 5 μM latrunculin and increasing concentrations of LY294002 (mean ± S.D., n=10, 10, 12, 15 cells for PH and 40, 40, 50, 80 cells for RBD for 0, 0.2, 1, and 10 μM LY294002, respectively. ** p<0.001, one-way ANOVA). (j) Frequencies of new RBD patches in wild-type and pten- cells in 5 μM latrunculin (n=10 cells each; ** p<0.001, t-test). (b)-(j) were obtained by confocal microscopy.
Figure 3
Figure 3. Rac activity correlates with the dynamics of the signaling network
(a) Frames from a time-lapse TIRF video of a cell co-expressing PAK1(GBD)-YFP and PH-RFP. (b) Correlation between pairs of biosensors expressed in the same cells (left: WT cells co-expressing Pak1(GBD)-YFP and PH-RFP; right: WT cells co-expressing PAK1(GBD)-YFP and LimE-RFP; n=10 each, gray bars: mean, error bars: S.D., **p<0.001, t-test). (c) T-stack of a cell expressing the Rac biosensor PAK1(GBD)-YFP showing the absence of fast oscillations. (d) Effect of LY treatment on the frequency of new patches in cells expressing PAK1(GBD)-YFP and PH-RFP observed by confocal microscopy (n=10 cells each; ** p<0.001, t-test).
Figure 4
Figure 4. Coupling of signal transduction and cytoskeletal networks in protrusions
(a) T-stacks from two cells co-expressing RBD-GFP (left) and LimE-RFP (right). In each panel, cell at right extends three large protrusions (brackets) but cell at left does not extend protrusions during the imaging period. Boxed area on non-extending cell at left shows oscillations in LimE-RFP without apparent oscillations in RBD-GFP. (b) T-stacks from another cell co-expressing RBD-GFP and LimE-RFP and used for quantitative analysis. The brackets point to two protrusions (the smaller labeled 1, the larger labeled 2) with high RBD and LimE, which appear yellow in the merged t-stack (third panel). The “protrusion” t-stack shows regions of cell boundary increases in blue (fourth panel). In contrast, fast LimE oscillations accompanying cell boundary undulations appear red (box in third panel). Note that weak oscillations in the RBD t-stacks in (a) and (b) reflect changes in the boundary which delineates cytosolic RBD rather than RBD intensity on the cortex. (c) Intensities of RBD-GFP and LimE-RFP plotted along with the cellular area in a region with LimE oscillation (left upper), as well as the rate of change calculated from difference between values in successive frames (left lower). Rate of change of LimE-RFP shows significantly higher correlation with that of cellular area compared with RBD-GFP (right; n=6 regions from 2 cells, error bars: S.D., ** p<0.001, t-test). (d) Kymographs of velocity, RBD, and LimE around the boundary of the cell in (b) with fast oscillations/undulations filtered out (see Methods). Brackets numbered 1 and 2 correspond to the protrusions in (b). The histogram on right shows the right-shifted intensity distribution of pixels in expanding regions relative to that of non-expanding regions. Similar analyses carried out in 6 cells yielded a mean ± S.D. right shift of 1.44 ± 0.16 (p=0.00075) for RBD and 1.98 ± 0.41 (p=0.0015, t-test) for LimE. (e) Box plot comparison of widths of LimE fluorescence in oscillatory regions and expanding protrusions. The mean ± S.D. for oscillatory and expanding regions were 0.98 ± 0.30 μm (n=50) and 4.69 ± 1.92 μm (n=44) (p<0.001, t-test). For definition of widths see Methods. (f) Correlation between LimE and RBD widths in expanding pseudopods.
Figure 5
Figure 5. The STEN-CON coupling model and computer simulation
(a) In the STEN-CON coupling model, inputs from various sources enter STEN at different points. When the integrated input reaches a threshold level, STEN becomes fully activated and by coupling to CON causes large protrusions. Without STEN activation, the cytoskeletal oscillations only cause small amplitude undulations of cell boundary. (Note that the stochastic LimE flashes, similar to those reported by Uchida and Yumura , were not accompanied by HSPC300 recruitment and were not considered part of CON in our definition despite a similar lifetime of activities as discussed in the main text.). (b) Schematic of the links between components of the STEN and CON. Red arrows highlight the links demonstrated in this study. (c) The behavior of STEN and CON were modeled using reaction-diffusion equations describing coupled slow (Xs, Ys) and fast (Xf, Yf) activator-inhibitor systems solved in one dimension around a circle (see Supplementary Methods for details). (d) Kymograph describing the activities of the slow (Ys) and fast (Yf) systems around the perimeter of the circle using jet colormap. (e) Intensity plots of the slow and fast systems corresponding to Boxes 1 and 2 in (d). (f) The activities of the slow and fast systems were used to control the boundary of a hypothetical cell (Supplementary Video S11). T-stacks of the activities of Ys and Yf on the boundary of the hypothetical cell with gray colormap corresponding to the period from 100s to 250s (red box) and 350s to 500s (blue box) in (d) are shown.
Figure 6
Figure 6. Predictions of STEN-CON coupling for cell migration
(a) Centroid tracks of wild-type cells treated with DMSO (left) or LY294002 (middle), as well as plaA-/piaA- cells treated with LY294002 (right). Duration of tracks: 60 minutes. (b) T-stacks of LimE expressed in cells corresponding to those in (a). (c) The centroid tracks of cells in the vicinity of the micropipette filled with 0.4% DMSO (top) or 0.4% DMSO plus 200 μM LY294002 (bottom) are overlaid on the final image of a 20-min video. (d) The chemotaxis index (C. I.) of cells in a gradient of LY294002 (red circles) or DMSO (blue triangles) versus the distance from the tip of the micropipette. The C. I.s for cells within 100 μm and between 300 to 400 μm from the tip of the LY294002-filled micropipette were −0.48 ± 0.09 (mean ± S.E., n = 32 cells) and −0.07 ± 0.12 (mean ± S.E. n= 30 cells), respectively. The C. I. for cells within 100 μm of the DMSO-filled micropipette was 0.10 ±0.14 (mean ± S.E. n= 21 cells). (e) RBD responses to a gradient generated by a micropipette (tip indicated by yellow dot) filled with 200 μM LY294002 (left). Cosine angles of the direction of patches before and after placement of micropipette is shown on right (mean ± S.E.; n=138 and 99 frames from 5 cells, ** p<0.001, t-test).

References

    1. Ridley AJ, et al. Cell migration: integrating signals from front to back. Science. 2003;302:1704–1709. - PubMed
    1. Bosgraaf L, Van Haastert PJ. The ordered extension of pseudopodia by amoeboid cells in the absence of external cues. PLoS One. 2009;4:e5253. - PMC - PubMed
    1. Tranquillo RT, Lauffenburger DA, Zigmond SH. A stochastic model for leukocyte random motility and chemotaxis based on receptor binding fluctuations. J Cell Biol. 1988;106:303–309. - PMC - PubMed
    1. Arrieumerlou C, Meyer T. A local coupling model and compass parameter for eukaryotic chemotaxis. Dev Cell. 2005;8:215–227. - PubMed
    1. Welf ES, Haugh JM. Signaling pathways that control cell migration: models and analysis. Wiley Interdiscip Rev Syst Biol Med. 2011;3:231–240. - PMC - PubMed

Publication types

Substances