

Hippocampal BOLD response during category learning predicts subsequent performance on transfer generalization
- PMID: 24142480
- PMCID: PMC6869025
- DOI: 10.1002/hbm.22389
Hippocampal BOLD response during category learning predicts subsequent performance on transfer generalization
Abstract
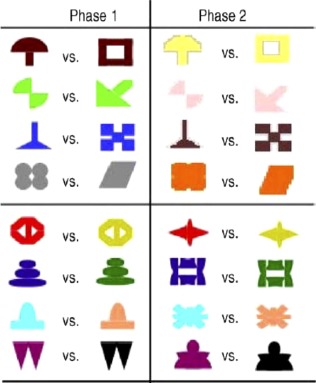
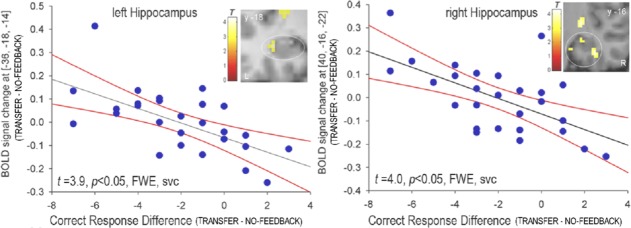
To test a prediction of our previous computational model of cortico-hippocampal interaction (Gluck and Myers [1993, 2001]) for characterizing individual differences in category learning, we studied young healthy subjects using an fMRI-adapted category-learning task that has two phases, an initial phase in which associations are learned through trial-and-error feedback followed by a generalization phase in which previously learned rules can be applied to novel associations (Myers et al. [2003]). As expected by our model, we found a negative correlation between learning-related hippocampal responses and accuracy during transfer, demonstrating that hippocampal adaptation during learning is associated with better behavioral scores during transfer generalization. In addition, we found an inverse relationship between Blood Oxygenation Level Dependent (BOLD) activity in the striatum and that in the hippocampal formation and the orbitofrontal cortex during the initial learning phase. Conversely, activity in the dorsolateral prefrontal cortex, orbitofrontal cortex and parietal lobes dominated over that of the hippocampal formation during the generalization phase. These findings provide evidence in support of theories of the neural substrates of category learning which argue that the hippocampal region plays a critical role during learning for appropriately encoding and representing newly learned information so that that this learning can be successfully applied and generalized to subsequent novel task demands.
Keywords: BOLD activity; basal ganglia; category learning; computational model; cortico-hippocampal interaction; transfer generalization.
Copyright © 2013 Wiley Periodicals, Inc.
Figures


Similar articles
-
A neural model of hippocampal-striatal interactions in associative learning and transfer generalization in various neurological and psychiatric patients.Brain Cogn. 2010 Nov;74(2):132-44. doi: 10.1016/j.bandc.2010.07.013. Epub 2010 Aug 21. Brain Cogn. 2010. PMID: 20728258 Free PMC article.
-
Abstract Memory Representations in the Ventromedial Prefrontal Cortex and Hippocampus Support Concept Generalization.J Neurosci. 2018 Mar 7;38(10):2605-2614. doi: 10.1523/JNEUROSCI.2811-17.2018. Epub 2018 Feb 7. J Neurosci. 2018. PMID: 29437891 Free PMC article.
-
The role of the hippocampus in generalizing configural relationships.Hippocampus. 2017 Mar;27(3):223-228. doi: 10.1002/hipo.22688. Epub 2017 Jan 24. Hippocampus. 2017. PMID: 27933668 Free PMC article.
-
Generalization and the hippocampus: More than one story?Neurobiol Learn Mem. 2020 Nov;175:107317. doi: 10.1016/j.nlm.2020.107317. Epub 2020 Sep 30. Neurobiol Learn Mem. 2020. PMID: 33007461 Free PMC article. Review.
-
The role of the hippocampal theta rhythm in non-spatial discrimination and associative learning task.Neurosci Biobehav Rev. 2020 Mar;110:92-99. doi: 10.1016/j.neubiorev.2018.09.016. Epub 2018 Sep 25. Neurosci Biobehav Rev. 2020. PMID: 30261198 Review.
Cited by
-
Hippocampal contributions to value-based learning: Converging evidence from fMRI and amnesia.Cogn Affect Behav Neurosci. 2019 Jun;19(3):523-536. doi: 10.3758/s13415-018-00687-8. Cogn Affect Behav Neurosci. 2019. PMID: 30767129 Free PMC article.
-
Post-traumatic stress symptoms are associated with better performance on a delayed match-to-position task.PeerJ. 2018 May 3;6:e4701. doi: 10.7717/peerj.4701. eCollection 2018. PeerJ. 2018. PMID: 29736339 Free PMC article.
-
Impact of aging on frontostriatal reward processing.Hum Brain Mapp. 2015 Jun;36(6):2305-17. doi: 10.1002/hbm.22771. Epub 2015 Feb 20. Hum Brain Mapp. 2015. PMID: 25704624 Free PMC article.
-
Deficits in hippocampal-dependent transfer generalization learning accompany synaptic dysfunction in a mouse model of amyloidosis.Hippocampus. 2016 Apr;26(4):455-71. doi: 10.1002/hipo.22535. Epub 2015 Oct 19. Hippocampus. 2016. PMID: 26418152 Free PMC article.
-
Increased generalization of learned associations is related to re-experiencing symptoms in veterans with symptoms of post-traumatic stress.Stress. 2015;18(4):484-9. doi: 10.3109/10253890.2015.1053450. Epub 2015 Sep 15. Stress. 2015. PMID: 26372003 Free PMC article.
References
-
- Acuna BD, Eliassen JC, Donoghue JP, Sanes JN (2002): Frontal and parietal lobe activation during transitive inference in humans. Cereb Cortex 12:1312–1321. - PubMed
-
- Chase HW, Clark L, Myers CE, Gluck MA, Sahakian BJ, Bullmore ET, Robbins TW (2008): The role of the orbitofrontal cortex in human discrimination learning. Neuropsychologia 46:1326–1337. - PubMed
-
- Cincotta CM, Seger CA (2007): Dissociation between striatal regions while learning to categorize via feedback and via observation. J Cogn Neurosci 19:249–265. - PubMed
-
- Daw ND, Niv Y, Dayan P (2005): Uncertainty‐based competition between prefrontal and dorsolateral striatal systems for behavioral control. Nat Neurosci 8:1704–1711. - PubMed
-
- Di Paola M, Caltagirone C, Fadda L, Sabatini U, Serra L, Carlesimo GA (2008): Hippocampal atrophy is the critical brain change in patients with hypoxic amnesia. Hippocampus 18:719–728. - PubMed
Publication types
MeSH terms
Substances
LinkOut - more resources
Full Text Sources
Other Literature Sources
Research Materials
