. 2014 Jan 1;306(1):L88-100.
doi: 10.1152/ajplung.00066.2013. Epub 2013 Oct 18.

Methemoglobin-induced signaling and chemokine responses in human alveolar epithelial cells

Affiliations

Methemoglobin-induced signaling and chemokine responses in human alveolar epithelial cells

Sharon Mumby et al. Am J Physiol Lung Cell Mol Physiol. .

Abstract

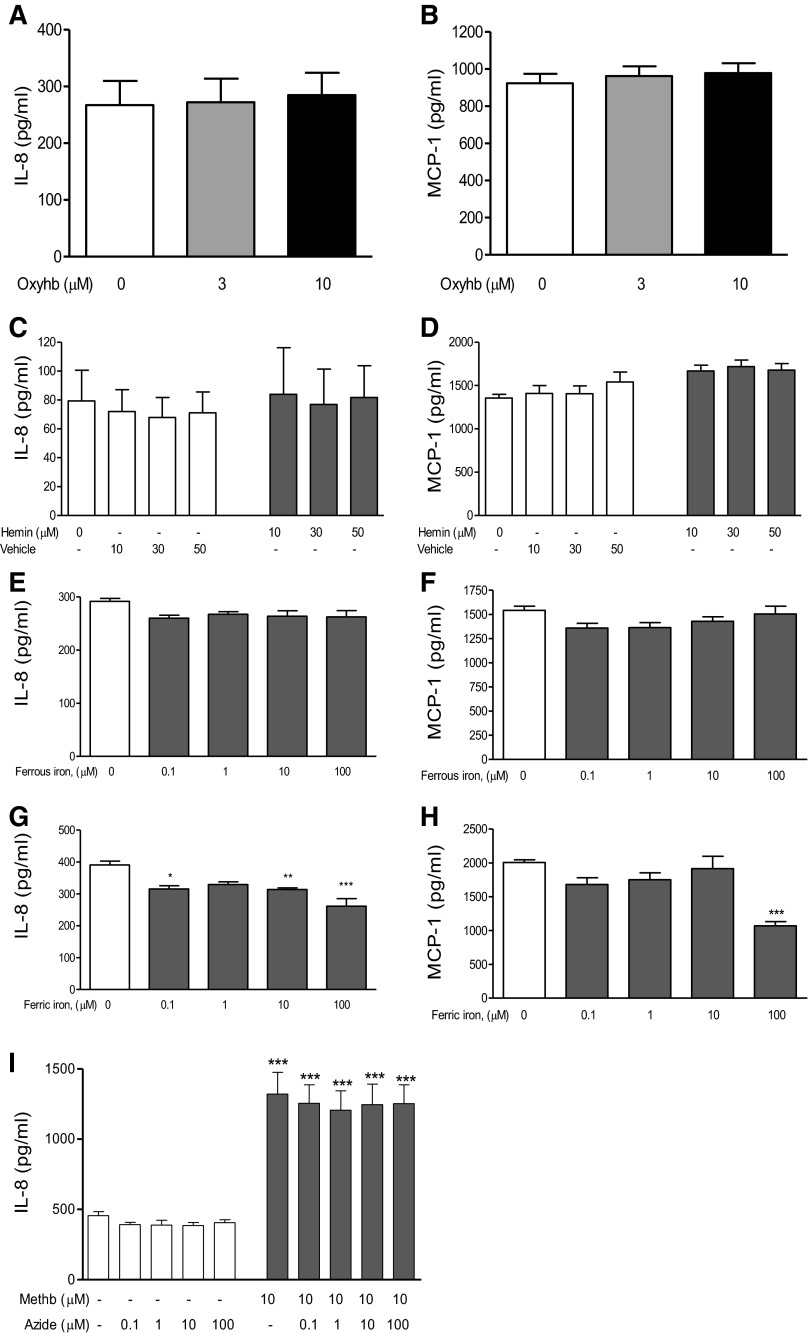
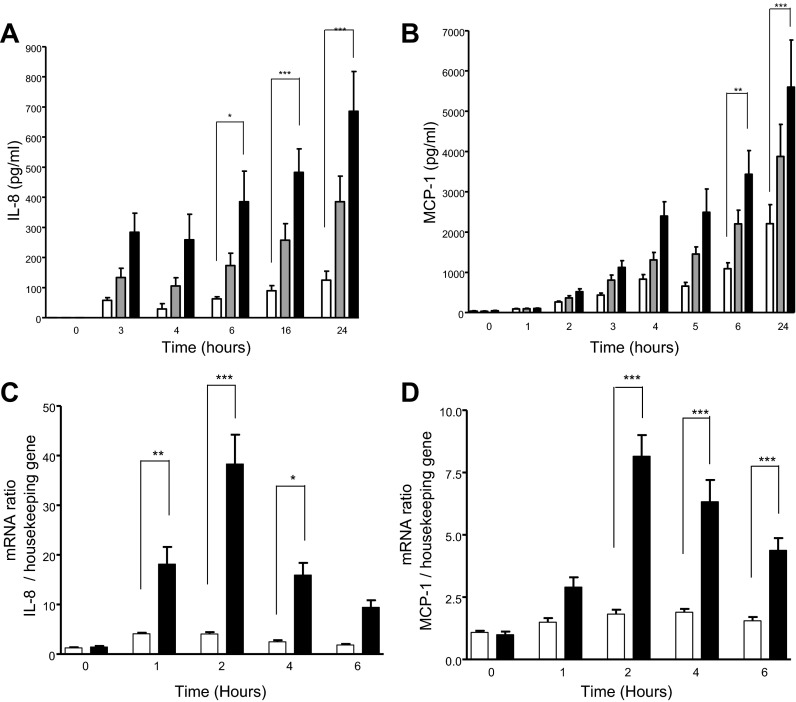
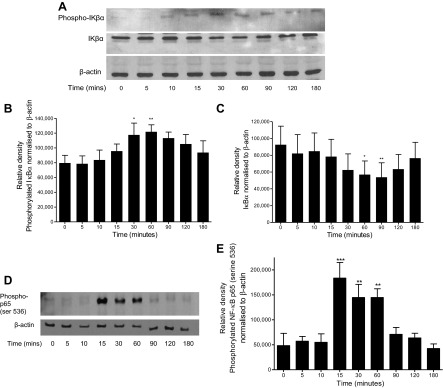
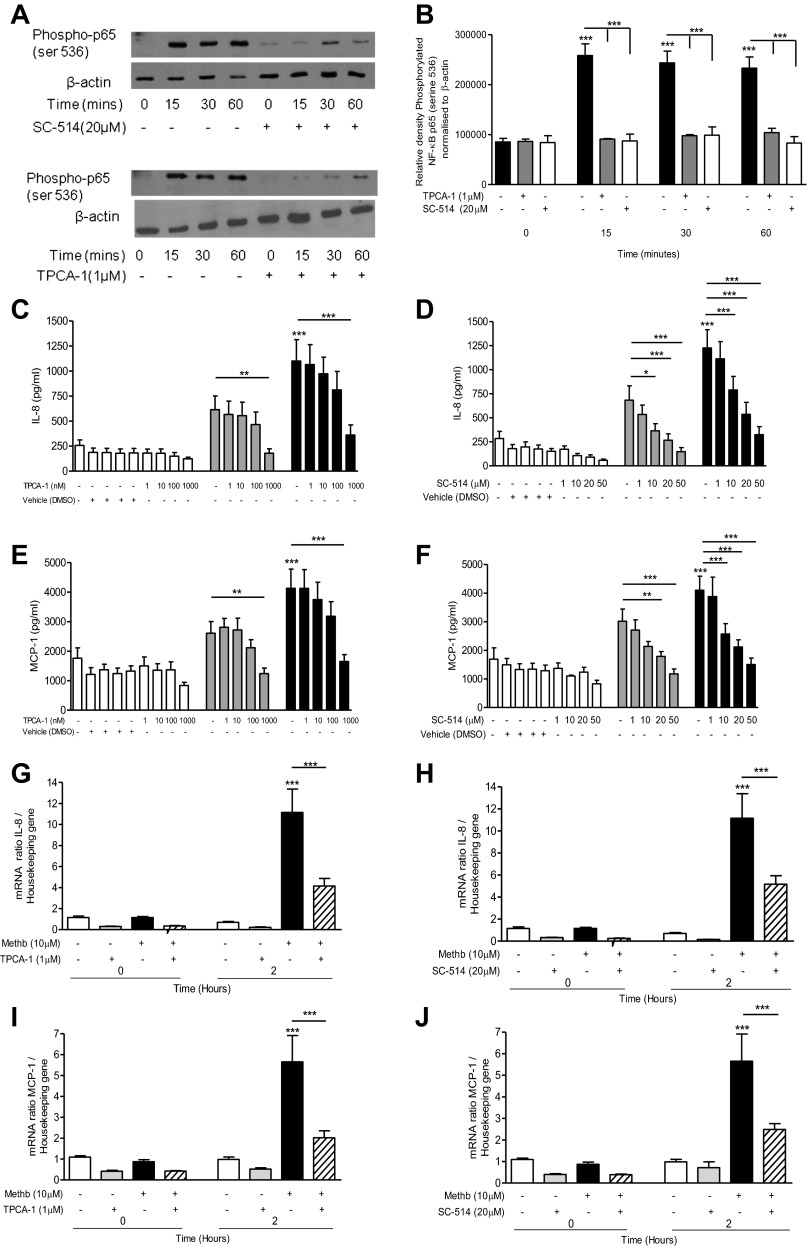
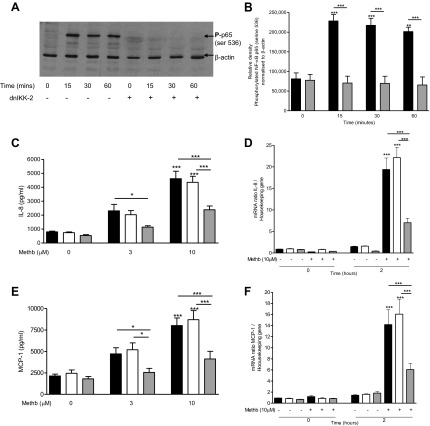
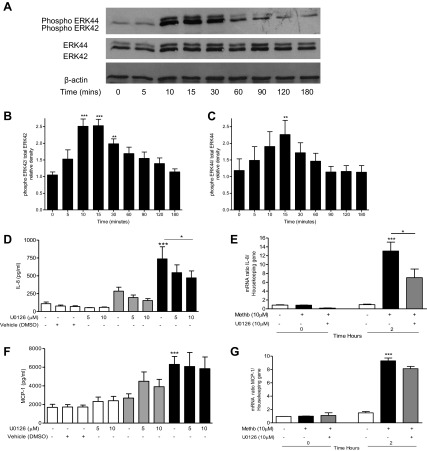
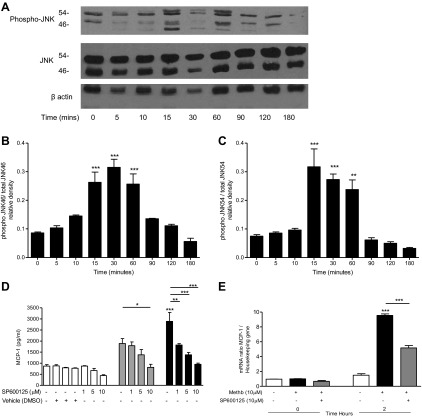
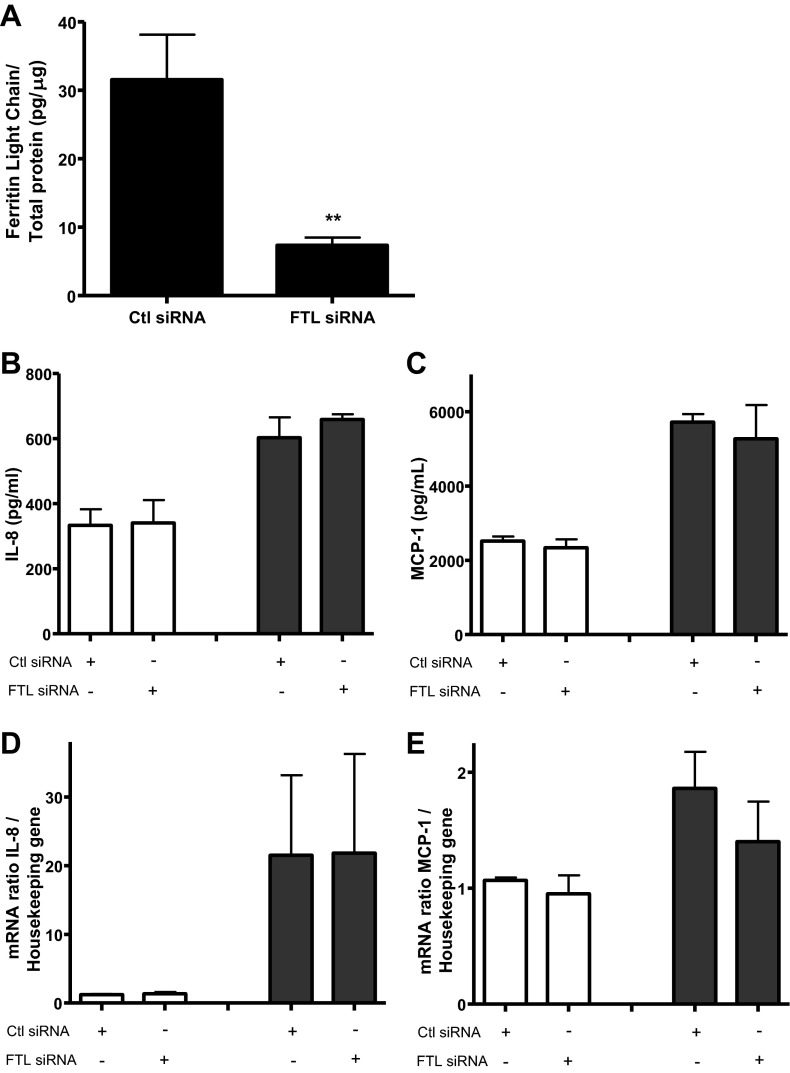
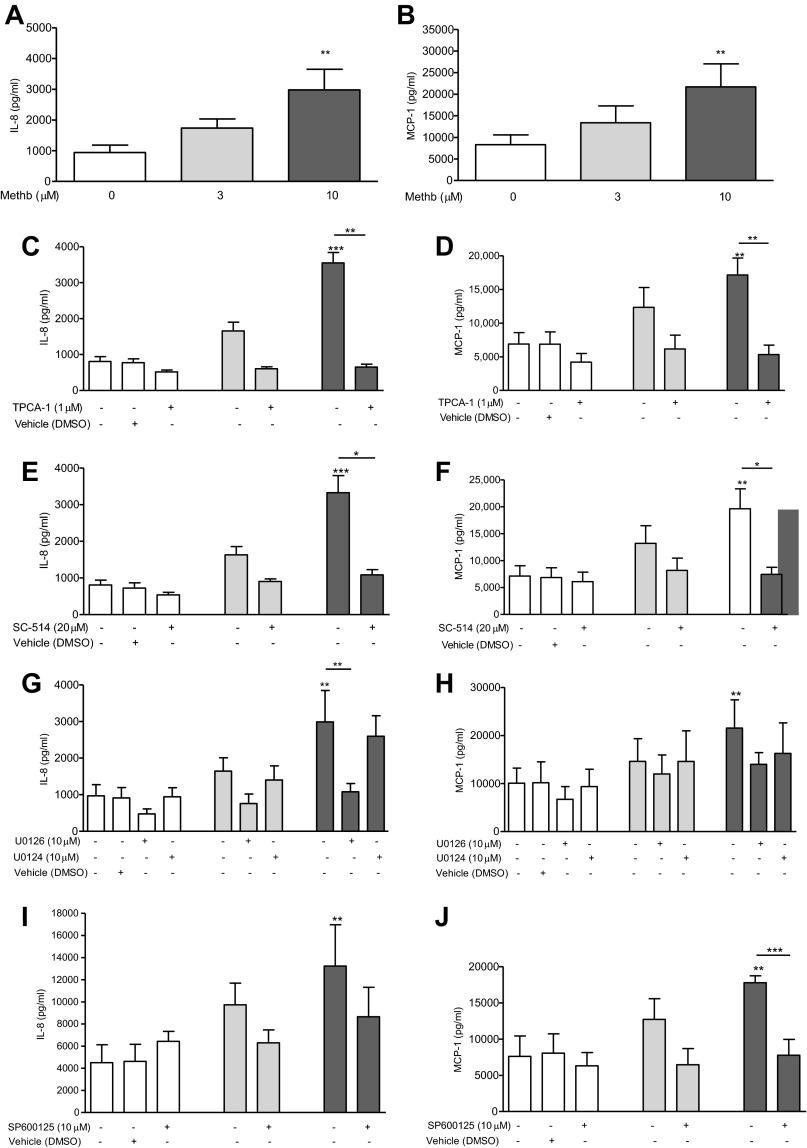
Diffuse alveolar hemorrhage is characterized by the presence of red blood cells and free hemoglobin in the alveoli and complicates a number of serious medical and surgical lung conditions including the pulmonary vasculitides and acute respiratory distress syndrome. In this study we investigated the hypothesis that exposure of human alveolar epithelial cells to hemoglobin and its breakdown products regulates chemokine release via iron- and oxidant-mediated activation of the transcription factor NF-κB. Methemoglobin alone stimulated the release of IL-8 and MCP-1 from A549 cells via activation of the NF-κB pathway; additionally, IL-8 required ERK activation and MCP-1 required JNK activation. Neither antioxidants nor iron chelators and knockdown of ferritin heavy and light chains affected these responses, indicating that iron and reactive oxygen species are not involved in the response of alveolar epithelial cells to methemoglobin. Incubation of primary cultures of human alveolar type 2 cells with methemoglobin resulted in a similar pattern of chemokine release and signaling pathway activation. In summary, we have shown for the first time that methemoglobin induced chemokine release from human lung epithelial cells independent of iron- and redox-mediated signaling involving the activation of the NF-κB and MAPK pathways. Decompartmentalization of hemoglobin may be a significant proinflammatory stimulus in a variety of lung diseases.

Keywords: alveolar epithelial cells; cytokines; methemoglobin.


Figures

Fig. 1.
Fig. 1.
Effect of oxyhemoglobin, hemoglobin degradation products, and azide-bound methemoglobin on A549 cells. A549 cells were incubated for 24 h with the indicated concentrations of oxyhemoglobin (oxyhb; A and B), hemin (C and D), ammonium iron sulfate (Fe2+; E and F), ferric citrate (Fe3+; G and H), or redox-inactivated azide-bound methemoglobin (methb; I). Methemoglobin (10 μM) was incubated overnight at 4°C with increasing amounts of azide prior to the addition to A549 cells. Levels of IL-8 (left) and MCP-1 (right) were determined in the supernatants by ELISA. Data are expressed as means ± SE from 4 separate experiments. Comparison between conditions was made by 1-way ANOVA with Bonferroni posttest, *P < 0.05, **P < 0.01, and ***P < 0.001 compared with control.
Fig. 2.
Fig. 2.
Time course of IL-8 and MCP-1 expression and release after methemoglobin challenge. A and B: A549 cells were incubated with 0 (open bars), 3 (shaded bars), or 10 μM (solid bars) methemoglobin for the times indicated. Levels of IL-8 (A) and MCP-1 (B) were determined in the supernatants by ELISA. C and D: A549 cells were incubated with 0 or 10 μM methemoglobin for the indicated times and RNA was extracted. Reverse-transcribed cDNA was subject to RT-PCR. Levels of IL-8 (C) and MCP-1 (D) mRNA are expressed as a ratio relative to the housekeeping gene. Data are expressed as means ± SE from 4 independent experiments. Comparison between conditions was made by 1-way ANOVA with Bonferroni posttest, *P < 0.05, **P < 0.01, and ***P < 0.001 compared with control at the indicated time points.
Fig. 3.
Fig. 3.
Time course of NF-κB activation after methemoglobin challenge. A549 cells were incubated with 10 μM methemoglobin for 0–180 min, and the cells were harvested in lysis buffer (AC) or nuclear extracts were prepared (D and E). Western blots were performed to detect the presence of phosphorylated IκBα, IκBα, phosphorylated NF-κB p65 (ser536), and β-actin as a loading control; representative blots are shown (A). Western blots were quantified by use of Image J software. The values for phosphorylated IκBα and IκBα are presented, respectively, in B and C, and phosphorylated NF-κB p65 (ser536) in E. Data are presented as means ± SE of 4 independent experiments. Comparison between conditions was made by 1-way ANOVA with Bonferroni posttest: *P < 0.05, **P < 0.01, and ***P < 0.001 compared with control (time 0).
Fig. 4.
Fig. 4.
Effect of IKK-2 inhibitors on NF-κB activation and IL-8 and MCP-1 expression and release. A549 cells were pretreated with 1 μM [5-(p-fluorophenyl)-2-ureido]thiophene-3-carboxamide (TPCA-1) for 1 h or 20 μM SC-514 for 2 h prior to incubation with 10 μM methemoglobin. Cells were collected at the indicated times and nuclear extracts were prepared. Western blot analysis was performed to detect the presence of phosphorylated NF-κB p65 (ser536) and β-actin (loading control); representative blots are shown (A). Western blots were quantified by use of Image J software. The values for phosphorylated NF-κB p65 (ser536) normalized to β-actin are presented in Fig. 3B. A549 cells were pretreated with either TPCA-1 (left) for 1 h or SC-514 (right) for 2 h prior to the addition of methemoglobin. IL-8 and MCP-1 levels were determined in the cell supernatants after 24 h by ELISA (Fig. 3, CF). IL-8 and MCP-1 mRNA levels relative to the housekeeping gene were determined after 2 h (GJ). In all panels data are presented as means ± SE of 4 independent experiments. Comparison between conditions was made by 1-way ANOVA with Bonferroni posttest, *P < 0.05, **P < 0.01, and ***P < 0.001. Asterisks on top of columns refer to comparison with the control (medium only); asterisks above lines refer to comparison between indicated conditions.
Fig. 5.
Fig. 5.
Effect of dnIKK-2 transfection on NF-κB activation and IL-8 and MCP-1 expression and release. A and B: transfected cells (dnIKK-2; shaded bars) or normal nontransfected A549 cells (solid bars) were incubated with 10 μM methemoglobin for 0–60 min. Western blot analysis was performed to detect the presence of phosphorylated NF-κB p65 (ser536) and β-actin as loading control (blot shown in Fig. 4A). Western blots were quantified by use of Image J software and the values for phosphorylated NF-κB p65 (ser536) normalized to β-actin are presented in B as means ± SE of 3 independent experiments. CF: A549 cells were transfected with dnIKK-2 (shaded bars) or an empty vector (open bars) for 24 h, transfection medium was removed, and cells incubated with methemoglobin for 2 or 24 h. IL-8 and MCP-1 were determined in the cell supernatants after 24 h by ELISA (C and E). Cells were harvested after 2 h for the detection of IL-8 and MCP-1 mRNA expression (D and F). IL-8 and MCP-1 mRNA levels were quantified by RT-PCR compared with housekeeping gene. Data are presented as means ± SE of 4 independent experiments. Comparison between conditions was made by 1-way ANOVA with Bonferroni posttest, *P < 0.05, **P < 0.01, and ***P < 0.001. Asterisks on top of column refer to comparison with the appropriate control; asterisks above lines refer to comparison between indicated conditions.
Fig. 6.
Fig. 6.
Methemoglobin stimulated ERK activation in A549 cells. AC: A549 cells were incubated with 10 μM methemoglobin for 0–180 min and cells were harvested in lysis buffer. Western blot analysis was performed (A). Data from 4 independent experiments were analyzed by use of Image J software to quantify the density of the bands, and the values for phospho-ERK42 and phospho-ERK44 against total ERK42 and ERK44 after normalization to β-actin are presented, respectively, in B and C. DF: A549 cells were preincubated with 10 μM U0126 for 2 h prior to the addition of 3 μM (shaded bars) or 10 μM (solid bars) methemoglobin. IL-8 (D) and MCP-1 (F) were determined in the cell supernatants after 24 h by ELISA. Cells were treated with 10 μM methemoglobin and harvested after 2 h for the detection of IL-8 (E) and MCP-1 (G) mRNA expression. Data are presented as means ± SE of 4 independent experiments. Comparison between conditions was made by 1-way ANOVA with Bonferroni posttest, *P < 0.05, **P < 0.01, and ***P < 0.001. Asterisks on top of bars refer to comparison with the control (medium only); asterisks above lines refer to comparison between indicated conditions.
Fig. 7.
Fig. 7.
Methemoglobin stimulated JNK activation in A549 cells. AC: A549 cells were incubated with 10 μM methemoglobin for 0–180 min and cells were harvested in lysis buffer. Western blot analysis was performed to detect the presence of phosphorylated JNK, JNK, and β-actin in 20 μg of cell lysate protein; representative blots are shown in A. Data from 4 independent Western blot experiments were analyzed by use of Image J software to quantify the density of the bands and the values for phospho-JNK46 and phospho-JNK54 against JNK46 and JNK54 after normalization to β-actin are presented, respectively, in B and C. D and E: A549 cells were preincubated with SP600125 for 1 h prior to the addition of methemoglobin for 2 or 24 h. MCP-1 (D) was determined in the cell supernatants after 24 h by ELISA. Cells were harvested after 2 h and total RNA was extracted. MCP-1 mRNA levels were quantified by real-time PCR compared with a housekeeping gene (E). Data are presented as means ± SE of 4 independent experiments. Comparison between conditions was made by 1-way ANOVA with Bonferroni posttest, *P < 0.05, **P < 0.01, and ***P < 0.001. Asterisks on top of bar refer to comparison with the control (medium only); asterisks above lines refer to comparison between indicated conditions.
Fig. 8.
Fig. 8.
Effect of ferritin light chain (FTL) knockdown on methemoglobin-mediated IL-8 and MCP-1 expression and release. A: A549 cells were treated with 10 nM control (Ctl) or FTL siRNA for 40 h. Cells were harvested and levels of FTL were measured by ELISA relative to total protein. Comparison between conditions was made by Student's t-test, **P < 0.01. BE: A549 cells were treated with siRNA as above, followed by 10 μM methemoglobin (shaded bars) or medium (open bars). After 24 h IL-8 and MCP-1 levels (B and C) were measured in the cell supernatant by ELISA. Total RNA was harvested after treatment with methemoglobin for 2 h. Levels of IL-8 and MCP-1 mRNA relative to the housekeeping gene were quantified by real-time PCR (D and E).
Fig. 9.
Fig. 9.
Methemoglobin stimulated release of IL-8 and MCP-1 from human AT2 cells. A and B: hAT2 cells were incubated with 0 (open bars), 3 (shaded bars), or 10 μM (solid bars) methemoglobin for 24 h. IL-8 (A) and MCP-1 (B) levels were determined in the supernatant by ELISA. Data are presented as means ± SE of 5 independent experiments. CJ: hAT2 cells were preincubated with 1 μM TPCA-1 (C and D) for 1 h, 20 μM SC-514 (E and F) for 2 h, 10 μM U0126 (G and H) for 2 h, or 10 μM SP600125 (I and J) for 1 h, prior to the addition of methemoglobin for 24 h. IL-8 and MCP-1 levels were determined in the cell supernatants by ELISA. Data are presented as means ± SE of 4 independent experiments. Comparison between conditions was made by Kruskal-Wallis test with Dunn's posttest, *P < 0.05, **P < 0.01, and ***P < 0.001. Asterisks on top of bar refer to comparison with the control (medium only); asterisks above the line refer to comparison between indicated conditions.

Comment in

References

    1. Adamzik M, Hamburger T, Petrat F, Peters J, de Groot H, Hartmann M. Free hemoglobin concentration in severe sepsis: methods of measurement and prediction of outcome. Crit Care 16: R125, 2012 - PMC - PubMed
    1. Alayash AI, Patel RP, Cashon RE. Redox reactions of hemoglobin and myoglobin: biological and toxicological implications. Antioxid Redox Signal 3: 313–327, 2001 - PubMed
    1. Antoniades HN, Neville-Golden J, Galanopoulos T, Kradin RL, Valente AJ, Graves DT. Expression of monocyte chemoattractant protein 1 mRNA in human idiopathic pulmonary fibrosis. Proc Natl Acad Sci USA 89: 5371–5375, 1992 - PMC - PubMed
    1. Balla J, Jacob HS, Balla G, Nath K, Eaton JW, Vercellotti GM. Endothelial-cell heme uptake from heme proteins: induction of sensitization and desensitization to oxidant damage. Proc Natl Acad Sci USA 90: 9285–9289, 1993 - PMC - PubMed
    1. Balla J, Vercellotti GM, Jeney V, Yachie A, Varga Z, Jacob HS, Eaton JW, Balla G. Heme, heme oxygenase, and ferritin: how the vascular endothelium survives (and dies) in an iron-rich environment. Antioxid Redox Signal 9: 2119–2137, 2007 - PubMed

Publication types

MeSH terms