. 2013 Dec 6;288(49):35253-65.
doi: 10.1074/jbc.M113.478271. Epub 2013 Oct 18.

The growth factor receptor ERBB2 regulates mitochondrial activity on a signaling time scale

Affiliations

The growth factor receptor ERBB2 regulates mitochondrial activity on a signaling time scale

Nirav Patel et al. J Biol Chem. .

Abstract

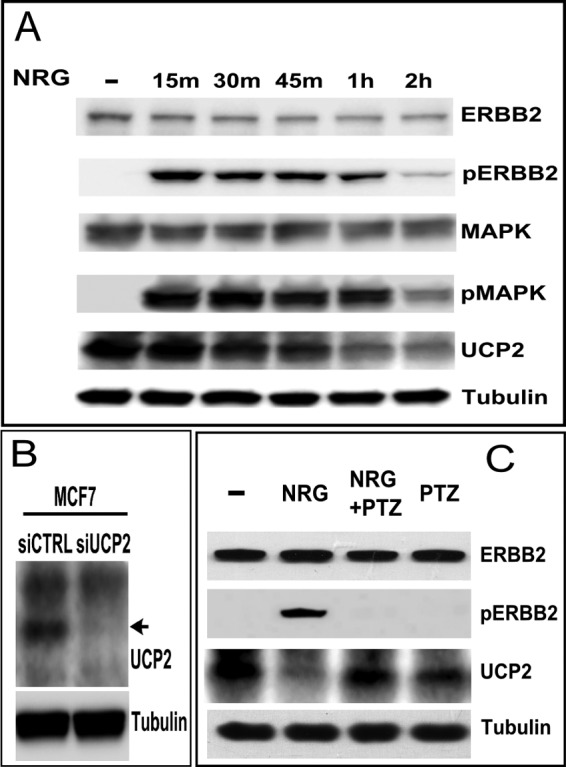
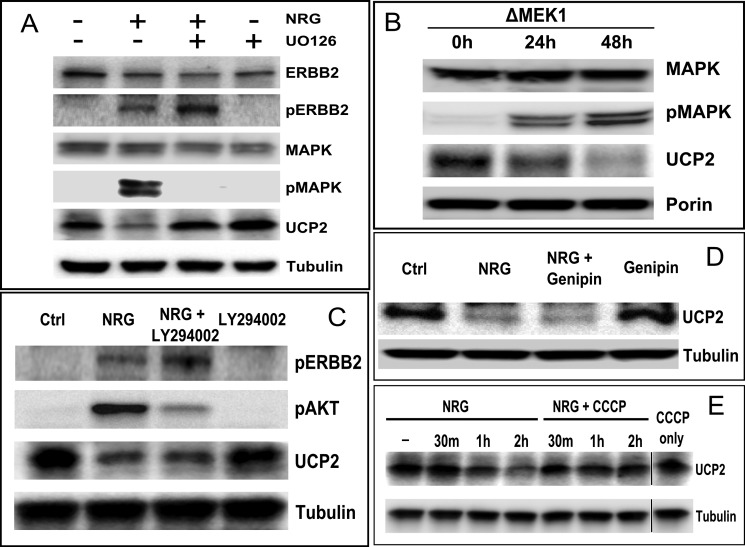
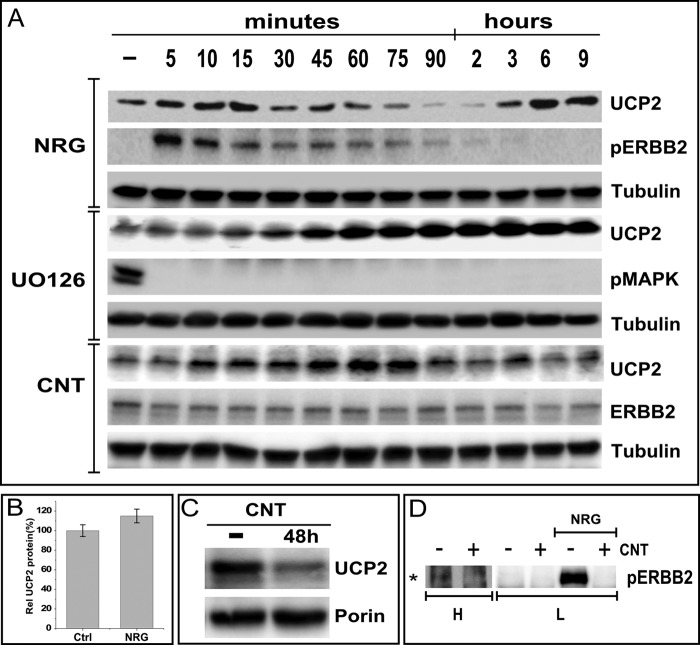
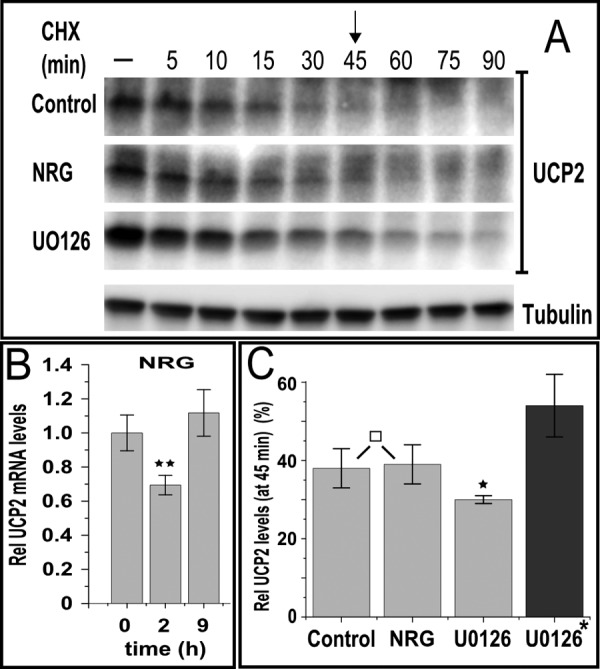
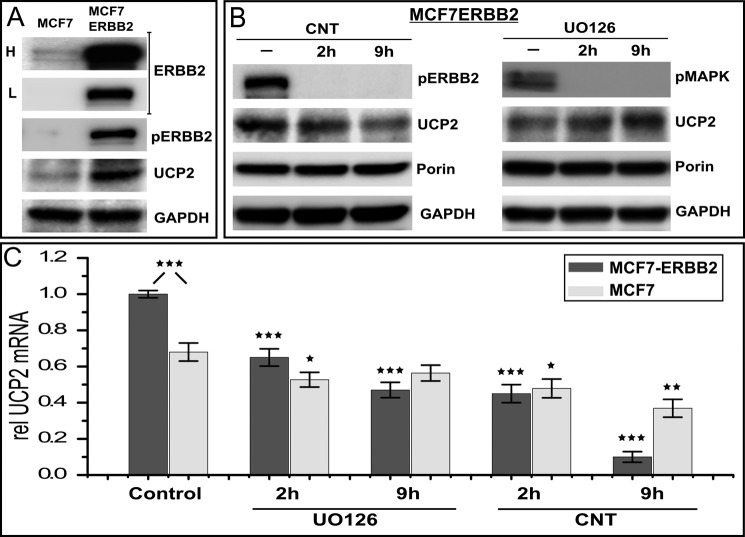
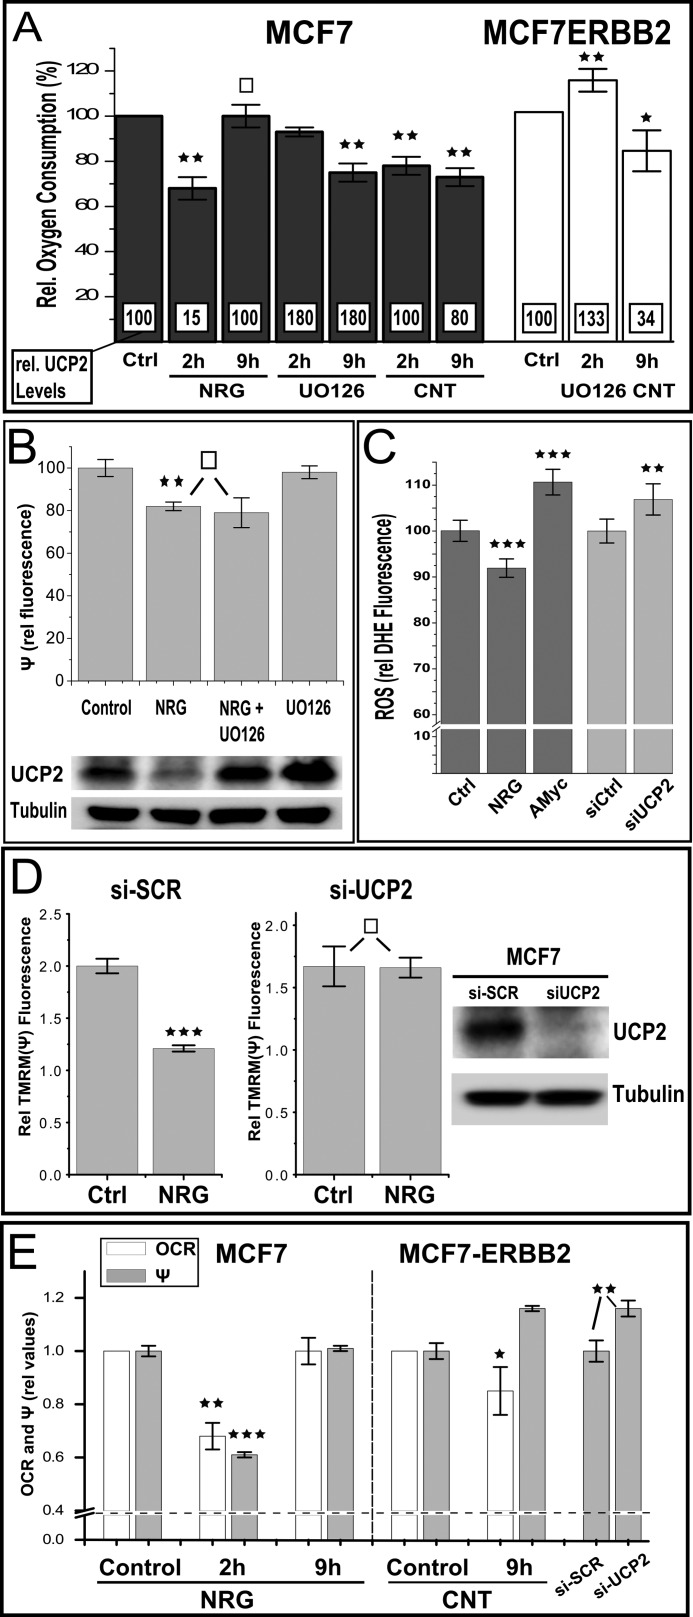
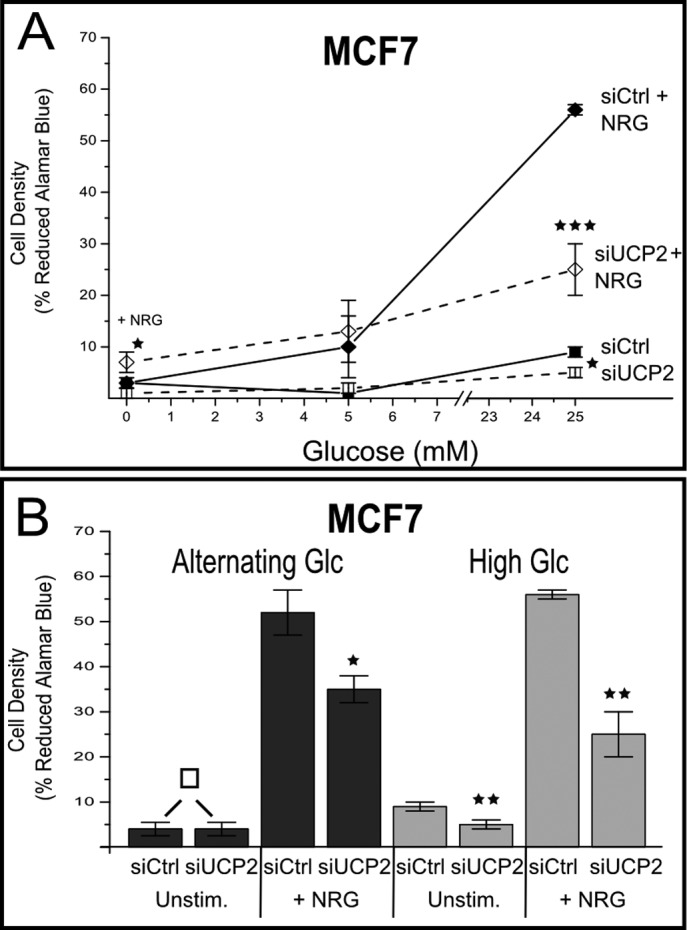
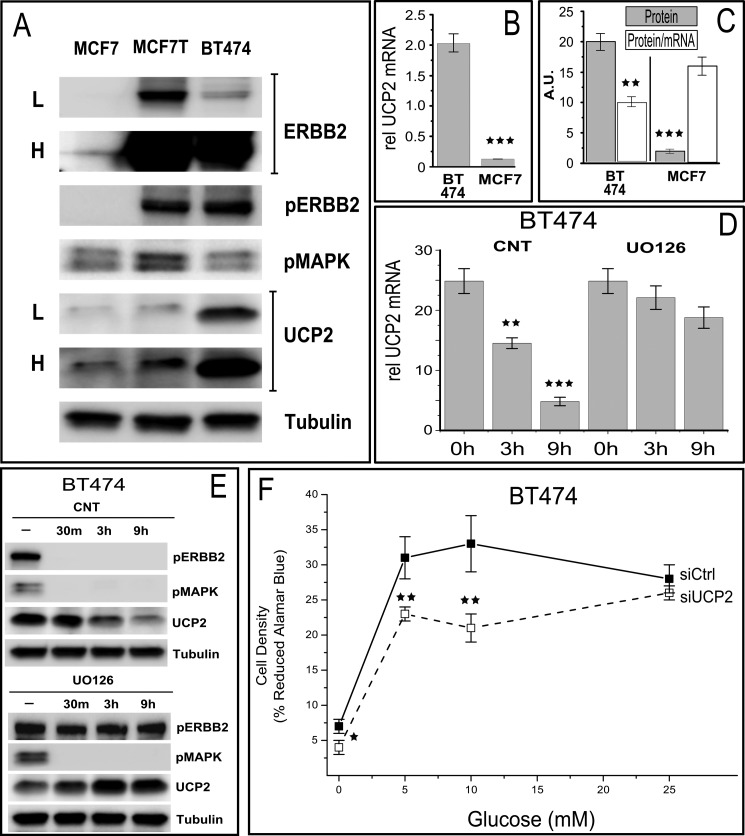
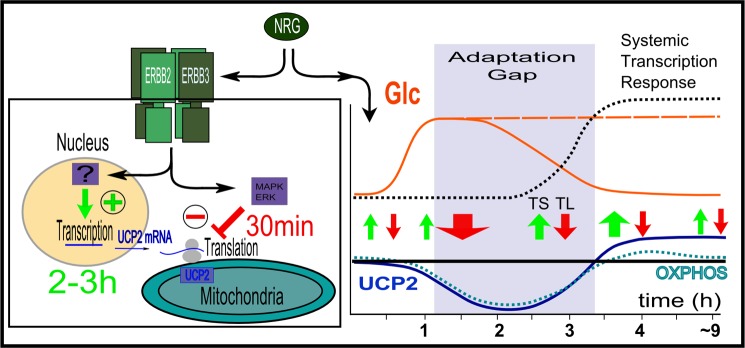
Overexpression of the ERBB2 receptor tyrosine kinase and the mitochondrial inner membrane protein UCP2 occurs frequently in aggressive cancers with dysfunctional mitochondria. Overexpressed ERBB2 signals constitutively and elevated UCP2 can uncouple mitochondria and alleviate oxidative stress. However, the physiological contributions of UCP2 and ERBB2 at the low expression levels that are typical of most tissues, as well as the path to oncogenic deregulation, are poorly understood. We now show that ERBB2 directly controls UCP2 levels, both at low physiological levels and oncogenic overexpression. At low levels of receptor and UCP2, ligand stimulation creates a distinct temporal response pattern driven by the opposing forces of translational suppression of the exceptionally short lived UCP2 protein and a time delayed transcriptional up-regulation. The latter becomes dominant through constitutive signaling by overexpressed ERBB2, resulting in high levels of UCP2 that contribute mitochondrial uncoupling. By contrast, ligand stimulation of non-overexpressed ERBB2 transiently removes UCP2 and paradoxically reduces the mitochondrial membrane potential, oxygen consumption, and OXPHOS on a signaling time scale. However, neither the transporter activity nor down-regulation of already low UCP2 levels drive this reduction in mitochondrial activity. Instead, UCP2 is required to establish mitochondria that are capable of responding to ligand. UCP2 knockdown impairs proliferation at high glucose but its absence specifically impairs ligand-induced growth when glucose levels fluctuate. These findings demonstrate the ability of growth factor signaling to control oxidative phosphorylation on a signaling time scale and point toward a non-transporter role for low levels of UCP2 in establishing dynamic response capability.

Keywords: Glucose Metabolism; Mitochondria; Receptor Tyrosine Kinase; Signal Transduction; Uncoupling Proteins.


Figures

FIGURE 1.
FIGURE 1.
Ligand stimulation of ERBB2 results in the rapid and MAPK-dependent down-regulation of UCP2. A, stimulation of MCF7 cells with NRGβ1 (30 nm) for the times indicated above the lanes (NRG). Levels and activation states of ERBB2, MAPK, and UCP2 were evaluated by Western blotting. B, UCP2 levels in MCF7 are very low. To validate our detection system, we confirmed antibody specificity by siRNA knockdown of UCP2 in MCF7. C, ligand-induced down-regulation of UCP2 is blocked by the ERBB2-specific antibody, pertuzumab (PTZ), administered 1 h prior to a 2-h NRGβ1 stimulation.
FIGURE 2.
FIGURE 2.
A, inhibition of MAPK with UO126 (3 h pretreatment with 25 μm) abrogates the NRG-induced down-regulation of UCP2. Protein levels were analyzed after 2 h of ligand stimulation. B, constitutive phosphorylation and activation of ERK1/2 by ΔMEK1 results in the down-regulation of UCP2. MCF7 cell lysates were harvested at the indicated time points post-transfection with ΔMEK1. C, the ligand-induced down-regulation of UCP2 does not involve AKT. The PI3K/AKT inhibitor LY294002 (50 μm) was added to MCF7 cells for 3 h with NRGβ1 addition after 1 h. D, the UCP2 inhibitor Genipin has no effect on the basal levels of UCP2 or its down-regulation. MCF7 cells were treated with NRGβ1 (30 nm) for 2 h in the presence or absence of Genipin (5 mm, added 1 h prior to ligand activation). E, an intact membrane potential is needed to facilitate the ligand-dependent down-regulation of UCP2. CCCP (5 μm) was used to depolarize mitochondria followed by treatment with NRGβ1 (30 nm) for the indicated time points.
FIGURE 3.
FIGURE 3.
The down-regulation of UCP2 is transient and reflects competing regulatory events. A, UCP2 levels in MCF7 cells were evaluated at the indicated time points after stimulation with NRGβ1 (NRG, 30 nm) or alternatively, inhibition with UO126 (25 μm) or the irreversible ERBB2 inhibitor Canertinib (1 μm). B, NRGβ1 induced prolonged ERBB2/3 signaling causes a moderate increase in UCP2 protein levels in MCF7 cells. MCF7 cells were treated with NRGβ1 for 3 days. UCP2 protein levels were analyzed by Western blotting followed by densitometric analysis, which is represented as a bar graph of triplicates normalized to tubulin levels. C, inhibition of the basal level of ERBB2 signaling with the irreversible and ERBB specific kinase inhibitors Canertinib (CNT) reduces UCP2 levels, indicating a contribution to low levels of ERBB2 activation to the steady state level of UCP2. D, the basal level of ERBB2 signaling in non-serum-starved MCF7 cells is barely detectable but inhibited by Canertinib. L and H indicate low and high load levels, respectively. As a positive control of inhibitor activity, ligand-induced receptor activation was blocked. Immunoprecipitation was performed on MCF7 cell lysates using anti-phosphotyrosine antibody-conjugated beads followed by immunoblotting with anti-ERBB2 antibody.
FIGURE 4.
FIGURE 4.
Ligand-mediated down-regulation of UCP2 occurs at the level of translation. A, cycloheximide treatment (CHX, 50 μm) results in the rapid decrease in UCP2 levels at a rate that is independent of ligand stimulation or UO126 pretreatment (added 1 h prior to CHX addition). B, compared with protein levels, ligand stimulation has little effect on UCP2 mRNA. Quantitative PCR derived data were normalized to 18 S rRNA and shown at 2 h (at which protein is almost completely depleted) or 9 h (protein levels are recovered). C, densitometric analysis of UCP2 levels at 45 min post-CHX addition. Data are normalized to tubulin levels and expressed as percent of starting levels prior to CHX addition. UO126 was present throughout the treatment as indicated. For UO126-treated samples marked with *, data are instead shown relative to the starting levels of non-pretreated samples. Error bars shown in B and C represent mean ± S.E. or S.D., respectively. p values <0.05, <0.01, <0.005, and >0.9 are marked *, **, ***, and □, respectively.
FIGURE 5.
FIGURE 5.
ERBB2 amplification drives UCP2 overexpression in stable ERBB2 overexpressing MCF7 cells. A, comparison of ERBB2 and UCP2 levels as well as associated constitutive signaling in MCF7 and MCF7-ERBB2 cells (data for ERBB2-amplified BT474 cells are compiled in Fig. 8). L and H represent low and high exposure levels needed to convey the vastly different levels of ERBB2 expression in both cell lines. B, the basic modes of regulation observed in MCF7 are also in place in MCF7-ERBB2 cells. The long term decrease in UCP2 levels in response to Canertinib (CNT) is more pronounced compared with MCF7. MAPK inhibition shows a relative increase of UCP2 that is comparable with that observed in MCF7 parental cells (Fig. 2). C, MCF7-ERBB2 have elevated levels of UCP2 mRNA, although not proportional to the elevated level of protein. For MCF7 cells, the inhibition of MAPK has only a modest impact on mRNA levels, which is not sustained, whereas Canertinib treatment results in likewise modest but a progressive decrease in mRNA levels. Inhibitor sensitivity is much more pronounced for MCF7-ERBB2 with Canertinib treatment achieving a close to 90% reduction in mRNA levels after 9 h of treatment despite the fact that UO126 shows a much more pronounced impact on cell viability at 9 h of treatment. All mRNA levels are normalized to 18 S rRNA and error bars represent S.E. p values <0.05, <0.01, <0.005, and >0.9 are marked *, **, ***, and □, respectively, and refer to comparisons with respective controls unless pairs are identified explicitly.
FIGURE 6.
FIGURE 6.
ERBB2 regulates mitochondrial activity in a UCP2-dependent manner. A, ligand activation of MCF7 reversibly reduces oxygen consumption as does the inhibition of ERBB signaling (and UCP2 down-regulation) by prolonged Canertinib treatment in MCF7-ERBB2 cells (compare Fig. 4, B and C). Relative endogenous oxygen consumption was measured in MCF7 and MCF7-ERBB2 cells after treatment with NRGβ1 (NRG, 30 nm), UO126 (25 μm), or Canertinib (CNT, 1 μm) for different time points as shown in the bar graph. For comparison, superimposed numbers in white boxes represent relative UCP2 protein levels obtained from immunoblots at those conditions (Figs. 2 and 4). B, the decrease in oxygen consumption upon ligand treatment of MCF7 cells is also reflected in a reduced membrane potential but not dependent on a down-regulation of UCP2. Data represent tetramethylrhodamine methyl ester (TMRM) fluorescence relative to respective controls with or without UO126 pretreatment (1 h prior to an additional 2-h ligand treatment as indicated). For graphic representation of fluorescence data, the residual tetramethylrhodamine methyl ester signal after CCCP treatment (approximately 50% of untreated samples) was subtracted as background. C, 2 h of ligand stimulation further reduces (already low) ROS levels in MCF7 cells. The indicated relative dihydroethidium fluorescence values are the average of ∼600 adherent live cells per data set, acquired by fluorescence microscopy and automated object identification. The observed decrease in ROS after NRG treatment is comparable in magnitude to the increase after inhibition with antimycin (AMyc, 10 μm) as a positive control (Ctrl). In contrast to NRG signaling with its associated UCP2 down-regulation, the isolated knockdown of UCP2 by siRNA results in an increase in ROS levels. D, the siRNA knockdown of UCP2 eliminates acute ligand responsiveness, measured as a decrease in membrane potential. Data are shown relative to their respective non-ligand stimulated controls. The assessment of the mitochondrial membrane potential and UCP2 protein levels was done 48 h post-transfection with siRNA or scramble control. Ligand stimulation (NRG, 10 nm) was carried out for 2 h. E, in contrast to the parallel decrease of membrane potential and oxygen consumption in ligand-stimulated and UCP2-depleted MCF7 parental cells, the down-regulation of UCP2 in MCF7-ERBB2 cells by Canertinib treatment or siRNA results in an increase of the membrane potential without increase in oxygen consumption, consistent with the removal of uncoupling capacity. Error bar represent S.D., except for C (S.E.). p values <0.05, <0.01, <0.005, and >0.9 are marked *, **, ***, and □, respectively.
FIGURE 7.
FIGURE 7.
The contribution of UCP2 to ERBB2-mediated proliferation is dependent on glucose availability. A, MCF7 cells, transfected with si-UCP2 RNA or scramble control (siCtrl) were grown for 48 h at the indicated glucose concentrations in the presence or absence of NRGβ1 (NRG, 30 nm). Samples are identified in the graph. Proliferation was evaluated by Alamar blue assay (validated by manual cell count). The relative % of reduced dye is provided as the indicator of proliferation. B, at constitutively high glucose levels, the relative inhibition for si-UCP2 samples compared with scramble control is comparable independent of ligand stimulation. By contrast, at alternating glucose concentrations (5, 0, and 25 mm) the inhibition of growth was limited to conditions of ligand stimulation. All error bars represent S.D. p values <0.05, <0.01, <0.005, and >0.9 are *, **, ***, and □, respectively.
FIGURE 8.
FIGURE 8.
Characterization of UCP2 regulation and its consequences in BT474 cells, an ERBB2 gene-amplified breast cancer cell line (1–2 Mio receptors/cell) that is a model system for ERBB2 driven increases in metastasis and sensitivity to the therapeutic anti-ERBB2 antibody (Herceptin). A, comparison of ERBB2 and UCP2 levels as well as associated constitutive signaling in MCF7 and BT474 cells and transiently ERBB2-transfected MCF7 cells (MCF7-T). L and H represent low and high exposure levels needed to convey the vastly different levels of ERBB2 expression in both cell lines. Note that in contrast to stable MCF7-ERBB2 and BT474 cells UCP2 protein in MCF7-T is elevated but not at the levels seen in stable MCF7-ERBB2 or BT474 lines. This is a reflection of the high steady state levels of phosphorylated MAPK in transient expression settings that is not sustained in stable lines. B, ERBB2 overexpression in BT474 results in more than a 10-fold increase in UCP2 mRNA. C, the utilization of the large access of mRNA in BT474 is less efficient than in MCF7 (and MCF7-ERBB2) cells as indicated by a lower protein/mRNA ratio. D, inhibition of ERBB2 signaling results in a rapid decrease in mRNA levels that is not correlated with MAPK activity (compare with E). All mRNA levels are normalized to 18 S rRNA and error bars represent S.E. E, the long term decrease in UCP2 levels in response to Canertinib is more pronounced due to an over dependence on elevated mRNA levels, whereas MAPK inhibition shows a relative increase in UCP2 protein that is comparable with that observed in MCF7 and MCF7-ERBB2 cells. F, the growth of ERBB2 and UCP2 overexpressing BT474 cells is suppressed after UCP2 knockdown, even at physiological glucose concentrations, reflecting a stronger commitment of BT474 cells to glycolytic metabolism. All error bars represent S.D. p values <0.05, <0.01, and <0.005 are *, **, and ***, respectively.
FIGURE 9.
FIGURE 9.
Left, UCP2 regulation as the balance of opposing transcriptional and translational regulation in non-overexpressing cells. Right, time course of changes in UCP2 protein levels and associated changes in mitochondrial OXPHOS. Transcriptional (TS) and translational (TL) regulation of UCP2 are shown relative to ERBB2-mediated and time-delayed systemic transcriptional responses as well as rapid changes in glucose uptake, described first for skeletal muscle (53). Depending on the glucose supply and subsequent up-regulation of GLUT transporter species, glucose supply may be sustained or not. The time window between the rapid relocation of previously synthesized GLUT transporters to the surface and ERBB-initiated transcriptional responses constitutes a potential “adaptation gap” during which mitochondrial activity is transiently reduced, thus favoring anaerobic utilization of glucose and minimizing spikes in ROS production.

Similar articles

Cited by

References

    1. Klingenberg M., Winkler E. (1985) The reconstituted isolated uncoupling protein is a membrane potential driven H+ translocator. EMBO J. 4, 3087–3092 - PMC - PubMed
    1. Winkler E., Klingenberg M. (1994) Effect of fatty acids on H+ transport activity of the reconstituted uncoupling protein. J. Biol. Chem. 269, 2508–2515 - PubMed
    1. Rial E., González-Barroso M., Fleury C., Iturrizaga S., Sanchis D., Jiménez-Jiménez J., Ricquier D., Goubern M., Bouillaud F. (1999) Retinoids activate proton transport by the uncoupling proteins UCP1 and UCP2. EMBO J. 18, 5827–5833 - PMC - PubMed
    1. Nedergaard J., Golozoubova V., Matthias A., Asadi A., Jacobsson A., Cannon B. (2001) UCP1. The only protein able to mediate adaptive non-shivering thermogenesis and metabolic inefficiency. Biochim. Biophys. Acta 1504, 82–106 - PubMed
    1. Divakaruni A. S., Brand M. D. (2011) The regulation and physiology of mitochondrial proton leak. Physiology 26, 192–205 - PubMed

Publication types

MeSH terms