. 2014 Jan;13(1):339-47.
doi: 10.1074/mcp.M113.034769. Epub 2013 Oct 19.

The one hour yeast proteome

Affiliations

The one hour yeast proteome

Alexander S Hebert et al. Mol Cell Proteomics. 2014 Jan.

Abstract

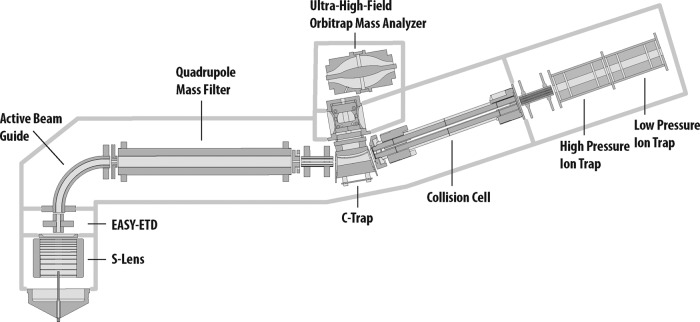
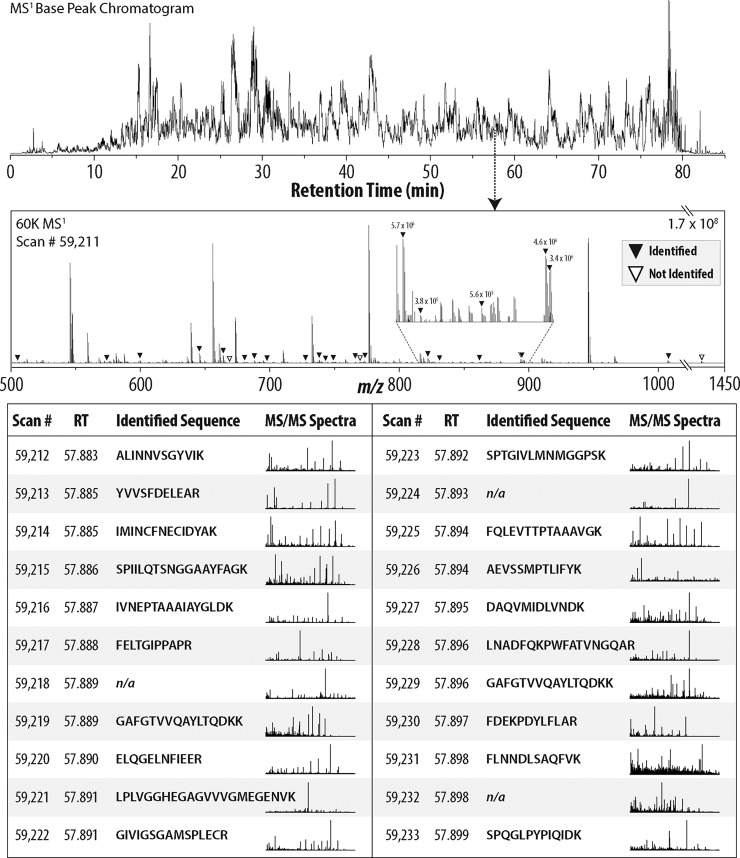
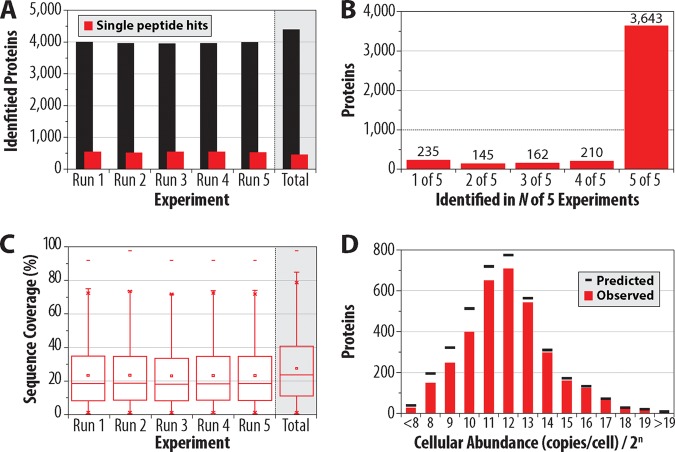
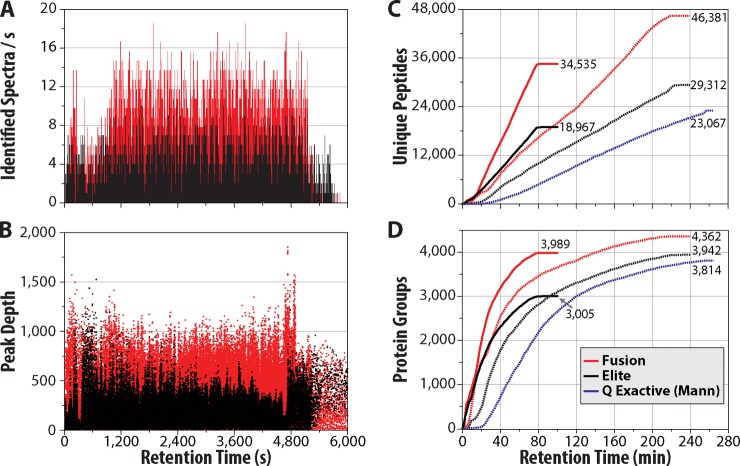
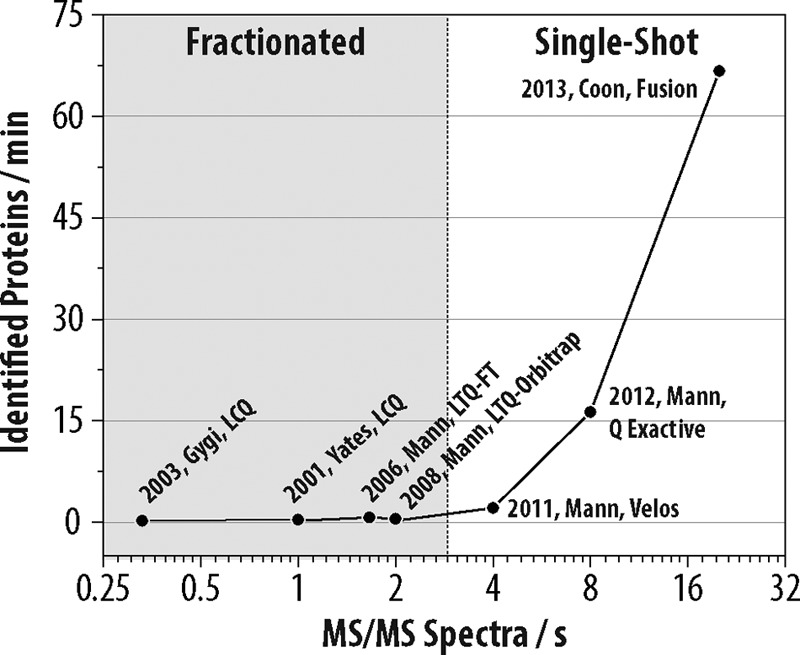
We describe the comprehensive analysis of the yeast proteome in just over one hour of optimized analysis. We achieve this expedited proteome characterization with improved sample preparation, chromatographic separations, and by using a new Orbitrap hybrid mass spectrometer equipped with a mass filter, a collision cell, a high-field Orbitrap analyzer, and, finally, a dual cell linear ion trap analyzer (Q-OT-qIT, Orbitrap Fusion). This system offers high MS(2) acquisition speed of 20 Hz and detects up to 19 peptide sequences within a single second of operation. Over a 1.3 h chromatographic method, the Q-OT-qIT hybrid collected an average of 13,447 MS(1) and 80,460 MS(2) scans (per run) to produce 43,400 (x) peptide spectral matches and 34,255 (x) peptides with unique amino acid sequences (1% false discovery rate (FDR)). On average, each one hour analysis achieved detection of 3,977 proteins (1% FDR). We conclude that further improvements in mass spectrometer scan rate could render comprehensive analysis of the human proteome within a few hours.


Figures

Fig. 1.
Fig. 1.
Schematic of the Q-OT-qIT hybrid mass spectrometer (Fusion). The system differs from previous generations of quadrupole ion trap/Orbitrap hybrids by introduction of a resolving quadrupole mass filter and rearrangement of the geometry to place the linear ion traps to the rear of the collision cell. The reconfigured geometry relieves the linear ion trap of two of its former functions—precursor ion isolation and dissociation. The consequence is both improved and faster operation.
Fig. 2.
Fig. 2.
Overview of Q-OT-qIT scan cycle. At a retention time of 57.88 min scan #59,211, an MS1, was acquired and presented several spectral features for MS2 analysis. Triangles indicate the 22 precursors that were selected for subsequent MS2 sampling—all of which were acquired within 1 s of scan #59,211. 19 of these 22 MS2 spectra were subsequently mapped to sequence.
Fig. 3.
Fig. 3.
Performance metrics for one hour analysis, performed in quintuplicate, of a yeast trypic digest using the Q-OT-qIT hybrid. On average, 3977 yeast proteins were identified in each experiment (1% FDR) with only 13.5% (538, x̄) originating from single peptide identifications (A). 4395 proteins were detected across all experiments—3643 of which were present in all five one hour experiments (B). C, presents the median sequence coverage for the individual and combined experiments. D, displays the overlap in our identified proteins versus known expression level information derived from published tagging experiments.
Fig. 4.
Fig. 4.
Analytical metrics of yeast proteome analysis using the Q-OT-qIT (Fusion) as compared with qIT-OT (Orbitrap Elite) and Q-OT (Q-Exactive) hybrids. The Q-OT-qIT (panel A, red) achieves identification of up to 19 peptides per second as compared with 10 with the qIT-OT system (A, black). Peak depth is likewise considerably higher on account of the faster MS2 scanning rate of the Q-OT-qIT system (B). C, plots the pace of unique yeast peptide identifications for the three instruments. For the one hour analysis, the Q-OT-qIT posts almost twice as many unique peptide identifications as compared with the qIT-OT. Similar data, except for unique proteins, is shown in D.
Fig. 5.
Fig. 5.
Rate of protein identifications as a function of mass spectrometer scan rate for selected large-scale yeast proteome analyses over the past decade. Each data point is annotated with the year, corresponding author, type of MS system used, and reference number.

Similar articles

Cited by

References

    1. Walther T. C., Mann M. (2010) Mass spectrometry–based proteomics in cell biology. J. Cell Biol. 190, 491–500 - PMC - PubMed
    1. Mallick P., Kuster B. (2010) Proteomics: a pragmatic perspective. Nat. Biotechnol. 28, 695–709 - PubMed
    1. Schena M., Shalon D., Davis R. W., Brown P. O. (1995) Quantitative monitoring of gene-expression patterns with a complementary-DNA microarray. Science 270, 467–470 - PubMed
    1. DeRisi J. L., Iyer V. R., Brown P. O. (1997) Exploring the metabolic and genetic control of gene expression on a genomic scale. Science 278, 680–686 - PubMed
    1. Gygi S. P., Rochon Y., Franza B. R., Aebersold R. (1999) Correlation between protein and mRNA abundance in yeast. Mol. Cell. Biol. 19, 1720–1730 - PMC - PubMed

Publication types