Biotic and human vulnerability to projected changes in ocean biogeochemistry over the 21st century
- PMID: 24143135
- PMCID: PMC3797030
- DOI: 10.1371/journal.pbio.1001682
Biotic and human vulnerability to projected changes in ocean biogeochemistry over the 21st century
Abstract
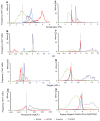
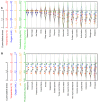
Ongoing greenhouse gas emissions can modify climate processes and induce shifts in ocean temperature, pH, oxygen concentration, and productivity, which in turn could alter biological and social systems. Here, we provide a synoptic global assessment of the simultaneous changes in future ocean biogeochemical variables over marine biota and their broader implications for people. We analyzed modern Earth System Models forced by greenhouse gas concentration pathways until 2100 and showed that the entire world's ocean surface will be simultaneously impacted by varying intensities of ocean warming, acidification, oxygen depletion, or shortfalls in productivity. In contrast, only a small fraction of the world's ocean surface, mostly in polar regions, will experience increased oxygenation and productivity, while almost nowhere will there be ocean cooling or pH elevation. We compiled the global distribution of 32 marine habitats and biodiversity hotspots and found that they would all experience simultaneous exposure to changes in multiple biogeochemical variables. This superposition highlights the high risk for synergistic ecosystem responses, the suite of physiological adaptations needed to cope with future climate change, and the potential for reorganization of global biodiversity patterns. If co-occurring biogeochemical changes influence the delivery of ocean goods and services, then they could also have a considerable effect on human welfare. Approximately 470 to 870 million of the poorest people in the world rely heavily on the ocean for food, jobs, and revenues and live in countries that will be most affected by simultaneous changes in ocean biogeochemistry. These results highlight the high risk of degradation of marine ecosystems and associated human hardship expected in a future following current trends in anthropogenic greenhouse gas emissions.
Conflict of interest statement
The authors have declared that no competing interests exist.
Figures


Comment in
-
A sea of change.PLoS Biol. 2013 Oct;11(10):e1001683. doi: 10.1371/journal.pbio.1001683. Epub 2013 Oct 15. PLoS Biol. 2013. PMID: 24143136 Free PMC article. No abstract available.
Similar articles
-
The Minderoo-Monaco Commission on Plastics and Human Health.Ann Glob Health. 2023 Mar 21;89(1):23. doi: 10.5334/aogh.4056. eCollection 2023. Ann Glob Health. 2023. PMID: 36969097 Free PMC article. Review.
-
From global to regional and back again: common climate stressors of marine ecosystems relevant for adaptation across five ocean warming hotspots.Glob Chang Biol. 2016 Jun;22(6):2038-53. doi: 10.1111/gcb.13247. Epub 2016 Mar 21. Glob Chang Biol. 2016. PMID: 26855008 Free PMC article.
-
Chapter 1. Impacts of the oceans on climate change.Adv Mar Biol. 2009;56:1-150. doi: 10.1016/S0065-2881(09)56001-4. Adv Mar Biol. 2009. PMID: 19895974
-
Impacts of global warming on marine microbial communities.Sci Total Environ. 2021 Oct 15;791:147905. doi: 10.1016/j.scitotenv.2021.147905. Epub 2021 May 21. Sci Total Environ. 2021. PMID: 34126492 Review.
-
Emergent constraint on Arctic Ocean acidification in the twenty-first century.Nature. 2020 Jun;582(7812):379-383. doi: 10.1038/s41586-020-2360-3. Epub 2020 Jun 17. Nature. 2020. PMID: 32555488
Cited by
-
Late Cenozoic cooling restructured global marine plankton communities.Nature. 2023 Feb;614(7949):713-718. doi: 10.1038/s41586-023-05694-5. Epub 2023 Feb 15. Nature. 2023. PMID: 36792824
-
Ecological Energetic Perspectives on Responses of Nitrogen-Transforming Chemolithoautotrophic Microbiota to Changes in the Marine Environment.Front Microbiol. 2017 Jul 14;8:1246. doi: 10.3389/fmicb.2017.01246. eCollection 2017. Front Microbiol. 2017. PMID: 28769878 Free PMC article. Review.
-
Reef-building corals thrive within hot-acidified and deoxygenated waters.Sci Rep. 2017 May 26;7(1):2434. doi: 10.1038/s41598-017-02383-y. Sci Rep. 2017. PMID: 28550297 Free PMC article.
-
From marine park to future genomic observatory? Enhancing marine biodiversity assessments using a biocode approach.Biodivers Data J. 2019 Dec 10;7:e46833. doi: 10.3897/BDJ.7.e46833. eCollection 2019. Biodivers Data J. 2019. PMID: 31866739 Free PMC article.
-
Bioindicators of severe ocean acidification are absent from the end-Permian mass extinction.Sci Rep. 2022 Jan 24;12(1):1202. doi: 10.1038/s41598-022-04991-9. Sci Rep. 2022. PMID: 35075151 Free PMC article.
References
-
- Solomon S, Qin D, Manning M (2007) The Physical Science Basis. Contribution of Working Group I to the Fourth Assessment Report of the Intergovernmental Panel on Climate Change. Geneva. 104 p.
-
- Hoegh-Guldberg O, Bruno JF (2010) The impact of climate change on the world's marine ecosystems. Science 328: 1523–1528. - PubMed
-
- Hoegh-Guldberg O, Mumby PJ, Hooten AJ, Steneck RS, Greenfield P, et al. (2007) Coral reefs under rapid climate change and ocean acidification. Science 318: 1737–1742. - PubMed
-
- Mann ME, Bradley RS, Hughes MK (1998) Global-scale temperature patterns and climate forcing over the past six centuries. Nature 392: 779–787.
-
- Wigley TML, Raper SCB (2001) Interpretation of high projections for global-mean warming. Science 293: 451–454. - PubMed
Publication types
MeSH terms
LinkOut - more resources
Full Text Sources
Other Literature Sources

