

Mortality in Iraq associated with the 2003-2011 war and occupation: findings from a national cluster sample survey by the university collaborative Iraq Mortality Study
- PMID: 24143140
- PMCID: PMC3797136
- DOI: 10.1371/journal.pmed.1001533
Mortality in Iraq associated with the 2003-2011 war and occupation: findings from a national cluster sample survey by the university collaborative Iraq Mortality Study
Abstract
Background: Previous estimates of mortality in Iraq attributable to the 2003 invasion have been heterogeneous and controversial, and none were produced after 2006. The purpose of this research was to estimate direct and indirect deaths attributable to the war in Iraq between 2003 and 2011.
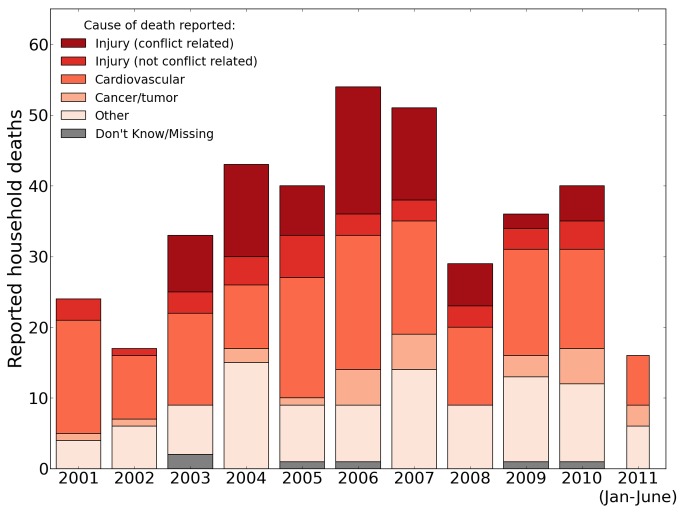
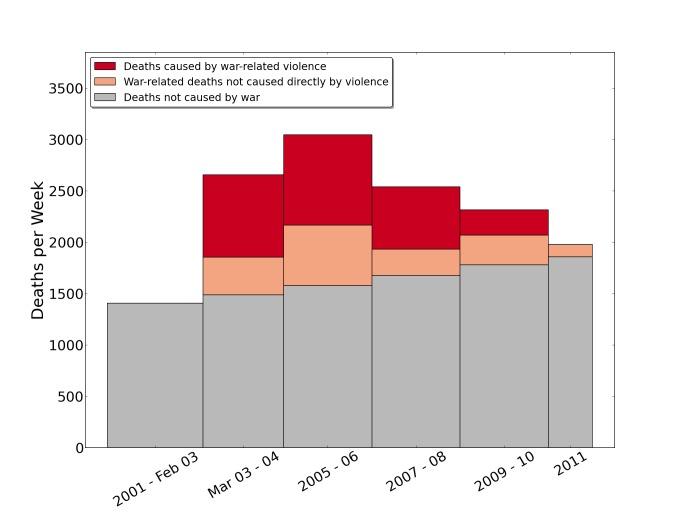
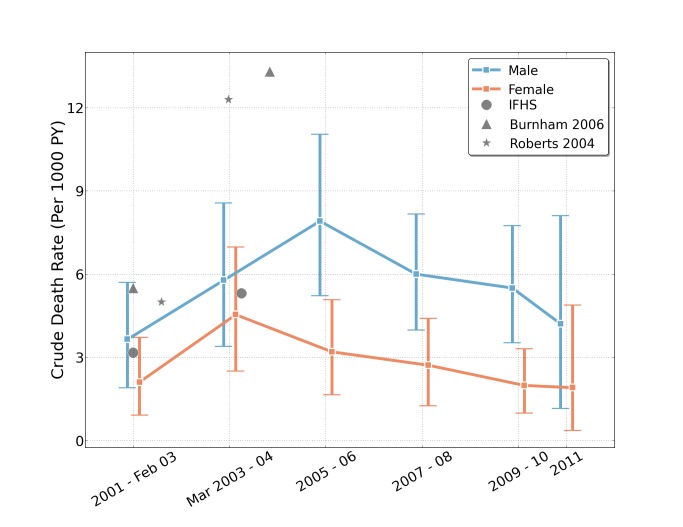
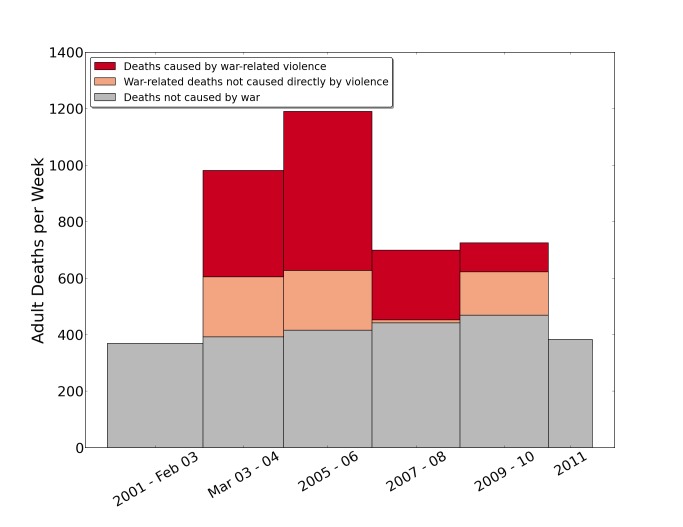
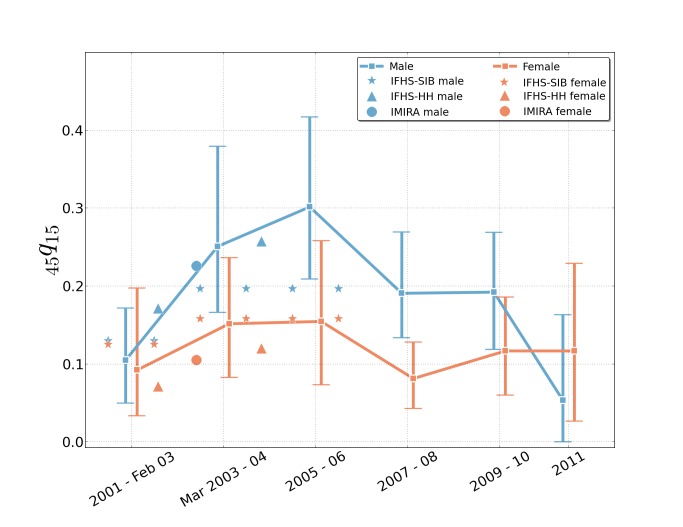
Methods and findings: We conducted a survey of 2,000 randomly selected households throughout Iraq, using a two-stage cluster sampling method to ensure the sample of households was nationally representative. We asked every household head about births and deaths since 2001, and all household adults about mortality among their siblings. We used secondary data sources to correct for out-migration. From March 1, 2003, to June 30, 2011, the crude death rate in Iraq was 4.55 per 1,000 person-years (95% uncertainty interval 3.74-5.27), more than 0.5 times higher than the death rate during the 26-mo period preceding the war, resulting in approximately 405,000 (95% uncertainty interval 48,000-751,000) excess deaths attributable to the conflict. Among adults, the risk of death rose 0.7 times higher for women and 2.9 times higher for men between the pre-war period (January 1, 2001, to February 28, 2003) and the peak of the war (2005-2006). We estimate that more than 60% of excess deaths were directly attributable to violence, with the rest associated with the collapse of infrastructure and other indirect, but war-related, causes. We used secondary sources to estimate rates of death among emigrants. Those estimates suggest we missed at least 55,000 deaths that would have been reported by households had the households remained behind in Iraq, but which instead had migrated away. Only 24 households refused to participate in the study. An additional five households were not interviewed because of hostile or threatening behavior, for a 98.55% response rate. The reliance on outdated census data and the long recall period required of participants are limitations of our study.
Conclusions: Beyond expected rates, most mortality increases in Iraq can be attributed to direct violence, but about a third are attributable to indirect causes (such as from failures of health, sanitation, transportation, communication, and other systems). Approximately a half million deaths in Iraq could be attributable to the war. Please see later in the article for the Editors' Summary.
Conflict of interest statement
The authors have declared that no competing interests exist.
Figures


Comment in
-
The 2003 Iraq War and avoidable death toll.PLoS Med. 2013 Oct;10(10):e1001532. doi: 10.1371/journal.pmed.1001532. Epub 2013 Oct 15. PLoS Med. 2013. PMID: 24143139 Free PMC article.
Similar articles
-
Mortality before and after the 2003 invasion of Iraq: cluster sample survey.Lancet. 2004 Nov 20-26;364(9448):1857-64. doi: 10.1016/S0140-6736(04)17441-2. Lancet. 2004. PMID: 15555665
-
Injury and death during the ISIS occupation of Mosul and its liberation: Results from a 40-cluster household survey.PLoS Med. 2018 May 15;15(5):e1002567. doi: 10.1371/journal.pmed.1002567. eCollection 2018 May. PLoS Med. 2018. PMID: 29763433 Free PMC article.
-
Violence-related mortality in Iraq from 2002 to 2006.N Engl J Med. 2008 Jan 31;358(5):484-93. doi: 10.1056/NEJMsa0707782. Epub 2008 Jan 9. N Engl J Med. 2008. PMID: 18184950
-
[Mortality after the 2003 invasion of Iraq: a cross sectional cluster sample survey].Epidemiol Prev. 2006 Nov-Dec;30(6):316-7. Epidemiol Prev. 2006. PMID: 17333681 Review. Italian. No abstract available.
-
A review of the cluster survey sampling method in humanitarian emergencies.Public Health Nurs. 2008 Jul-Aug;25(4):370-4. doi: 10.1111/j.1525-1446.2008.00719.x. Public Health Nurs. 2008. PMID: 18666943 Review.
Cited by
-
Mortality and kidnapping estimates for the Yazidi population in the area of Mount Sinjar, Iraq, in August 2014: A retrospective household survey.PLoS Med. 2017 May 9;14(5):e1002297. doi: 10.1371/journal.pmed.1002297. eCollection 2017 May. PLoS Med. 2017. PMID: 28486492 Free PMC article.
-
Deaths due to Intentional Explosions in Selected Governorates of Iraq from 2010 to 2013: Prospective Surveillance.Prehosp Disaster Med. 2015 Dec;30(6):586-92. doi: 10.1017/S1049023X15005300. Epub 2015 Oct 30. Prehosp Disaster Med. 2015. PMID: 26517290 Free PMC article.
-
The violent death toll from the Iraq War: 2003-2023.PLoS One. 2024 Feb 27;19(2):e0297895. doi: 10.1371/journal.pone.0297895. eCollection 2024. PLoS One. 2024. PMID: 38412174 Free PMC article.
-
The effects of armed conflict on the health of women and children.Lancet. 2021 Feb 6;397(10273):522-532. doi: 10.1016/S0140-6736(21)00131-8. Epub 2021 Jan 24. Lancet. 2021. PMID: 33503456 Free PMC article. Review.
-
Improving retrospective data on recent household deaths: a multi-arm randomized trial in Guinea-Bissau.Int J Epidemiol. 2025 Feb 16;54(2):dyaf009. doi: 10.1093/ije/dyaf009. Int J Epidemiol. 2025. PMID: 39993265 Free PMC article. Clinical Trial.
References
-
- Bird SM (2004) Military and public-health sciences need to ally. Lancet 364: 1831–1833. - PubMed
-
- Greer B (2009) Estimating Iraqi deaths: a case study with implications for mathematics education. ZDM 41: 105–116.
-
- Karagiozakis M (2009) Counting excess civilian casualties of the Iraq War: science or politics? The Journal of Humanitarian Assistance Available: http://sites.tufts.edu/jha/archives/559. Accessed 10 September 2013.
-
- Johnson NF, Gourley S, Onnela J-P, Reinert G (2008) Bias in epidemiological studies of conflict mortality. J Peace Res 45: 653–663.
Publication types
MeSH terms
Grants and funding
LinkOut - more resources
Full Text Sources
Other Literature Sources
