

Long-term functional outcomes and correlation with regional brain connectivity by MRI diffusion tractography metrics in a near-term rabbit model of intrauterine growth restriction
- PMID: 24143189
- PMCID: PMC3797044
- DOI: 10.1371/journal.pone.0076453
Long-term functional outcomes and correlation with regional brain connectivity by MRI diffusion tractography metrics in a near-term rabbit model of intrauterine growth restriction
Abstract
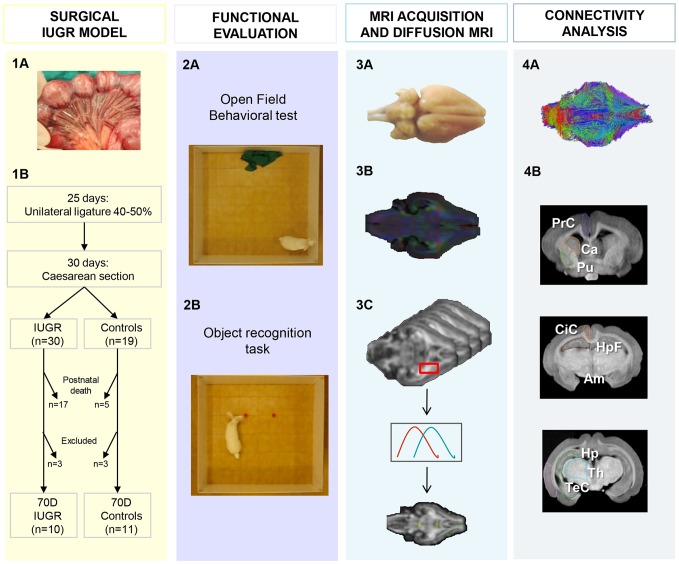
Background: Intrauterine growth restriction (IUGR) affects 5-10% of all newborns and is associated with increased risk of memory, attention and anxiety problems in late childhood and adolescence. The neurostructural correlates of long-term abnormal neurodevelopment associated with IUGR are unknown. Thus, the aim of this study was to provide a comprehensive description of the long-term functional and neurostructural correlates of abnormal neurodevelopment associated with IUGR in a near-term rabbit model (delivered at 30 days of gestation) and evaluate the development of quantitative imaging biomarkers of abnormal neurodevelopment based on diffusion magnetic resonance imaging (MRI) parameters and connectivity.
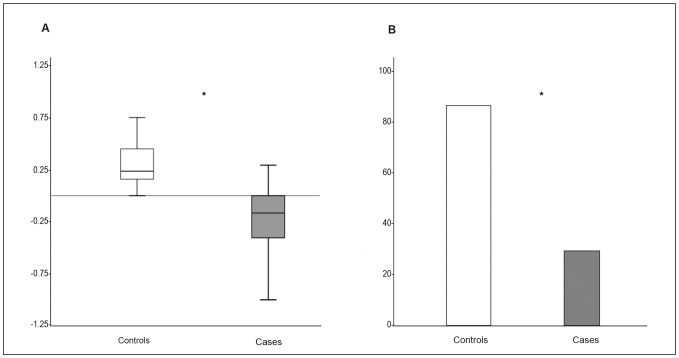
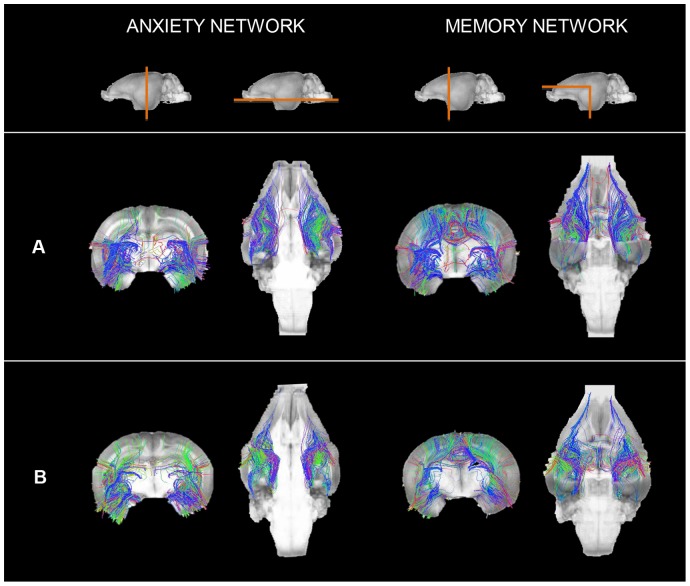
Methodology: At +70 postnatal days, 10 cases and 11 controls were functionally evaluated with the Open Field Behavioral Test which evaluates anxiety and attention and the Object Recognition Task that evaluates short-term memory and attention. Subsequently, brains were collected, fixed and a high resolution MRI was performed. Differences in diffusion parameters were analyzed by means of voxel-based and connectivity analysis measuring the number of fibers reconstructed within anxiety, attention and short-term memory networks over the total fibers.
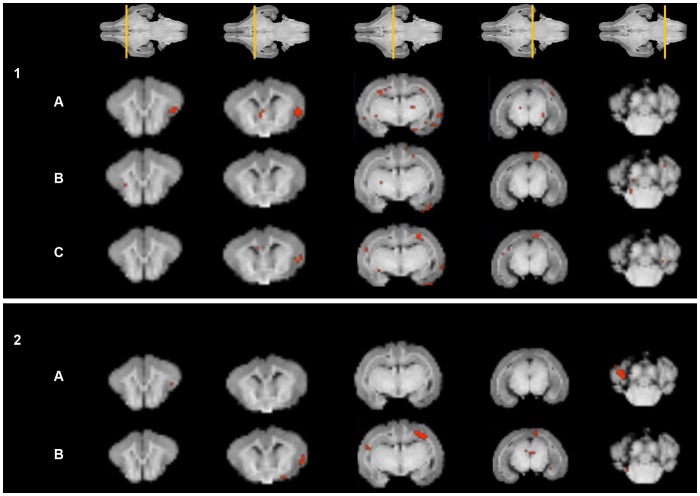
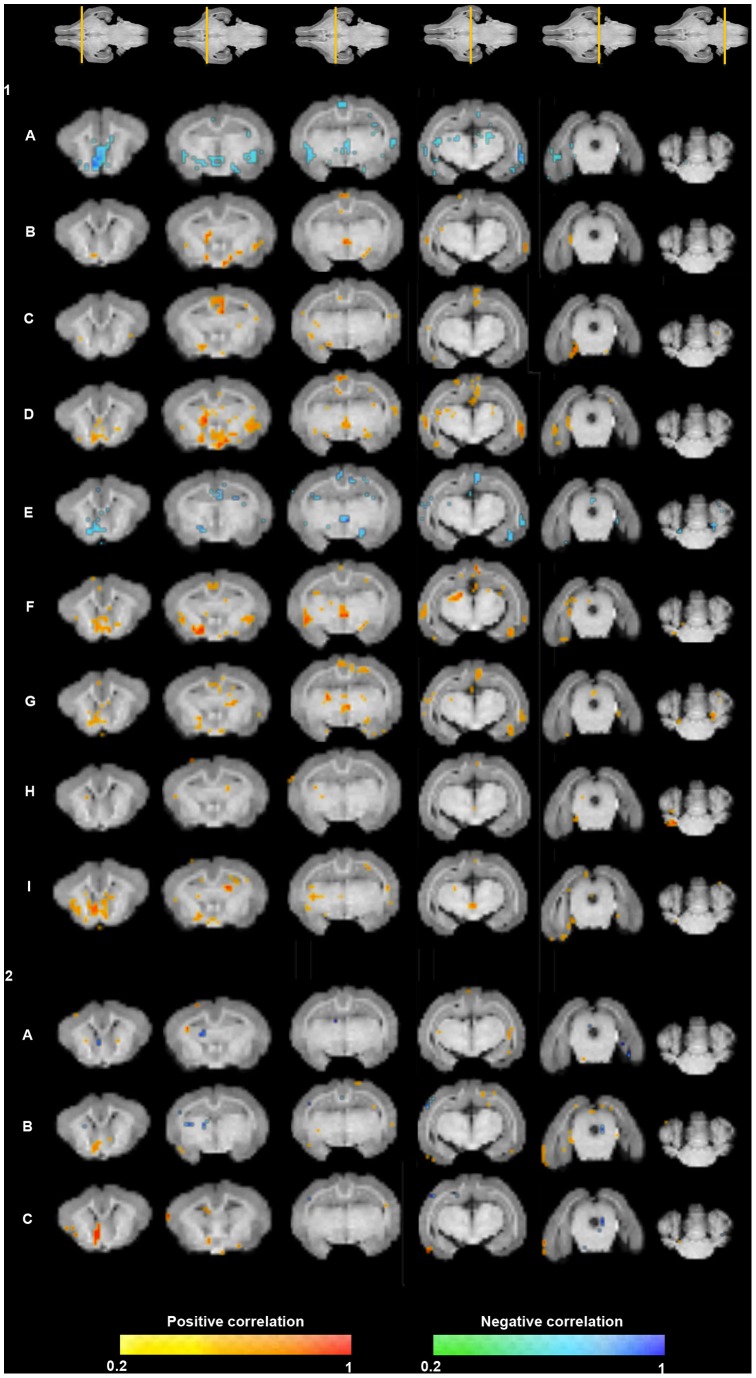
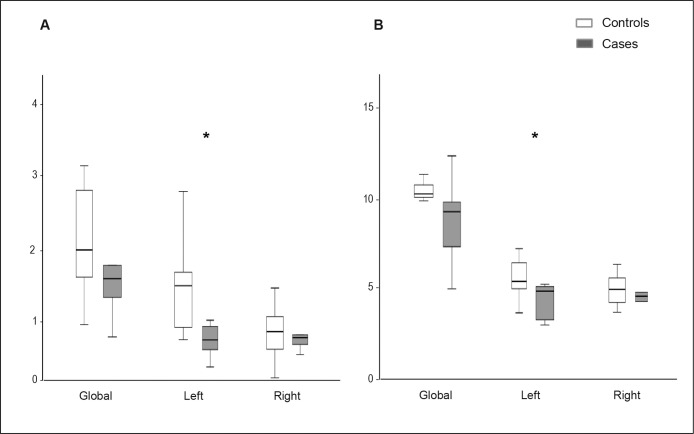
Principal findings: The results of the neurobehavioral and cognitive assessment showed a significant higher degree of anxiety, attention and memory problems in cases compared to controls in most of the variables explored. Voxel-based analysis (VBA) revealed significant differences between groups in multiple brain regions mainly in grey matter structures, whereas connectivity analysis demonstrated lower ratios of fibers within the networks in cases, reaching the statistical significance only in the left hemisphere for both networks. Finally, VBA and connectivity results were also correlated with functional outcome.
Conclusions: The rabbit model used reproduced long-term functional impairments and their neurostructural correlates of abnormal neurodevelopment associated with IUGR. The description of the pattern of microstructural changes underlying functional defects may help to develop biomarkers based in diffusion MRI and connectivity analysis.
Conflict of interest statement
Figures
Similar articles
-
Neonatal neurobehavior and diffusion MRI changes in brain reorganization due to intrauterine growth restriction in a rabbit model.PLoS One. 2012;7(2):e31497. doi: 10.1371/journal.pone.0031497. Epub 2012 Feb 8. PLoS One. 2012. PMID: 22347486 Free PMC article.
-
Early Environmental Enrichment Enhances Abnormal Brain Connectivity in a Rabbit Model of Intrauterine Growth Restriction.Fetal Diagn Ther. 2018;44(3):184-193. doi: 10.1159/000481171. Epub 2017 Oct 12. Fetal Diagn Ther. 2018. PMID: 29020672
-
Long-term reorganization of structural brain networks in a rabbit model of intrauterine growth restriction.Neuroimage. 2014 Oct 15;100:24-38. doi: 10.1016/j.neuroimage.2014.05.065. Epub 2014 Jun 2. Neuroimage. 2014. PMID: 24943271
-
Programming the brain: Common outcomes and gaps in knowledge from animal studies of IUGR.Physiol Behav. 2016 Oct 1;164(Pt A):233-48. doi: 10.1016/j.physbeh.2016.06.005. Epub 2016 Jun 7. Physiol Behav. 2016. PMID: 27288225 Review.
-
Models of Intrauterine growth restriction and fetal programming in rabbits.Mol Reprod Dev. 2019 Dec;86(12):1781-1809. doi: 10.1002/mrd.23271. Epub 2019 Sep 20. Mol Reprod Dev. 2019. PMID: 31538701 Review.
Cited by
-
In Vivo Detection of Perinatal Brain Metabolite Changes in a Rabbit Model of Intrauterine Growth Restriction (IUGR).PLoS One. 2015 Jul 24;10(7):e0131310. doi: 10.1371/journal.pone.0131310. eCollection 2015. PLoS One. 2015. PMID: 26208165 Free PMC article.
-
Quantitative Evaluation of Rabbit Brain Injury after Cerebral Hemisphere Radiation Exposure Using Generalized q-Sampling Imaging.PLoS One. 2015 Jul 13;10(7):e0133001. doi: 10.1371/journal.pone.0133001. eCollection 2015. PLoS One. 2015. PMID: 26168047 Free PMC article.
-
Rabbit neurospheres as a novel in vitro tool for studying neurodevelopmental effects induced by intrauterine growth restriction.Stem Cells Transl Med. 2021 Feb;10(2):209-221. doi: 10.1002/sctm.20-0223. Epub 2020 Oct 9. Stem Cells Transl Med. 2021. PMID: 33034168 Free PMC article.
-
Severe intraventricular hemorrhage causes long-lasting structural damage in a preterm rabbit pup model.Pediatr Res. 2022 Aug;92(2):403-414. doi: 10.1038/s41390-022-02075-y. Epub 2022 May 3. Pediatr Res. 2022. PMID: 35505079 Free PMC article.
-
The Effects of Hesperidin on BDNF/TrkB Signaling Pathway and Oxidative Stress Parameters in the Cerebral Cortex of the Utero-placental Insufficiency Fetal Rat Model.Basic Clin Neurosci. 2021 Jul-Aug;12(4):511-522. doi: 10.32598/bcn.2021.2187.1. Epub 2021 Jul 1. Basic Clin Neurosci. 2021. PMID: 35154591 Free PMC article.
References
-
- Marsal K (2002) Intrauterine growth restriction. Curr Opin Obstet Gynecol 14: 127–135. - PubMed
-
- Balasch J, Gratacos E (2011) Delayed Childbearing: Effects on Fertility and the Outcome of Pregnancy. Fetal Diagn Ther 29: 263–273. - PubMed
-
- Rees S, Harding R, Walker D (2007) An adverse intrauterine environment: implications for injury and altered development of the brain. Int J Dev Neurosci 26: 3–11. - PubMed
-
- Figueras F, Oros D, Cruz-Martinez R, Padilla N, Hernandez-Andrade E, et al. (2009) Neurobehavior in term, small-for-gestational age infants with normal placental function. Pediatrics 124: e934–941. - PubMed
-
- Bassan H, Stolar O, Geva R, Eshel R, Fattal-Valevski A, et al. (2011) Intrauterine growth-restricted neonates born at term or preterm: how different? Pediatr Neurol 44: 122–130. - PubMed
Publication types
MeSH terms
LinkOut - more resources
Full Text Sources
Other Literature Sources
