. 2013 Oct 15;8(10):e77641.
doi: 10.1371/journal.pone.0077641. eCollection 2013.

Reliability of school surveys in estimating geographic variation in malaria transmission in the western Kenyan highlands

Affiliations

Reliability of school surveys in estimating geographic variation in malaria transmission in the western Kenyan highlands

Jennifer C Stevenson et al. PLoS One. .

Abstract

Background: School surveys provide an operational approach to assess malaria transmission through parasite prevalence. There is limited evidence on the comparability of prevalence estimates obtained from school and community surveys carried out at the same locality.

Methods: Concurrent school and community cross-sectional surveys were conducted in 46 school/community clusters in the western Kenyan highlands and households of school children were geolocated. Malaria was assessed by rapid diagnostic test (RDT) and combined seroprevalence of antibodies to bloodstage Plasmodium falciparum antigens.

Results: RDT prevalence in school and community populations was 25.7% (95% CI: 24.4-26.8) and 15.5% (95% CI: 14.4-16.7), respectively. Seroprevalence in the school and community populations was 51.9% (95% CI: 50.5-53.3) and 51.5% (95% CI: 49.5-52.9), respectively. RDT prevalence in schools could differentiate between low (<7%, 95% CI: 0-19%) and high (>39%, 95% CI: 25-49%) transmission areas in the community and, after a simple adjustment, were concordant with the community estimates.

Conclusions: Estimates of malaria prevalence from school surveys were consistently higher than those from community surveys and were strongly correlated. School-based estimates can be used as a reliable indicator of malaria transmission intensity in the wider community and may provide a basis for identifying priority areas for malaria control.


Conflict of interest statement

Competing Interests: The authors have declared that no competing interests exist.

Figures

Figure 1
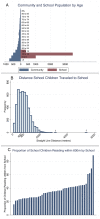
Figure 1. Characteristics of the study population – age and distance travelled to school.
(A) A population pyramid showing the age distribution of those sampled in the community survey compared to those sampled during the school survey. (B) Histogram depicting the distance between the school and compound where each child resides. (C) The proportion of children sampled at each school that reside within 600m of the school.
Figure 2
Figure 2. Spatial distribution of school study participants, location of the schools, and community catchment area.
Each point represents the compound of a child included in the study. The black crosses indicate the location of each school that was included in the survey. The black circular outline corresponds to the area with a 600m radius around each school and thus represents the community catchment area sampled during the community survey.
Figure 3
Figure 3. Prevalence of malaria infection in school vs. community surveys in 46 clusters by RDT and serology.
Scatter plots are shown with the line of perfect concordance (x=y) and the data’s reduced major axis using total least squares regression. (A) RDT prevalence per cluster in community vs. all school children. (B) RDT prevalence per cluster in community vs. school children residing within 600m from school. (C) Seroprevalence per cluster in community vs. all school children. (D) Seroprevalence per cluster in community vs. school children residing within 600m from school.
Figure 4
Figure 4. Age-adjusted seroprevalence in community and school surveys (all children) by transmission intensity.
The age-adjusted community seroconversion curves (solid) and school aged population (dashed lines). The different transmission intensities are represented as: high (red) moderate (green) and low (blue).
Figure 5
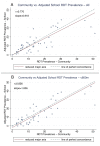
Figure 5. Prevalence of malaria infection: adjusted school vs. community surveys in 46 clusters by RDT and serology.
Scatter plots are shown with the line of perfect concordance (x=y) and the data’s reduced major axis using total least squares regression. (A) RDT prevalence per cluster in community vs. adjusted prevalence in all school children. (B) RDT prevalence per cluster in community vs. adjusted school prevalence restricting to children residing within 600m from school.

References

    1. Hay SI, Smith DL, Snow RW (2008) Measuring malaria endemicity from intense to interrupted transmission. Lancet Infect Dis 8: 369-378. doi:10.1016/S1473-3099(08)70069-0. PubMed: 18387849. - DOI - PMC - PubMed
    1. Snow RW, Amratia P, Kabaria CW, Noor AM, Marsh K (2012) The changing limits and incidence of malaria in Africa: 1939-2009. Adv Parasitol 78: 169-262. doi:10.1016/B978-0-12-394303-3.00010-4. PubMed: 22520443. - DOI - PMC - PubMed
    1. Cox J, Hay SI, Abeku TA, Checchi F, Snow RW (2007) The uncertain burden of Plasmodium falciparum epidemics in Africa. Trends Parasitol 23(4): 142-148. doi:10.1016/j.pt.2007.02.002. PubMed: 17306624. - DOI - PMC - PubMed
    1. Satoguina J, Walther B, Drakeley C, Nwakanma D, Oriero EC et al. (2009) Comparison of surveillance methods applied to a situation of low malaria prevalence at rural sites in The Gambia and Guinea Bissau. Malar J 8: 274. doi:10.1186/1475-2875-8-274. PubMed: 19954532. - DOI - PMC - PubMed
    1. Greenhouse B, Ho B, Hubbard A, Njama-Meya D, Narum DL et al. (2011) Antibodies to Plasmodium falciparum antigens predict a higher risk of malaria but protection from symptoms once parasitemic. J Infect Dis 204(1): 19-26. doi:10.1093/infdis/jir223. PubMed: 21628654. - DOI - PMC - PubMed

Publication types