. 2013 Oct 15;8(10):e77700.
doi: 10.1371/journal.pone.0077700. eCollection 2013.

Combining different mRNA capture methods to analyze the transcriptome: analysis of the Xenopus laevis transcriptome

Affiliations

Combining different mRNA capture methods to analyze the transcriptome: analysis of the Xenopus laevis transcriptome

Michael D Blower et al. PLoS One. .

Abstract

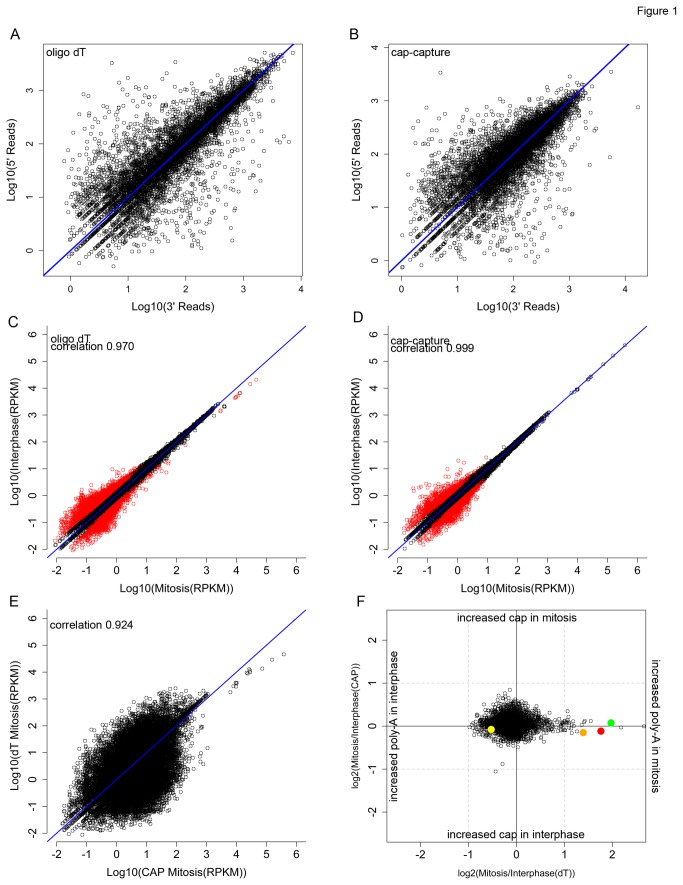
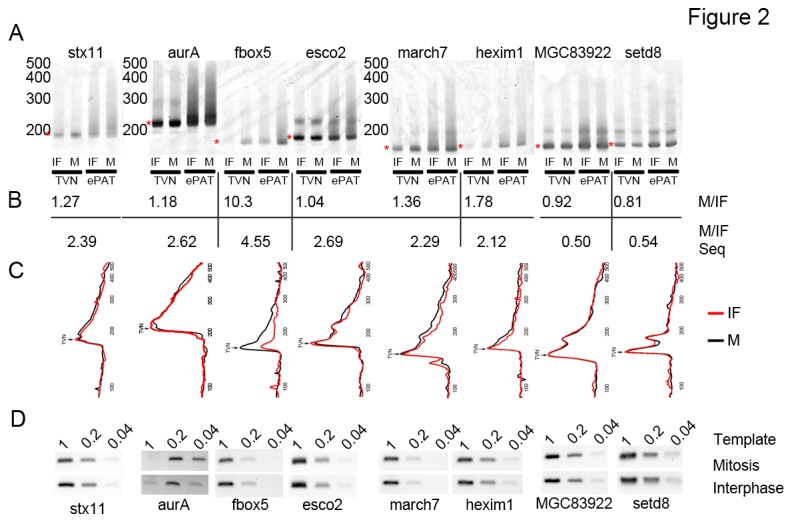
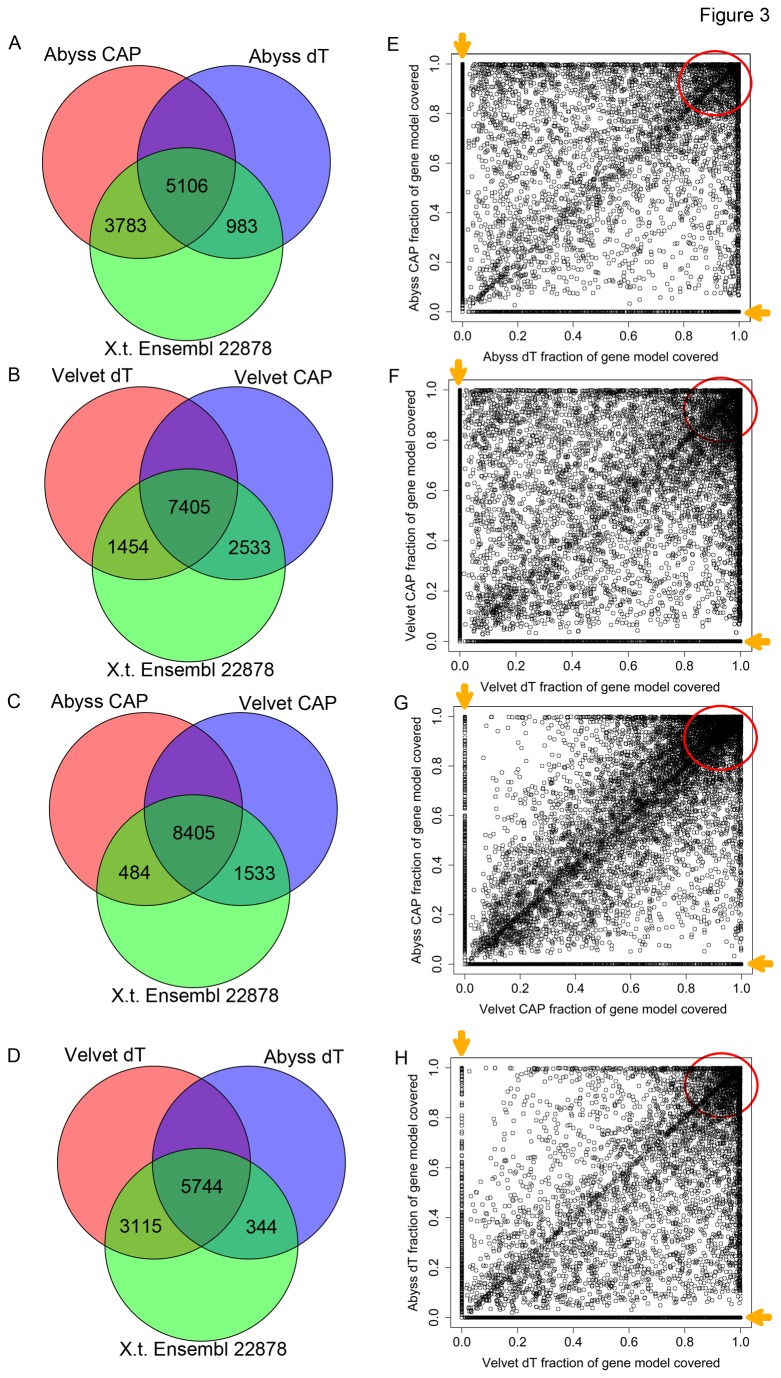
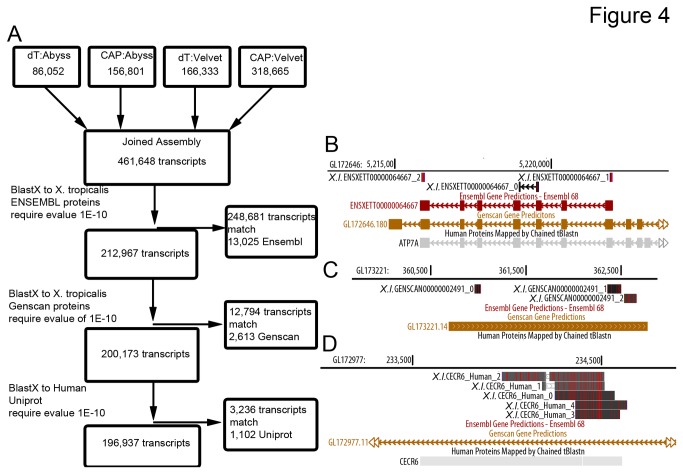
mRNA sequencing (mRNA-seq) is a commonly used technique to survey gene expression from organisms with fully sequenced genomes. Successful mRNA-seq requires purification of mRNA away from the much more abundant ribosomal RNA, which is typically accomplished by oligo-dT selection. However, mRNAs with short poly-A tails are captured poorly by oligo-dT based methods. We demonstrate that combining mRNA capture via oligo-dT with mRNA capture by the 5' 7-methyl guanosine cap provides a more complete view of the transcriptome and can be used to assay changes in mRNA poly-A tail length on a genome-wide scale. We also show that using mRNA-seq reads from both capture methods as input for de novo assemblers provides a more complete reconstruction of the transcriptome than either method used alone. We apply these methods of mRNA capture and de novo assembly to the transcriptome of Xenopus laevis, a well-studied frog that currently lacks a finished sequenced genome, to discover transcript sequences for thousands of mRNAs that are currently absent from public databases. The methods we describe here will be broadly applicable to many organisms and will provide insight into the transcriptomes of organisms with sequenced and unsequenced genomes.


Conflict of interest statement

Competing Interests: The authors have declared that no competing interests exist.

Figures

Figure 1
Figure 1. Comparison or mRNA-seq libraries from oligo-dT and Cap-captured mRNA.
A-B. Reads from dT or Cap-capture prepared libraries were aligned to sequences consisting of the 5’ or 3’ 25% of Refseq mRNAs. Reads aligning to the 5’ and 3’ portions of the transcript are plotted. Blue line indicates a ratio of one. C. Reads from mRNA-seq libraries prepared using oligo-dT captured mRNAs from mitotic and interphase Xenopus egg extract were aligned to the Xenopus laevis Unigene database. Relative abundance of each mRNA in mitotic and interphase extracts is plotted. Red points highlight two-fold differences between mitotic and interphase samples. D. Same experiment as in panel C except that the mRNAs were purified using Cap-capture prior to library preparation. Red points highlight two-fold differences. E. Scatterplot of mRNA abundance in oligo-dT-captured and Cap-captured mRNA libraries. F. The ratio of reads per mRNA in mitotic and interphase extracts are plotted for oligo-dT captured mRNAs (X-axis, data from panel A) and cap-captured mRNAs (Y-axis data from panel B). The colored points correspond to mRNAs with known changes in poly-A tail length (cdk1, green; Eg2/aurora-a, orange; mos, red; Xlcl1, yellow). Quadrants highlight two-fold differences between samples.
Figure 2
Figure 2. Poly-A tail analysis of selected mRNAs.
mRNAs that exhibited changes in Mitosis:Interphase (M:IF) abundance ratios in oligo-dT-captured samples, but not in Cap-captured samples were analyzed for poly-A tail length using the ePAT assay and anchored TVN reverse transcription controls. A. Six mRNAs with high M:IF ratios (aurora-a, esco2, fbox5, stx11, march7, and hexim1) showed longer poly-A tails in mitotic extract. Two mRNA (setd8 and MGC83922) with a low M:IF ratio showed very modest changes in poly-A tail lengths between Mitosis and Interphase. Red asterix indicates the position of the prominent TVN PCR product that is quantified in B. B. The amount of PCR product contained in the TVN-RT PCR reactions (red asterix in A) were quantified. The ratio of the amount of PCR product in Mitotic to Interphase extracts is presented in the first line. The ratio of each mRNA in Mitotic and Interphase extracts as determined by RNA-seq is presented below the PCR derived ratios for comparison. In addition five mRNAs with high M:IF ratios (aurora-1, fbox5, stx11, march7, and hexim1) had increased amounts of minimal poly-A tail PCR products in mitosis compared to interphase in TVN controls (quantified below gel) while both setd8 and MGC88922 had higher levels of TVN PCR products in interphase compared to mitotic extracts TVN PCR products indicate mRNAs with poly-A tails of 18 As. Line traces of ePAT PCR reactions presented in panel A. Black lines indicate traces from mitotic extract and red lines indicate traces from interaphse extract. D. Semi-quantitative PCR for each of the mRNAs tested in A was performed on RNA from mitotic and interphase extracts. Random hexamers were used to prime reverse transcription for these reactions. A second experiment showing very similar results is present in Figure S2.
Figure 3
Figure 3. Comparison of de novo transcriptome assemblies.
A. Transcripts assembled by the Abyss assembler from oligo-dT and Cap-captured mRNA libraries were aligned to the X. tropicalis ENSEMBL annotated transcripts using BlastX. The number of ENSEMBL transcripts that were matched by each assembler:library pair are represented as a Venn Diagram. The number of transcripts present in each assembler:library pair are listed in Table 2. Because multiple sequences from each de novo assembly align to X. tropicalis genes these numbers are omitted from the figure for the sake of simplicity. B. Same comparison as in A, except that Velvet was used as the assembler instead of Abyss. C. Transcripts assembled by Abyss or Velvet from Cap-capture mRNA libraries were aligned to the X. tropicalis ENSEMBL transcripts using BLAT. Unique and common ENSEMBL transcripts are represented by a Venn Diagram D. Same comparison as in C, except that dT libraries are compared instead of Cap-captured libraries. E-H. Fraction of each ENSEMBL transcript covered by transcripts assembled using indicated assembler:library pair (from A-D) was calculated.
Figure 4
Figure 4. Overview of combined X. laevis transcriptome.
A. Sequences from each assembler:library pair were combined. Transcripts from this combined library were sequentially aligned to X. tropicalis (Xt) ENSEMBL transcripts, X. tropicalis Genscan transcripts, and human Uniprot proteins using BLASTX. The number of transcripts that matched to each annotation source and the number of annotated transcripts that were matched are indicated. B. UCSC genome browser view that demonstrates clustering of transcript fragments by using the annotated ENSEMBL transcript as a scaffold. C. UCSC genome browser view of transcript clustering of transcripts that match to a GENSCAN gene prediction. D. Example of several transcripts that match to an annotated human protein while there are no predicted X. tropicalis transcripts.
Figure 5
Figure 5. Analysis of unannotated transcripts in X. laevis.
A. Transcripts remaining after alignment to several sources of annotated genes (in Figure 4A) were analyzed for protein coding potential using Orfpredictor. Plot shows that length of the longest ORF compared to the length of the mRNA sequence, blue diagonal line indicates a transcript that is completely composed of a potential ORF. Horizontal line highlighted with a green arrow indicates sequences with no protein coding potential. B. Same plot as in A, but sequences that matches to annotated X. laevis Refseq transcript 3’UTR sequences are highlighted in red.

Similar articles

Cited by

References

    1. Harland RM, Grainger RM (2011) Xenopus research: metamorphosed by genetics and genomics. Trends Genet 27: 507-515. doi:10.1016/j.tig.2011.08.003. PubMed: 21963197. - DOI - PMC - PubMed
    1. Hellsten U, Harland RM, Gilchrist MJ, Hendrix D, Jurka J et al. (2010) The genome of the Western clawed frog Xenopus tropicalis. Science 328: 633-636. doi:10.1126/science.1183670. PubMed: 20431018. - DOI - PMC - PubMed
    1. Guigó R, Flicek P, Abril JF, Reymond A, Lagarde J et al. (2006) EGASP: the human ENCODE Genome Annotation Assessment Project. Genome Biol 7 Suppl 1: 1 31. doi:10.1186/gb-2006-7-1-r1. PubMed: 16925836. - DOI - PMC - PubMed
    1. Gilchrist MJ (2012) From expression cloning to gene modeling: the development of Xenopus gene sequence resources. Genesis 50: 143-154. doi:10.1002/dvg.22008. PubMed: 22344767. - DOI - PMC - PubMed
    1. Richter JD (1991) Translational control during early development. Bioessays 13: 179-183. doi:10.1002/bies.950130406. PubMed: 1859396. - DOI - PubMed

MeSH terms