. 2013 Jul 26;2(9):941-51.
doi: 10.1242/bio.20135215. eCollection 2013.

Functional coupling between large-conductance potassium channels and Cav3.2 voltage-dependent calcium channels participates in prostate cancer cell growth

Affiliations

Functional coupling between large-conductance potassium channels and Cav3.2 voltage-dependent calcium channels participates in prostate cancer cell growth

Florian Gackière et al. Biol Open. .

Abstract

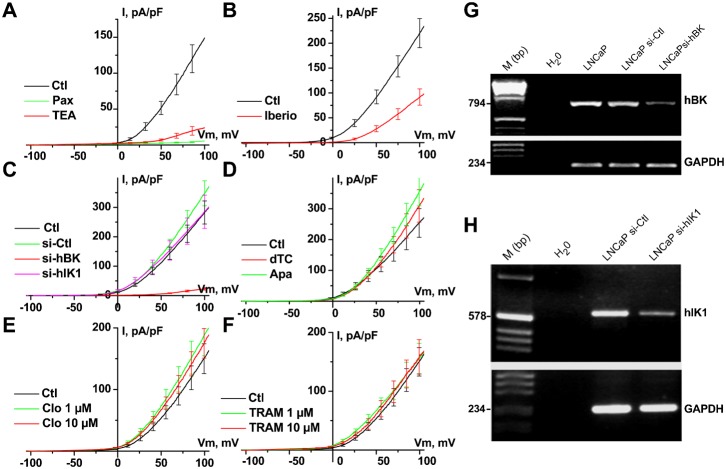
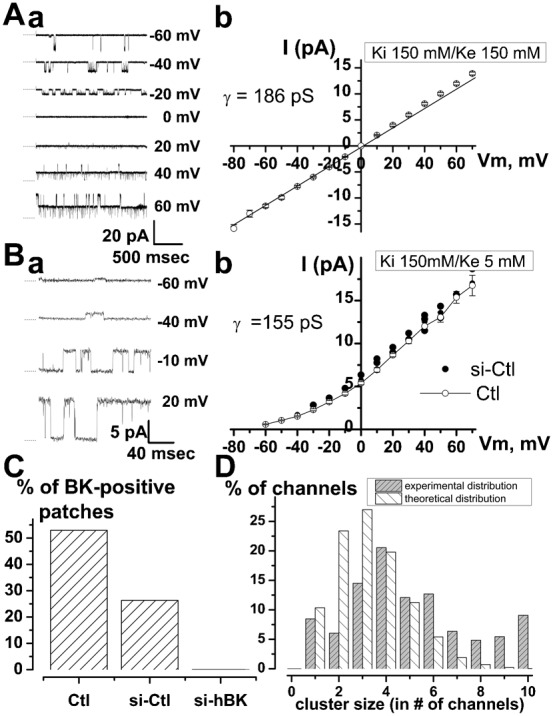
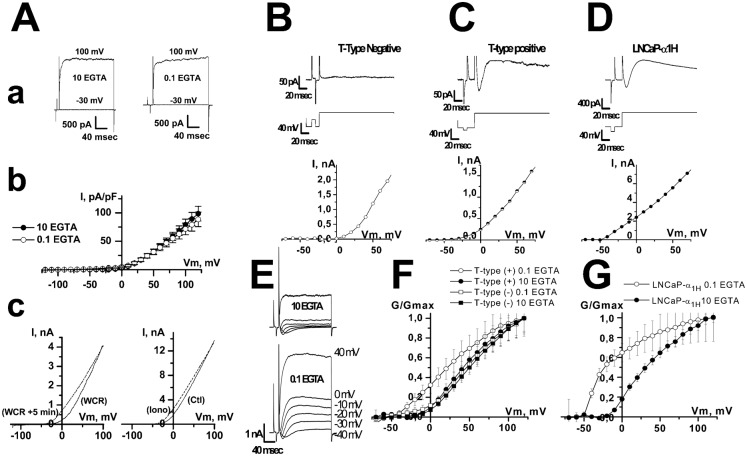
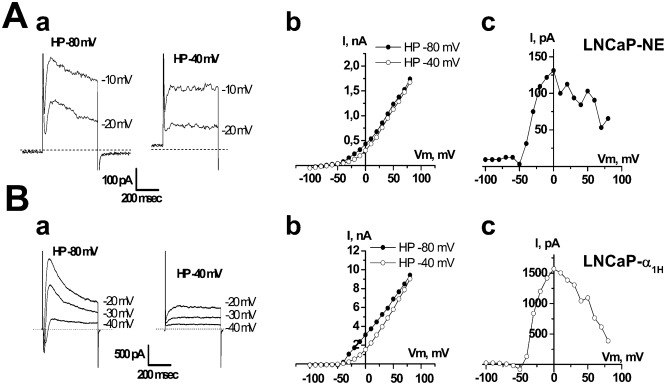
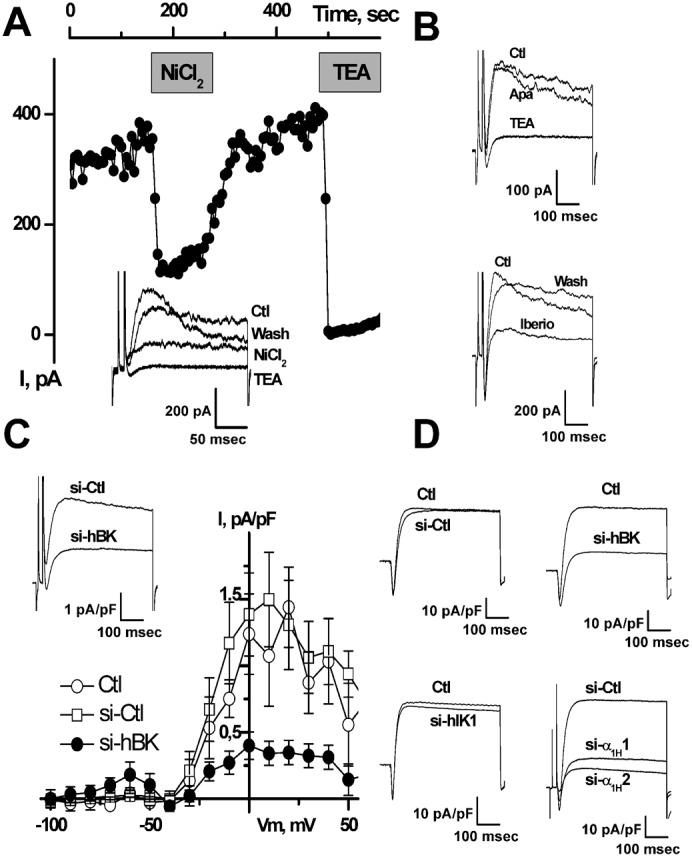
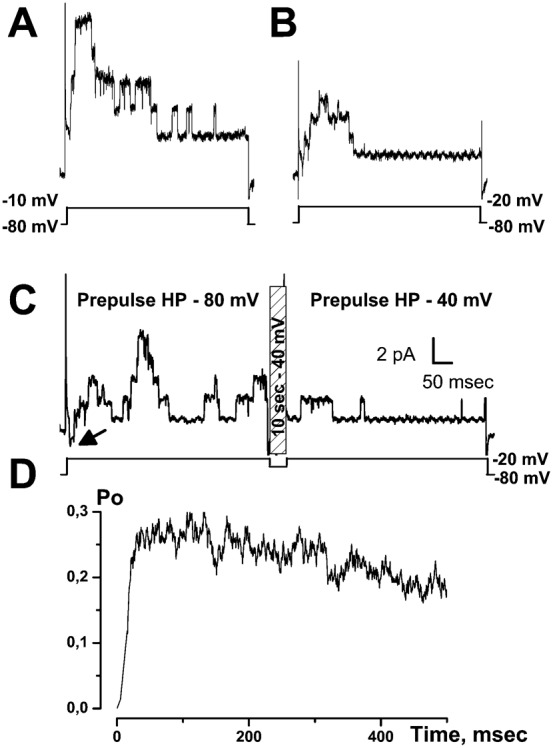
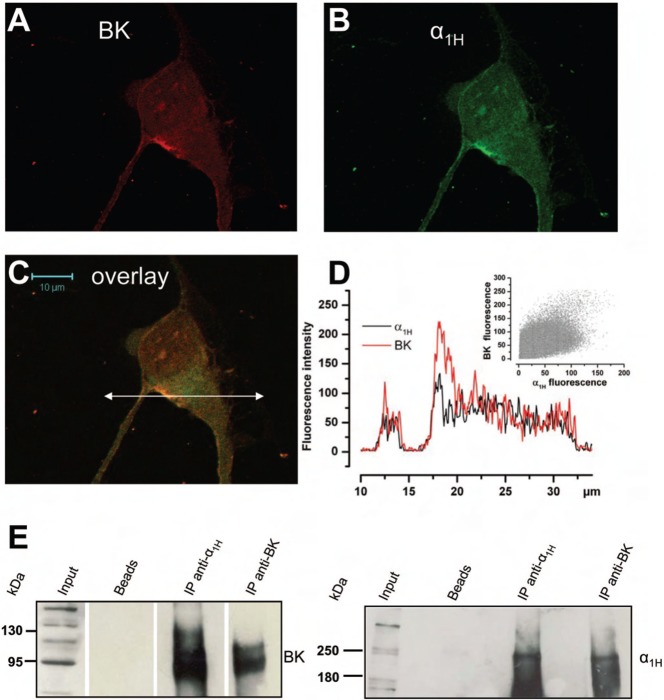
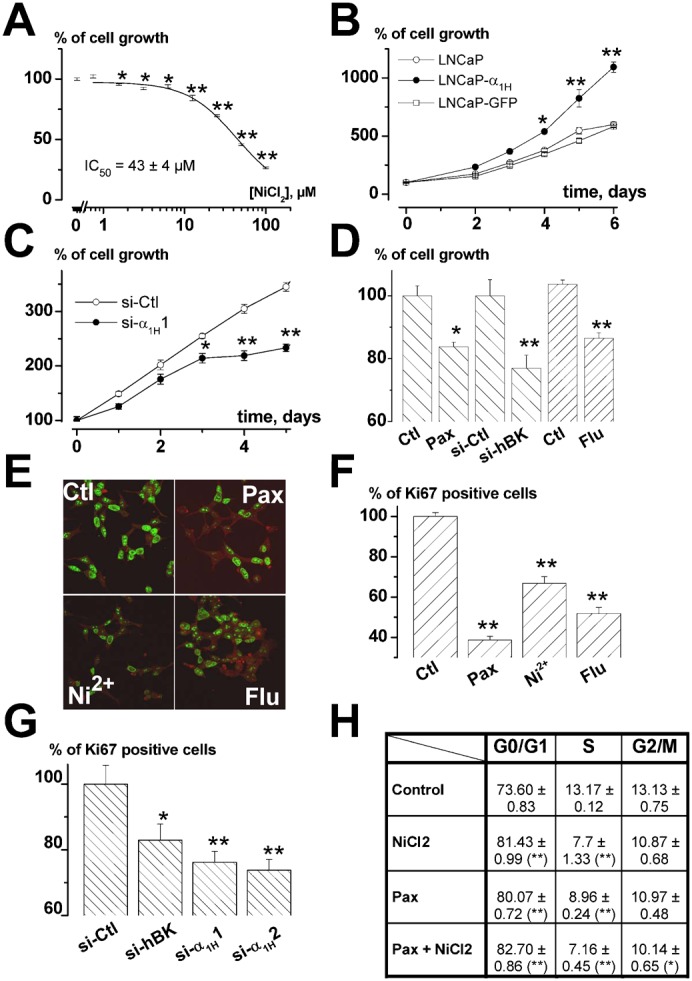
It is strongly suspected that potassium (K(+)) channels are involved in various aspects of prostate cancer development, such as cell growth. However, the molecular nature of those K(+) channels implicated in prostate cancer cell proliferation and the mechanisms through which they control proliferation are still unknown. This study uses pharmacological, biophysical and molecular approaches to show that the main voltage-dependent K(+) current in prostate cancer LNCaP cells is carried by large-conductance BK channels. Indeed, most of the voltage-dependent current was inhibited by inhibitors of BK channels (paxillin and iberiotoxin) and by siRNA targeting BK channels. In addition, we reveal that BK channels constitute the main K(+) channel family involved in setting the resting membrane potential in LNCaP cells at around -40 mV. This consequently promotes a constitutive calcium entry through T-type Cav3.2 calcium channels. We demonstrate, using single-channel recording, confocal imaging and co-immunoprecipitation approaches, that both channels form macromolecular complexes. Finally, using flow cytometry cell cycle measurements, cell survival assays and Ki67 immunofluorescent staining, we show that both BK and Cav3.2 channels participate in the proliferation of prostate cancer cells.

Keywords: BK channels; CACNA1H; Cancer cell growth; Cav3.2; KCa1.1; Proliferation; Prostate; T-type calcium channels.


Conflict of interest statement

Competing interests: The authors have no competing interests to declare.

Figures

Fig. 1.
Fig. 1.. Blocking BK channels inhibits voltage-dependent K+current in LNCaP-CTL cells.
(A–F) Current–voltage (i–v) relationships in the presence of different K+ channel inhibitors. Concentrations used were: 4 mM TEA, 1 µM paxillin (Pax), 1 µM iberiotoxin (Iberio), 500 nM apamin (Apa), 100 µM d-tubocurarine (dTC), 1 or 10 µM clotrimazole (Clo), 1 or 10 µM TRAM-34 (TRAM). Treatments with different siRNAs (si-hBK, si-Ctl, si-hIK1, 20 nM) were carried out for 3–4 days. (G) RT-PCR showing a decrease in the expression of the BK channel amplicon following 3 days of treatment with si-hBK (20 nM). Lanes correspond to: H2O  =  negative control, LNCaP  =  sample from LNCaP-CTL cells, LNCaP si-Ctl  =  sample from LNCaP-CTL cells treated with 20 nM si-Ctl, LNCaP si-hBK  =  sample from LNCaP-CTL treated with 20 nM si-hBK. Expression of hBK was compared to that of GAPDH. (H) RT-PCR showing a decrease in the expression of the hIK1 channel amplicon following 3 days of treatment with si-hIK1 (20 nM). Lanes correspond to: H2O  =  negative control, LNCaP si-Ctl  =  sample from LNCaP-CTL cells treated with 20 nM si-Ctl, LNCaP si-hIK1  =  sample from LNCaP-CTL treated with 20 nM si-hIK1. Expression of hIK1 was compared to that of GAPDH.
Fig. 2.
Fig. 2.. Single-channel characterization of voltage-dependent K+ channels in LNCaP-CTL cells.
(A) (a) Outside-out patch-clamp recording of BK channels openings at different membrane potentials in symmetrical K+ concentration (150 mM). (A) (b) Corresponding i–v curve in symmetrical K+ concentration (150 mM). (B) (a) Outside-out patch-clamp recording of BK channels openings at different membrane potentials in asymmetrical K+ concentration (150 mM in the pipette, 5 mM in the bath). (B) (b) Corresponding i–v curve in asymmetrical K+ concentration. (C) Proportion of outside-out patches displaying BK channel activity in the absence of siRNAs, after 3 days of treatment in the presence of ctl siRNA (si-Ctl, 20 nM) or in the presence of si-hBK (20 nM). (D) Proportion of BK channels (n = 331) expressed in the plasma membrane is shown as a function of cluster size (for example, 20% of all BK channels were observed in patches containing 4 levels of opening – i.e in cluster size 4). 31% of the patches were devoid of any channel activity. Theoretical stochastic binomial distribution is also shown. Formula used to compute binomial distribution is:where P(k) is the probability for one channel of belonging to a cluster of k channels in a membrane patch of 2 µm2 surface, n  =  total number of BK channels on the plasma membrane (estimation  =  6500), x  =  patch area (estimated to 2 µm2 from the patch-pipette size), y  =  plasma membrane area (estimation  =  6500 µm2). Here, the binomial distribution represents P(k)*k as a function of k (in percentage).
Fig. 3.
Fig. 3.. Comparison of voltage-dependent K+ current in LNCaP cells with T-type Ca2+ current different expression levels (A) Ca2+-dependency of voltage-dependent K+ current in LNCaP-CTL cells.
(A) (a) Typical membrane currents at −30 and +100 mV in the presence of either 10 or 0.1 mM EGTA in the patch-pipette. (A) (b) Average i–v curves obtained in the presence of either 10 or 0.1 mM EGTA in the patch-pipette. (A) (c) Typical i–v curves obtained using ramp protocols show that increasing intracellular Ca2+ concentration shifts the i–v curve towards negative potentials. Left panel: intracellular perfusion of 400 nM Ca2+. Perfusing high concentration of Ca2+ into the cells was carried out using an EGTA-buffered solution in the patch-pipette (10 mM EGTA, 6.5 mM CaCl2 and 1 mM MgCl2). After breaking into whole-cell configuration, this solution shifted the i–v curve towards negative membrane potentials (WCR: current recorded just after breaking into whole-cell recording configuration, WCR+5 min: current recorded 5 minutes later). Right panel: bath perfusion with ionomycin (Iono, 1 µM), results in an increased K+ current and its shift to more negative membrane potentials. (B) In LNCaP-CTL cells that do not display any T-type Ca2+ current, no K+ current was observed for membrane potentials lower than 0 mV. Top panel: membrane current. Middle panel: pulse protocol. Bottom panel: I/V curve. (C) In LNCaP cells that express T-type Ca2+ current, here a LNCaP-NE cell, this transient Ca2+ current was followed by potassium current that could be observed for membrane potential ranging from −40 to 0 mV. (D) Similar results were observed for LNCaP cells stably overexpressing Cav3.2 channels (LNCaP-α1H). (E) In LNCaP-α1H cells, the K+ current was larger when EGTA was reduced in the patch-pipette (0.1 vs 10 mM EGTA). (F) Representation of relative membrane conductance (G/Gmax) in LNCaP cells displaying (T-type (+)) or not (T-type (−)) T-type Ca2+ current with 0.1 and 10 mM EGTA in the patch-pipette. (G) Representation of the relative membrane conductance (G/Gmax) in LNCaP-α1H cells with 0.1 and 10 mM EGTA in the patch-pipette.
Fig. 4.
Fig. 4.. The transient component of voltage-dependent K+ current is inhibited by depolarizing the holding potential (HP) from −80 to −40 mV in (A) LNCaP-NE and (B) LNCaP-α1H cells.
(A,B) (a) Examples of membrane currents triggered by voltage steps to various membrane potentials from two different HP (−80 and −40 mV). (b) i–v curves obtained from HP of −80 and −40 mV. (c) i–v curves displaying the difference between the current measured at HP −80 mV and that measured at HP −40 mV.
Fig. 5.
Fig. 5.. Pharmacological study of the transient voltage-dependent K+ current in LNCaP-NE cells (A,B,C) and LNCaP-α1H cells (D).
(A) On-line recording of transient voltage-dependent K+ currents inhibition by NiCl2 (10 µM) and TEA-Cl (20 mM). Inset: representative membrane currents measured at −20 mV from HP −80 mV. (B) Inhibition of membrane currents (measured at −20 mV from HP −80 mV) by TEA (20 mM) and iberiotoxin (Iberio, 1 µM), but not by apamin (Apa, 500 nM). (C) Inhibition of voltage-dependent K+ current by si-hBK (20 nM). i–v curves shown here represent the average difference between currents obtained at HP −80 mV and those obtained at HP −40 mV. Inset: representative membrane currents measured at −20 mV from HP −80 mV. (D) Representative inhibition of membrane currents (measured at −20 mV from HP −80 mV) by si-hBK (20 nM) and si-α1H1 and si-α1H2 (5 nM), but not by si-Ctl (20 nM) or si-hIK1 (20 nM). Treatments for 3 days with si-hBK (20 nM) inhibit about 80% of the Ca2+-dependent K+ current in both LNCaP-NE (C) and LNCaP-α1H (D) cells.
Fig. 6.
Fig. 6.. Cell-attached single-channel study of coupling between BK and Cav3.2 channels in LNCaP-NE cells.
(A) Example of recording of BK channel opening following a voltage step to −10 mV. (B) Example of recording of BK channel opening following a voltage step to −20 mV. As seen, channel opening occurs mainly at the beginning of the depolarization. (C) Examples of channel openings following stimulation to −20 mV for two different holding potentials (HP). For each patch, the same protocol was applied (shown below channel recordings). The patch was first depolarized from a HP of −80 mV (pre-pulse HP) to a test pulse of −20 mV for 500 msec (left panel). The membrane potential was then immediately returned to a HP of −40 mV for 10 sec in order to inactivate T-type Ca2+ channels. A second test pulse to −20 mV was then applied for 500 msec (right panel). The membrane potential was then returned to −80 mV. As seen, BK channel opening for a HP of −80 mV occurs immediately after the inward Ca2+ current (arrow). This is impeded when an HP −40 mV pre-pulse was applied for 10 sec just before the test pulse. The scale applies to panels A–C. (D) Average BK channel open probability (Po) during a depolarization to −20 mV in LNCaP-NE cells. This value is computed by averaging (20–50 different voltage pulses from 15 cells) and subtracting single-channel currents obtained for an HP of −40 mV from those obtained for an HP of −80 mV. In these experiments, there were an average number of 4 BK channels in each patch.
Fig. 7.
Fig. 7.. Cav3.2 and BK channels co-localize in the same membrane area and belong to the same molecular complex.
(A–C) Confocal immunofluorescence images of an LNCaP cell overexpressing Cav3.2 GFP (green) stained with an anti-BK antibody (red). Staining is more pronounced on the plasma membrane for both channels and the overlay shows that there is a co-localization (yellow-orange areas) on plasma membrane areas. Scale bar: 10 µm. (D) Representation of both Cav3.2 and BK fluorescence intensities along the horizontal line shown in panel C. Inset: a scattergramme of BK fluorescence vs Cav3.2 fluorescence showing a correlation between both channels (Pearson's r = 0.77). (E) Western-blot of proteins immunoprecipitated by the anti-Cav3.2 antibody (anti-α1H) or the anti-BK antibody. Membranes were revealed with the anti-BK antibody and the anti-α1H (right panel) antibody. Bead lanes contain the beads used during the immunoprecipitation without the protein input.
Fig. 8.
Fig. 8.. Role of BK and Cav3.2 channels in LNCaP-CTL cell proliferation.
(A) Inhibition of cell growth (assayed by MTS) induced by a 4-day incubation in various concentrations of NiCl2. Data are normalized to the proliferation rates measured in control conditions (100%) as in panel D. n = 9 per condition. (B) Stable overexpression of Cav3.2 stimulated LNCaP cell growth (as assayed by MTS). Results are normalized to DO at t0 (100%) as in panel C. n = 12 per condition. (C) Inhibition of LNCaP cell growth by si-α1H1 (20 nM) measured by MTS. siRNAs were added when seeding the cells. n = 12 per condition. (D) Cell growth measured with MTS after 4 days in various channel inhibitors or si-RNAs (Pax: paxillin (10 µM), Flu: flunarizine (10 µM), si-Ctl and si-hBK (20 nM)). n = 6 per condition. (E) Immunodetection of Ki-67 in LNCaP-CTL cells after 4 days of incubation in various BK and Cav3.2 channel inhibitors (Pax: paxillin 10 µM, Flu: flunarizine 5 µM and Ni2+: NiCl2 20 µM) and relative % of cells immunostained with Ki-67 antibody in the presence of these channel inhibitors (F) or siRNAs (20 nM) (G). (H) Table showing the % of cells in each phase of the cell cycle using FACS analysis (G0/G1, S and G2/M). Inhibition of both T-type and BK channels (with 20 µM NiCl2 and 10 µM paxillin, respectively) increases the proportion of cells in G0/G1 phase and decreases the proportion of cells in S phase without additive action. This experiment is representative of 3 experiments (for each experiment, n = 3, each measured in duplicate). Statistical significance: *P<0.05, **P<0.01, ***P<0.001.

Similar articles

Cited by

References

    1. Bennett E. S., Smith B. A., Harper J. M. (2004). Voltage-gated Na+ channels confer invasive properties on human prostate cancer cells. Pflugers Arch. 447, 908–914 10.1007/s00424-003-1205-x - DOI - PubMed
    1. Berkefeld H., Sailer C. A., Bildl W., Rohde V., Thumfart J. O., Eble S., Klugbauer N., Reisinger E., Bischofberger J., Oliver D. et al. (2006). BKCa-Cav channel complexes mediate rapid and localized Ca2+-activated K+ signaling. Science 314, 615–620 10.1126/science.1132915 - DOI - PubMed
    1. Bijlenga P., Liu J. H., Espinos E., Haenggeli C. A., Fischer-Lougheed J., Bader C. R., Bernheim L. (2000). T-type alpha 1H Ca2+ channels are involved in Ca2+ signaling during terminal differentiation (fusion) of human myoblasts. Proc. Natl. Acad. Sci. USA 97, 7627–7632 10.1073/pnas.97.13.7627 - DOI - PMC - PubMed
    1. Bloch M., Ousingsawat J., Simon R., Schraml P., Gasser T. C., Mihatsch M. J., Kunzelmann K., Bubendorf L. (2007). KCNMA1 gene amplification promotes tumor cell proliferation in human prostate cancer. Oncogene 26, 2525–2534 10.1038/sj.onc.1210036 - DOI - PubMed
    1. Cambien B., Rezzonico R., Vitale S., Rouzaire-Dubois B., Dubois J. M., Barthel R., Karimdjee B. S., Mograbi B., Schmid-Alliana A., Schmid-Antomarchi H. (2008). Silencing of hSlo potassium channels in human osteosarcoma cells promotes tumorigenesis. Int. J. Cancer 123, 365–371 10.1002/ijc.23511 - DOI - PubMed