Review
. 2014 Feb 17;53(4):1839-53.
doi: 10.1021/ic4018739. Epub 2013 Oct 21.

Lanthanide-based imaging of protein-protein interactions in live cells

Affiliations
Review

Lanthanide-based imaging of protein-protein interactions in live cells

Megha Rajendran et al. Inorg Chem. .

Abstract

In order to deduce the molecular mechanisms of biological function, it is necessary to monitor changes in the subcellular location, activation, and interaction of proteins within living cells in real time. Förster resonance energy-transfer (FRET)-based biosensors that incorporate genetically encoded, fluorescent proteins permit high spatial resolution imaging of protein-protein interactions or protein conformational dynamics. However, a nonspecific fluorescence background often obscures small FRET signal changes, and intensity-based biosensor measurements require careful interpretation and several control experiments. These problems can be overcome by using lanthanide [Tb(III) or Eu(III)] complexes as donors and green fluorescent protein (GFP) or other conventional fluorophores as acceptors. Essential features of this approach are the long-lifetime (approximately milliseconds) luminescence of Tb(III) complexes and time-gated luminescence microscopy. This allows pulsed excitation, followed by a brief delay, which eliminates nonspecific fluorescence before the detection of Tb(III)-to-GFP emission. The challenges of intracellular delivery, selective protein labeling, and time-gated imaging of lanthanide luminescence are presented, and recent efforts to investigate the cellular uptake of lanthanide probes are reviewed. Data are presented showing that conjugation to arginine-rich, cell-penetrating peptides (CPPs) can be used as a general strategy for the cellular delivery of membrane-impermeable lanthanide complexes. A heterodimer of a luminescent Tb(III) complex, Lumi4, linked to trimethoprim and conjugated to nonaarginine via a reducible disulfide linker rapidly (∼10 min) translocates into the cytoplasm of Maden Darby canine kidney cells from the culture medium. With this reagent, the intracellular interaction between GFP fused to FK506 binding protein 12 (GFP-FKBP12) and the rapamycin binding domain of mTOR fused to Escherichia coli dihydrofolate reductase (FRB-eDHFR) were imaged at high signal-to-noise ratio with fast (1-3 s) image acquisition using a time-gated luminescence microscope. The data reviewed and presented here show that lanthanide biosensors enable fast, sensitive, and technically simple imaging of protein-protein interactions in live cells.


Figures

Figure 1
Figure 1. Structure and photophysics of sensitized organic lanthanide complexes
(a) Typical emission spectra of a luminescent Tb(III) complex (solid) and Eu(III) complex (dotted). (b) Exemplary structures of sensitized lanthanide complexes. With DTPA-cs124, the chelator and sensitizer are separate entities. The 7-amino-4-methyl-2(1H)-quinolinone (cs124) moiety effectively sensitizes both Tb(III) (1) and Eu(III) (2) luminescence. With the Lumi4-Tb(III) complex, 3, the 4 hydroxyisophthalamide units serve as both chelators and sensitizers. (c) Schematic representation of major energy transitions in a lanthanide complex. S = singlet state, T = triplet state, A = absorption, F = fluorescence, P = phosphorescence, NR = nonradiative, ISC = intersystem crossing, ET = energy transfer, L = metal luminescence.
Figure 2
Figure 2. Förster resonance energy transfer (FRET)-based biosensors and effects of donor and acceptor photophysics on detection
(a) Conformational changes of a single-chain biosensor (top) or interaction of dual chain biosensor (bottom) components bring donor (D) and acceptor (A) fluorophores within FRET distance (<10 nm). (b) Excitation (dotted) and emission spectra (solid) of cyan fluorescent protein (CFP, cyan) and yellow fluorescent protein (YFP, yellow), a common donor-acceptor pair for live cell FRET imaging. Overlap of CFP emission and YFP excitation spectra (green) allows sensitized YFP emission (yellow band) to be detected upon excitation of CFP (cyan band). Crosstalk, or direct excitation of YFP in the CFP band (blue) and bleedthrough of CFP emission into the YFP band (orange) obscure true FRET signals, necessitating multiple measurements with different filter sets. (c) With a long-lifetime Tb(III) donor and short-lifetime, green fluorescent protein (GFP) acceptor, Tb(III) and Tb(III)-sensitized, GFP emission can be separated using narrow-pass emission filters, eliminating bleedthrough. Crosstalk is eliminated by time-gated detection of long-lifetime, Tb(III)-to-GFP FRET.
Figure 3
Figure 3. Ligand-lanthanide complex heterodimers that bind selectively to recombinant receptor fusion proteins in vitro or in live cells
Figure 4
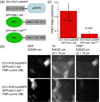
Figure 4. Time-gated FRET microscopy detects protein-protein interactions in live cells with high confidence in single-frame images
(a) Schematic of fusion proteins. (b) MDCKII cells were loaded with a TMP-Lumi4(TbIII) heterodimer (10) by osmotic lysis of pinosomes. Cells co-expressing indicated fusion proteins exhibited steady-state, GFP fluorescence (left). Time-gated detection of Tb(III) luminescence (middle) revealed cells loaded with 10. Tb(III)-to-GFP FRET (right) is seen in cells co-expressing ZO1-PDZ1/eDHFR and GFP/cldn1-tail and loaded with 10. No FRET signal is visible in cells co-expressing non-interacting ZO1-PDZl/eDHFR and GFP/cldn1-tailΔYV and loaded with 10. Micrographs: GFP fluorescence, λex = 480/40 nm; time-gated luminescence, λex = 365 nm, Δt = delay between excitation and detection. Emission at indicated wavelengths. Scale bars, 5 μm. (c) A significant (P < 10−6), >500% difference in the mean, donor-normalized FRET emission ratio (520/540 nm) was observed between cells expressing interacting and non-interacting fusion proteins. Mean ratios calculated from indicated sample size. Error bars, s.d. Data adapted from Rajapakse, et al.
Figure 5
Figure 5. Reported lanthanide complexes conjugated to oligoarginine, cell penetrating peptides (CPPs) that exhibit enhanced uptake into mammalian cells
Abbreviations: X = peptide sequence; capital letters, L-amino acids.
Figure 6
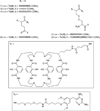
Figure 6. Structures of Lumi4-Tb(III) and TMP-Lumi4 heterodimers linked to nonaarginine and Tat-derived CPPs
Abbreviations: R1, linker-functionalized derivative of Lumi4; R2, triethyleneglycolamino derivative of TMP; capital letters, L-amino acids; small letters, D-amino acids; FAM, 5,6-carboxyfluorescein.
Figure 7
Figure 7. Arginine-rich, cell penetrating peptides (CPPs) conjugated to Lumi4-Tb(III) analogs directly translocate from culture medium to cytoplasm and TMP-Lumi4-Tb(III) peptide conjugates bind to eDHFR following cytoplasmic delivery
(a) Micrographs of time-gated luminescence (delay = Δt = 10 μs, λex = 365 nm, λem = 540/20 nm); scale bars, 5 μm. MDCKII cells were incubated for 30 min at indicated temperatures in Dulbecco’s modified Eagle’s medium (DMEM) with (+) or without (−) fetal bovine serum (FBS, 10% v/v) that contained indicated concentrations of 17, a conjugate of Lumi4-Tb(III) to (L)-R9. Incubation in DMEM with FBS containing low (5 μM) concentration of 17 results in punctate Tb(III) luminescence (top, left) whereas incubation in DMEM with FBS above a threshold concentration (20 μM) results in diffuse distribution of Tb(III) luminescence throughout the cytoplasm and nucleus (top, right). Incubation in DMEM without FBS lowers the threshold concentration (5 μM) for cytoplasmic delivery (bottom, left). Incubation at 4 °C results in a diffuse staining pattern (bottom, right), suggesting an energy-independent, direct translocation uptake mechanism. (b) MDCKII cells transiently expressing H2B–TagRFPT–eDHFR were incubated for 30 min at 37 °C in DMEM without FBS containing TMP-Lumi4-Tb(III) linked to the N-terminus of (L)-R9 (20, 10 μM). A steady-state fluorescence (λex = 545/30 nm, λem = 610/70 nm) image reveals nucleus-localized TagRFP-T fluorescence in expressing cells (top left). Time-gated images (delay = Δt = 10 μs, λex = 365 nm, λem as indicated) of Tb(III) luminescence (top, right) and Tb(III)-sensitized, TagRFP-T emission (bottom, left) show that nucleus-localized FRET signals occur in expressing cells loaded with 20. The sensitized emission signal disappears when TMP (final concentration = 100 μM) was added to medium (bottom, right); scale bars, 5 μm. Data adapted from Mohandessi, et al.
Figure 8
Figure 8. Interaction between GFP-FKBP12 and FRB-eDHFR imaged at high signal-to-noise ratio (SNR)
(a) MDCKII cells transiently co-expressing GFP-FKBP12 and FRB-eDHFR were exposed to rapamycin (200 nM, 1 h) and subsequently incubated for 10 min at 37 °C in DMEM without serum containing 21 (7.5 μM), a Lumi4-CysTMP heterodimer linked via a disulfide bond to CR9. The five images shown represent a single field of view acquired under different conditions: BF, bright field; GFP, steady-state fluorescence reveals expressing cells; Tb, time-gated emission (494 nm) shows which cells were loaded with 21; FRET, rightmost 2 images show Tb-to-GFP FRET signal observed in cells that both express fusion proteins and contain 21. Time-gated Tb luminescence and FRET micrographs (delay = Δt = 10 μs, λex = 365 nm, λem as indicated) were generated by summing 4 frames of indicated length to yield single, 12-bit images. SNR and photons/pixel were calculated for a region of interest in the cytoplasm (e.g., square in right-most image). SNR was calculated as the mean, background-subtracted pixel gray value in the ROI divided by its standard deviation. Values given are range for a 10-cell sample. FRET images are represented at identical contrast levels. Scale bars, 5 μm. (b) Bar chart represents the mean, donor-normalized FRET emission ratio (520/540 nm) observed in FRET positive (+rapamycin) and FRET negative (-rapamycin) cells imaged at 0.667 s frame lengths. Error bars, s.d. (c) Relative MDCKII cell metabolic activity assessed with MTT assay. Bar chart shows mean absorbance at 550 nm as a percentage of positive control (DMEM only) following incubation with 21 (30 min) at indicated concentrations (3 replicates for each condition). Error bars, s.d.

Similar articles

Cited by

References

    1. Bunzli JC. Chem. Rev. 2010;110:2729–2755. - PubMed
    1. New EJ, Parker D, Smith DG, Walton JW. Curr. Opin. Chem. Biol. 2010;14:238–246. - PubMed
    1. Ghose S, Trinquet E, Laget M, Bazin H, Mathis G. J. Alloys Compd. 2008;451:35–37.
    1. Degorce F, Card A, Soh S, Trinquet E, Knapik GP, Xie B. Curr. Chem. Genomics. 2009;3:22–32. - PMC - PubMed
    1. Selvin PR. Annu. Rev. Biophys. Biomol. Struct. 2002;31:275–302. - PubMed

Publication types