. 2013 Oct 21:11:80.
doi: 10.1186/1478-811X-11-80.

HIF-1α activation results in actin cytoskeleton reorganization and modulation of Rac-1 signaling in endothelial cells

Affiliations

HIF-1α activation results in actin cytoskeleton reorganization and modulation of Rac-1 signaling in endothelial cells

Alexander Weidemann et al. Cell Commun Signal. .

Abstract

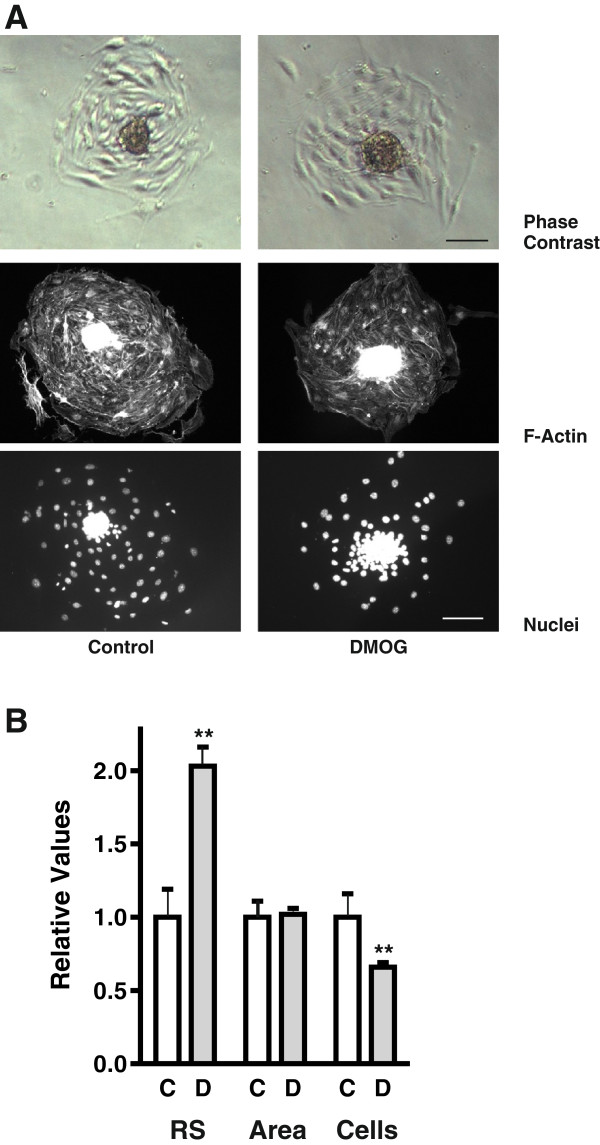
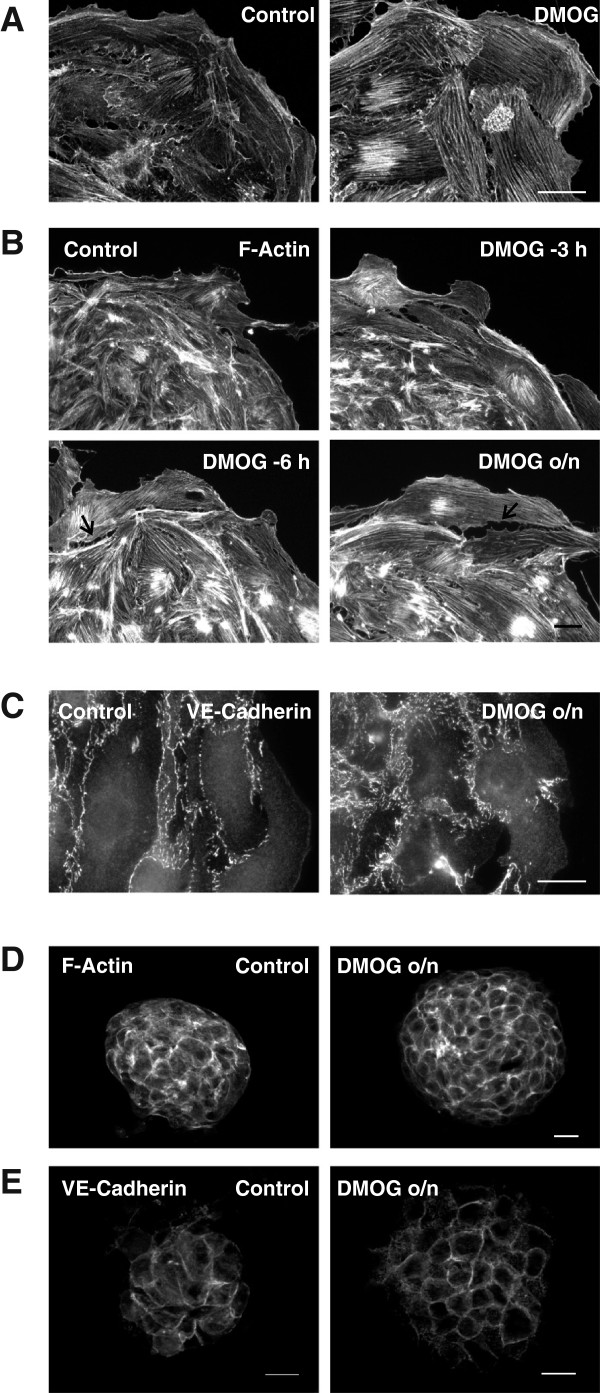
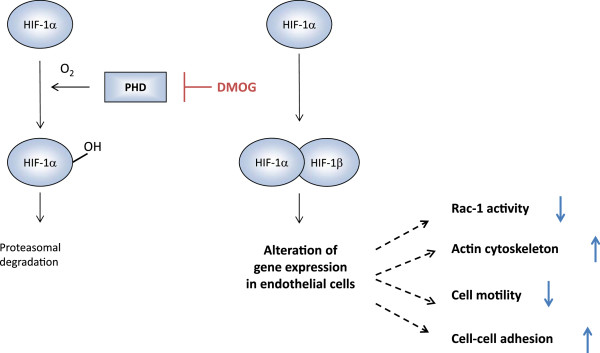
Background: Hypoxia is a major driving force in vascularization and vascular remodeling. Pharmacological inhibition of prolyl hydroxylases (PHDs) leads to an oxygen-independent and long-lasting activation of hypoxia-inducible factors (HIFs). Whereas effects of HIF-stabilization on transcriptional responses have been thoroughly investigated in endothelial cells, the molecular details of cytoskeletal changes elicited by PHD-inhibition remain largely unknown. To investigate this important aspect of PHD-inhibition, we used a spheroid-on-matrix cell culture model.

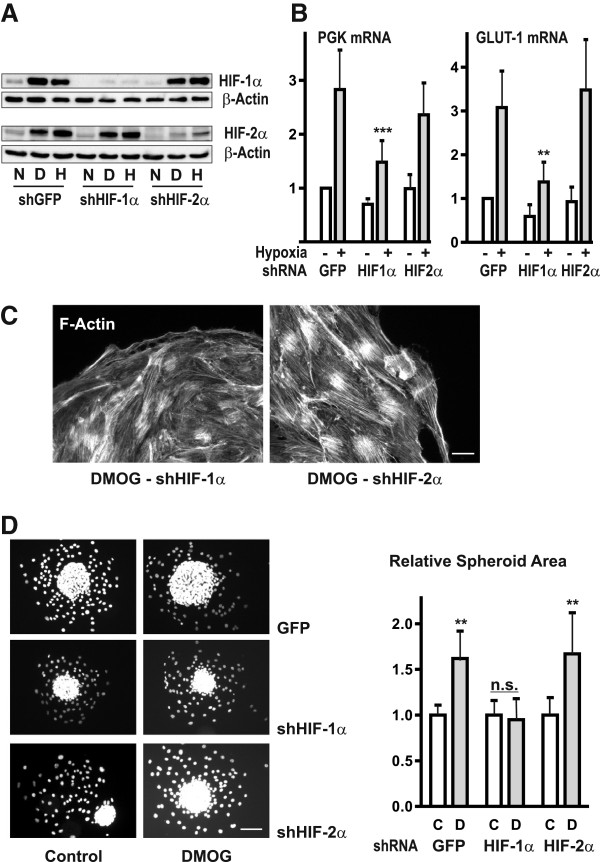
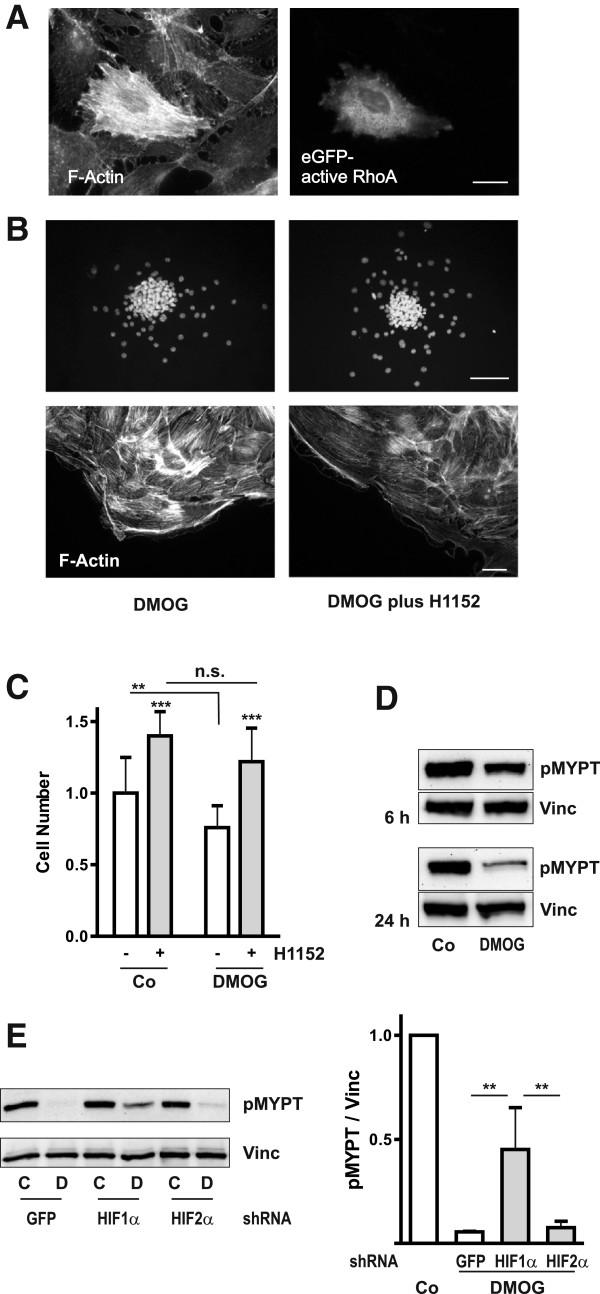
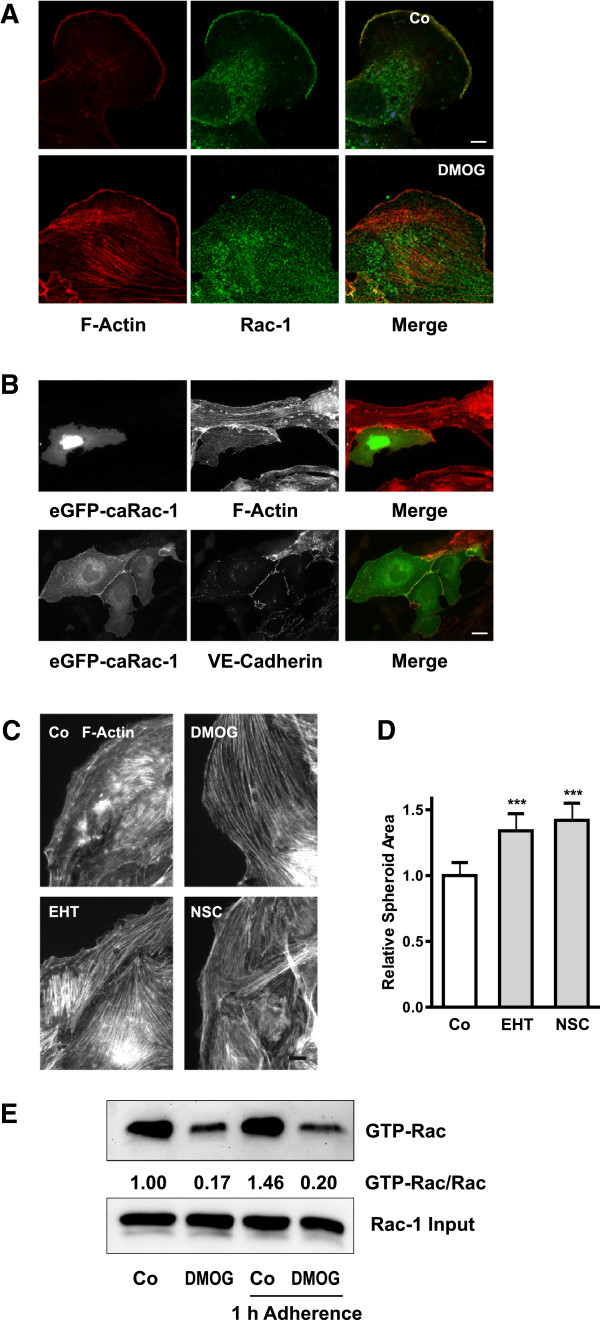
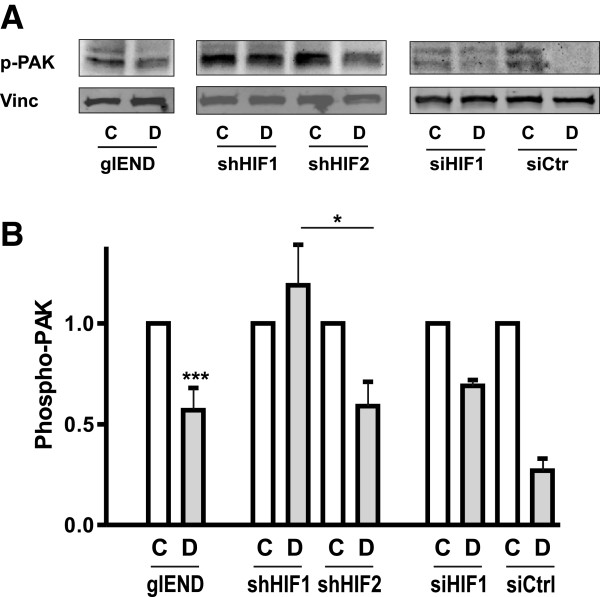
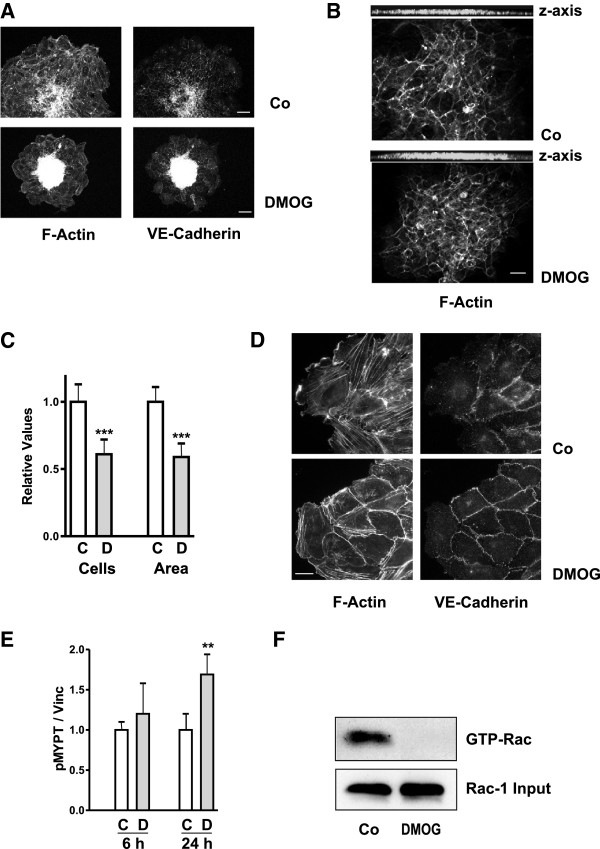
Results: Microvascular endothelial cells (glEND.2) were organized into spheroids. Migration of cells from the spheroids was quantified and analyzed by immunocytochemistry. The PHD inhibitor dimethyloxalyl glycine (DMOG) induced F-actin stress fiber formation in migrating cells, but only weakly affected microvascular endothelial cells firmly attached in a monolayer. Compared to control spheroids, the residual spheroids were larger upon PHD inhibition and contained more cells with tight VE-cadherin positive cell-cell contacts. Morphological alterations were dependent on stabilization of HIF-1α and not HIF-2α as shown in cells with stable knockdown of HIF-α isoforms. DMOG-treated endothelial cells exhibited a reduction of immunoreactive Rac-1 at the migrating front, concomitant with a diminished Rac-1 activity, whereas total Rac-1 protein remained unchanged. Two chemically distinct Rac-1 inhibitors mimicked the effects of DMOG in terms of F-actin fiber formation and orientation, as well as stabilization of residual spheroids. Furthermore, phosphorylation of p21-activated kinase PAK downstream of Rac-1 was reduced by DMOG in a HIF-1α-dependent manner. Stabilization of cell-cell contacts associated with decreased Rac-1 activity was also confirmed in human umbilical vein endothelial cells.

Conclusions: Our data demonstrates that PHD inhibition induces HIF-1α-dependent cytoskeletal remodeling in endothelial cells, which is mediated essentially by a reduction in Rac-1 signaling.


Figures

Figure 1
Figure 1
DMOG alters cell-cell and cell-matrix interactions. Spheroids of microvascular endothelial glEND.2 cells were generated as described in Materials and Methods. Upon plating on collagen IV-coated plates cells were treated with 1 mM DMOG for 24 h. (A) Radial migration off the spheroids after 24 h was significantly impaired by DMOG-treatment and more cells remained in the residual spheroids. F-actin fibers were visualized with PromoFluor phalloidin, nuclei were stained with Hoechst. Scale bar: 100 μm. (B) For quantification at least 6 spheroids were analyzed and the data of 7 independent experiments were summarized as means ± SEM, **p < 0.01, one sample t-test. C: Control cells; D: DMOG-treated cells; RS: area covered by residual spheroids; Area: area covered by migrated cells; Cells: number of cells migrated off the spheroids.
Figure 2
Figure 2
DMOG strengthens F-actin fibers and supports cell structures within spheroids. (A) DMOG strongly affected orientation of F-actin fibers in migrating cells treated with 1 mM DMOG for 24 h. Compared to control cells, a regular pattern of strong parallel F-actin fibers was observed (PromoFluor phalloidin staining, confocal microscopy). Scale bar: 20 μm. (B) F-actin fibers were still highly irregular when cells were treated with 1 mM DMOG for the last 3 h only (DMOG -3 h), whereas treatment with DMOG for the last 6 h induced alignment of F-actin fibers (DMOG -6 h). Arrows indicate gaps between cells. Scale bar: 20 μm. (C) Cell-cell contacts were visualized by staining of VE-cadherin after spheroids were treated with 1 mM DMOG for 24 h. Scale bar: 20 μm. (D/E) F-actin structures (D) and VE-cadherin (E) within the spheroids were visualized by apotome technique. Cortical F-actin and VE-cadherin formed distinct patterns in DMOG-treated cells. Scale bar: 20 μm.
Figure 3
Figure 3
Morphological alterations induced by DMOG are HIF-1α dependent. (A) glEND.2 cells were stably transfected with shGFP, shHIF-1α or shHIF-2α. The clones were cultured under normoxic (N) or hypoxic (H, 1% O2) conditions, or treated with DMOG (D, 1 mM) for 6 h. 30 μg protein of cellular protein were loaded for the detection of HIF-1α, and nuclear extracts (20 μg protein) were used for the detection of HIF-2α. (B) Stably transfected cells, shGFP (GFP), shHIF-1α (HIF1α) or shHIF-2α (HIF2α), were exposed to hypoxia for 20 h. Expression of HIF-target genes phosphoglycerate kinase (PGK) and glucose transporter GLUT-1 mRNA was upregulated in shGFP and shHIF-2α clones but not in shHIF-1α clones. RNA was detected by real time RT-PCR. Expression of PGK or GLUT-1 in GFP cells was set to 1 in each experiment. Data are means ± SD of 4 to 9 experiments. *** p < 0.001, ** p < 0.01 compared to shGFP cells, ANOVA with Tukey’s multiple comparison test. (C) Spheroids obtained form glEND2 cells stably transfected with GFP, shHIF-1α or shHIF-2α were plated on fibronectin and treated with 1 mM DMOG for 24 h. Knockdown of HIF-1α prevented formation of strong F-actin fibers as visualized with PromoFluor phalloidin in shHIF-1α clones. Representative images of shHIF-1α or shHIF-2α cells are depicted. Scale bar: 20 μm. (D) To quantify the areas covered by residual spheroids, cells were stained with Hoechst. Scale bar: 50 μm Areas were quantified in 2 independent experiments with at least 8 spheroids in each group. Data are summarized as means ± SD; mean value of spheroids of control cells was set to 1 in each experiment; error bars of control values represent variability within one experiment. ** p < 0.01; ANOVA with Dunnett’s multiple comparison test.
Figure 4
Figure 4
RhoA - Rho kinase signaling is active in DMOG-treated cells. (A) glEND.2 microvascular cells cultured in cell culture dishes were transfected with constitutively active eGFP-V14-RhoA. After 24 h, cells were stained for F-actin. Transfected cells are characterized by high density of F-actin fibers. Scale bar: 20 μm. (B) Spheroids were treated with DMOG (1 mM) or DMOG plus H1152 (0.75 μM) for 24 h. The Rho kinase inhibitor reduced the size of the remaining spheroids and prevented stress fiber formation. Nuclei were stained with Hoechst, and F-actin fibers with PromoFluor phalloidin. Scale bar upper panel: 100 μm; lower panel: 20 μm. (C) The number of cells migrated off spheroids was determined in two independent experiments with at least 15 spheroids for each condition. Mean cell numbers (means ± SD) of control cells was set to 1, error bars of control values represent variability within one experiment. ** p < 0.01 as indicated, *** p < 0.001 compared to respective controls, n.s: not significant; ANOVA with Dunnett’s multiple comparison test. (D) Cells cultured in cell culture dishes were incubated with DMOG for 6 and 24 h. Phosphorylated MYPT was detected in cell culture homogenates by Western blotting. The blot is representative of three experiments. (E) glEND2 cells stably transfected with GFP, shHIF-1α or shHIF-2α were cultured in cell culture dishes with (D) or without (C) DMOG for 24 h. Phosphorylated MYPT was detected by Western blotting. For quantification, the ratio pMYPT/Vinc of non-treated cells was set to 1 at each experimental condition (Co). ** p < 0.01, n = 3, means ± SD, ANOVA with Tukey’s multiple comparison test.
Figure 5
Figure 5
Rac-1 activity is reduced in DMOG-treated glEND.2 cells. (A) Spheroids were treated with 1 mM DMOG overnight. F-actin (red) and VE-cadherin (green) were visualized by PromoFluor phalloidin staining and indirect immunofluorescence, respectively, using confocal microscopy. Colocalization at the cell periphery of migrating cells was observed in control cells but not in DMOG-treated cells. Scale bar: 5 μm. (B) glEND.2 cells cultured in cell culture dishes were transfected with constitutively active eGFP-V12-Rac-1 coupled to GFP. Cells were analyzed after 24 h. Overexpression of Rac-1 reduced F-actin stress fibers (upper panels). Rac-1 was concentrated at the cell borders as shown by colocalization with VE-Cadherin (lower panels). Scale bar: 20 μm. (C) Spheroids were treated with DMOG (1 mM), EHT1864 (EHT, 5 μM) or NSC23677 (NSC, 100 μM) for 24 h leading to strengthening of F-actin fibers. F-actin was visualized by PromoFluor phalloidin staining. Scale bar: 10 μm. (D) Residual spheroid area was determined after 24 h in 3 independent experiments with 9–10 spheroids for each condition; mean value of spheroid areas in control cells was set to 1 in each experiment; means ± SD *** p < 0.001 compared to control cells, Dunnett’s post hoc test. (E) glEND.2 cells treated with DMOG (1 mM) were cultured in cell culture dishes over night and then were reseeded for 1 h. GTP-Rac was precipitated from 500 μg cellular protein. Total Rac was detected in 25 μg cellular protein. The ratios Rac-GTP/Rac (given between the blots) show a strong decrease in samples treated with DMOG. The blot is representative of two independent experiments with a reduction of Rac-GTP > 80%.
Figure 6
Figure 6
PAK phosphorylation is reduced by DMOG in a HIF-1α dependent fashion. (A) glEND.2 cells were incubated with 1 mM DMOG over night and were then replated for 45 to 60 min. Endogenous phospho-PAK was detected by Western blotting. Blots show representative experiments. (B) The graph depicts the ratio phospho-PAK to vinculin detected in different experiments. Downregulation of HIF-1α by shRNA or siRNA prevented DMOG-mediated reduction of PAK phosphorylation as observed in control cells or shHIF-2α clones. Value of control cells was set to 1 in each experiment. glEND.2: n = 5, *** p < 0.001, two sided one sample t-test; shHIF: n = 3, p < 0.05, Student’s t-test; siHIF: means ± half range of two experiments.
Figure 7
Figure 7
HUVEC are sensitive to DMOG. (A) HUVEC were organized into spheroids and plated on collagen IV-coated plates in the presence or absence of 1 mM DMOG. F-actin and VE-cadherin were visualized by PromoFluor phalloidin staining and indirect immunofluorescence, respectively. Scale bar: 20 μm. (B) F-actin structures within the spheroids were visualized by apotome technique. Scale bar: 20 μm. Images were merged to show the height of the spheroids in z-axis. (D) Higher magnifications of F-actin fibers and VE-cadherin structures as shown in (Figure 7A). Scale bar: 20 μm. (C) After 24 h, nuclei were stained with Hoechst and the number of migrated cells was counted using ImageJ. Cell numbers were quantified in 35 spheroids of 5 different preparations. The graph summarizes the data of 20 spheroids of three different isolates (means ± SD). The area covered by F-actin stained cells (means ± SD) was determined in 35 spheroids of 5 different isolates. In each experiment the mean value of control spheroids was set to 1, error bars reflecting the variability within one experiment . *** p < 0.0001, Student’s t-test. (E) HUVEC were cultured in cell culture dishes treated with DMOG (1 mM) for 6 and 24 h. Phosphorylated MYPT was detected by Western blotting. Data are means ± SD of 3 experiments performed in duplicate. In each experiment the mean value of controls was set to 1, error bars of controls reflecting variability of biological samples. ** p < 0.01, Student’s t-test. (F) HUVEC cultured in cell culture dishes were treated with DMOG (1 mM) for 24 h. GTP-Rac was precipitated from 700 μg cellular protein. Total Rac was detected in 25 μg cellular protein. The blot is representative of 2 precipitations.
Figure 8
Figure 8
Schematic summary of DMOG-induced modulation of endothelial cells morphology. Incubation of the cells with DMOG prevents PHD-dependent degradation of HIF-1α. Stabilized HIF-1α modulates gene expression, which, as shown in our studies, leads to reduced Rac-1 activity associated with alterations in cell morphology.

Similar articles

Cited by

References

    1. Rey S, Semenza GL. Hypoxia-inducible factor-1-dependent mechanisms of vascularization and vascular remodelling. Cardiovasc Res. 2010;11:236–242. doi: 10.1093/cvr/cvq045. - DOI - PMC - PubMed
    1. Pugh CW, Ratcliffe PJ. Regulation of angiogenesis by hypoxia: role of the HIF system. Nat Med. 2003;11:677–684. doi: 10.1038/nm0603-677. - DOI - PubMed
    1. Greer SN, Metcalf JL, Wang Y, Ohh M. The updated biology of hypoxia-inducible factor. EMBO J. 2012;11:2448–2460. doi: 10.1038/emboj.2012.125. - DOI - PMC - PubMed
    1. Weidemann A, Johnson RS. Biology of HIF-1alpha. Cell Death Differ. 2008;11:621–627. doi: 10.1038/cdd.2008.12. - DOI - PubMed
    1. Fong GH, Takeda K. Role and regulation of prolyl hydroxylase domain proteins. Cell Death Differ. 2008;11:635–641. doi: 10.1038/cdd.2008.10. - DOI - PubMed

Publication types

MeSH terms