. 2013 Dec;163(4):1673-85.
doi: 10.1104/pp.113.224527. Epub 2013 Oct 21.

The F-box protein OsFBK12 targets OsSAMS1 for degradation and affects pleiotropic phenotypes, including leaf senescence, in rice

Affiliations

The F-box protein OsFBK12 targets OsSAMS1 for degradation and affects pleiotropic phenotypes, including leaf senescence, in rice

Yuan Chen et al. Plant Physiol. 2013 Dec.

Abstract

Leaf senescence is related to the grain-filling rate and grain weight in cereals. Many components involved in senescence regulation at either the genetic or physiological level are known. However, less is known about molecular regulation mechanisms. Here, we report that OsFBK12 (an F-box protein containing a Kelch repeat motif) interacts with S-ADENOSYL-l-METHIONINE SYNTHETASE1 (SAMS1) to regulate leaf senescence and seed size as well as grain number in rice (Oryza sativa). Yeast two-hybrid, pull-down, and bimolecular fluorescence complementation assays indicate that OsFBK12 interacts with Oryza sativa S-PHASE KINASE-ASSOCIATED PROTEIN1-LIKE PROTEIN and with OsSAMS1. Biochemical and physiological data showed that OsFBK12 targets OsSAMS1 for degradation. OsFBK12-RNA interference lines and OsSAMS1 overexpression lines showed increased ethylene levels, while OsFBK12-OX lines and OsSAMS1-RNA interference plants exhibited decreased ethylene. Phenotypically, overexpression of OsFBK12 led to a delay in leaf senescence and germination and increased seed size, whereas knockdown lines of either OsFBK12 or OsSAMS1 promoted the senescence program. Our results suggest that OsFBK12 is involved in the 26S proteasome pathway by interacting with Oryza sativa S-PHASE KINASE-ASSOCIATED PROTEIN1-LIKE PROTEIN and that it targets the substrate OsSAMS1 for degradation, triggering changes in ethylene levels for the regulation of leaf senescence and grain size. These data have potential applications in the molecular breeding of rice.


Figures

Figure 1.
Figure 1.
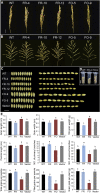
Phenotypes of OsFBK12 transgenic lines at different developmental stages. A, Germination. WT, The wild type; FR-4, FR-10, and FR-12, OsFBK12 RNAi lines 4, 10, and 12, respectively; FO-5 and FO-9, OsFBK12 overexpression lines 5 and 9, respectively. Bar = 1 cm. B, Vegetative growth status. Bar = 20 cm. C, Grain-filling period. Bar = 20 cm. D, Relative expression level of OsFBK12 in RNAi lines and overexpression lines. ACTIN was used as a control. Quantitative reverse transcription-PCR data represent means ± sd of three biological replicates. E, Plant height of OsFBK12 transgenic plants at the heading stage. Data are means ± sd of triplicate experiments. F, Tiller number of OsFBK12 transgenic plants at the heading stage. Data are means ± sd of triplicate experiments. G, Chlorophyll content of the upper three leaves from the main culm. Data are means ± sd of triplicate experiments. FW, Fresh weight; WAH, week after heading.
Figure 2.
Figure 2.
Panicle morphology and seed size phenotypes of the OsFBK12 transgenic lines. A, Panicles. OsFBK12 RNAi and overexpression lines are shown at maturity. WT, The wild type; FR-4, FR-10, and FR-12, OsFBK12 RNAi lines 4, 10, and 12, respectively; FO-5 and FO-9, OsFBK12 overexpression lines 5 and 9, respectively. Bar = 3 cm. B, Panicle branching. Bar = 3 cm. C, Seed width and seed length. Bar = 1 cm. Vector indicates empty vector UN1301 transformed rice as a control. D, Tubes containing 43 seeds from the indicated lines. Bar = 1 cm. E, Statistical analysis of seed size and panicle types. The data of FR and FO indicate averages of three individual FR lines and two FO lines. Data are means ± se. Multiple comparisons were performed by Tukey’s honestly significant difference post hoc test. Letters indicate significantly different results. Tests were carried out by the R library multcomp.
Figure 3.
Figure 3.
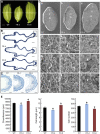
Cell number and size of hulls and endosperm in the transgenic lines. A, Grain shape. WT, The wild type; FR-4, OsFBK12 RNAi line 4; FO-9, OsFBK12 overexpression line 9. White lines indicate the positions of the cross sections in B.Bar = 1 mm. B, Cross sections of the hulls. The boxes indicate the regions enlarged in C. Bars = 500 μm. C, Magnified view of the boxes in B. Bars = 50 μm. D, Scanning electron microscopy images of transections of endosperm. I, II, and III represent the outer, middle, and inner parts of the endosperm, respectively. Enlarged regions corresponding to I, II, and III are shown below. The wild type is shown in a, d, g, and j; FR-4 is shown in b, e, h, and k, and FO-9 is shown in c, f, i, and l. White arrows denote football-like starch granules. Bars = 1 mm (a–c) and 20 μm (d–l). E, Statistical analysis of the total length, cell number, and cell length in the outer parenchymal cell layers of the hulls. The data of FR and FO indicate averages of three individual FR lines and two FO lines. Data are means ± se. Student’s t test was performed. Asterisks represent P < 0.05 compared with wild-type values.
Figure 4.
Figure 4.
Interaction of OsFBK12 with OSK1 in vivo and subcellular localization. A, Yeast two-hybrid assay for the interaction of OsFBK12 with OSK1. A schematic diagram of OsFBK12 and the truncations used is shown. The bait (BD) vector contained full-length OsFBK12, OsFBK12△kelch, or OsFBK12 △F-box; the prey (AD) vector contained OSK1. Yeast strains were cultured on the −Trp−Leu−His−Ade selection medium. β-Galactosidase activity of positive clones was analyzed using 5-Bromo-4-chloro-3-indolyl β-d-galactopyranoside. The proved interaction between OsGSR1 (a GA-stimulated transcript family gene in rice) and DWARF1 was used as a positive control. B, BiFC assay for interaction between OsFBK12 and OSK1 in tobacco. Shown is the coexpression of Yellow fluorescence protein N-terminal (YN)-OsFBK12 and Yellow fluorescence protein C-terminal (YC)-OSK1 (top row), YN-OsFBK12 and YC vector (middle row), and YC-OSK and YN vector as a control (bottom row). Bars = 100 µm. C, Subcellular localization of OsFBK12-GFP and OSK1-GFP fusion proteins in rice protoplasts. GFP protein alone shows fluorescent signals in nucleus, membrane, and cytoplasm. H33342 is a staining dye for the nucleus. Bars = 10 µm.
Figure 5.
Figure 5.
Interaction of OsFBK12 with OsSAMS1 for degradation in plants. A, Yeast two-hybrid assay for interaction of OsFBK12 with OsSAMS1222-316. The reported interacting proteins OsGSR1 (a GA-stimulated transcript family gene in rice) and DWARF1 were used as positive controls. B, Pull-down assay for the interaction of OsFBK12 with OsSAMS1222-316. Input represents crude MBP-OsFBK12 and GST-OsSAMS1 protein. Lanes 1 to 3, Input sample of GST, MBP, and MBP-OsFBK12 and GST-OsSAMS1; lanes 4 to 6, elution from GST/MBP-OsFBK12, GST-OsSAMS1/MBP, and MBP-OsFBK12/GST-OsSAMS1 after pull down. The arrow shows the band pulled down, and arrowheads show immunoblotting by the anti-MBP monoclonal antibody (Ab). C, Immunoblot analysis of the expression of OsSAMS1 protein in OsFBK12 transgenic seedlings. Coomassie Brilliant Blue staining indicates loading for total protein. WT, The wild type; FR-4, FR-10, and FR-12, OsFBK12 RNAi lines 4, 10, and 12, respectively; FO-5 and FO-9, OsFBK12 overexpression lines 5 and 9, respectively. D, OsSAMS1-GFP degradation assays performed in tobacco with or without MG132 treatment. Normalized plots of the degradation of OsSAMS1-GFP are shown below. Data are means ± sd of triplicate experiments. E, OsSAMS1-GFP degradation assays performed in tobacco with or without OsFBK12 protein. Normalized plots of the degradation of OsSAMS1-GFP are shown below. Data are means ± sd of triplicate experiments. F, Pull-down assay using anti-ubiquitin antibody indicated that the bands of higher molecular mass (72–170 kD) were polyubiquitinated of OsSAMS1 in tobacco. The molecular masses are shown in kD. The molecular mass for GFP is 26 kD and that for OsSAM1-GFP is 70 kD. Anti-Ub, Anti-ubiquitin monoclonal antibody.
Figure 6.
Figure 6.
Germination and senescence phenotypes of the OsFBK12 and OsSAMS1 transgenic lines. A, Effect of SAM on seed germination in the OsFBK12 transgenic plants. The morphology of seedlings was observed after 40 h for germination. SAM concentration was 1 mm. Bar = 1 cm. Data are means ± sd of triplicate experiments with 30 seeds per sample. B, The time course of germination and the effect of SAM (1 mm). Data are means ± sd of triplicate experiments with 30 seeds per sample. C, Effect of ethephon on seed germination in the OsFBK12 and SAMS1 transgenic plants. The morphology of seedlings was observed after 40 h for germination. Ethephon concentration was 50 µL L−1. Bar = 1 cm. Data are means ± sd of triplicate experiments with 30 seeds per sample. D, The time course of germination and the effect of ethephon (50 µL L−1). Data are means ± sd of triplicate experiments with 30 seeds per sample. E, ACC content in different transgenic plants (using 30-d-old seedlings). Multiple comparisons were performed by Tukey’s honestly significant difference post hoc test. Letters indicate significantly different results. Tests were carried out by the R library multcomp. F, Ethylene content in different transgenic plants (using 30-d-old seedlings). G, Phenotypic comparison of the wild type (WT), the OsSAMS1-RNAi (SR) line, and the OsSAMS1 overexpression (SO) line at 120 d after germination. Bar = 20 cm. H, Detached leaf senescence for 3 d in darkness (using 30-d-old seedlings) with and without treatment of aminoethoxyvinylglycine (AVG) and ethephon. Bar = 3 cm. I, Chlorophyll content of the detached leaves in H. Data are means ± sd of triplicate experiments. FW, Fresh weight. The data of FR and FO indicate averages of three individual FR lines and two FO lines; the data of SR and SO indicate averages of two individual SR lines and two SO lines.
Figure 7.
Figure 7.
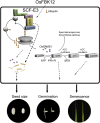
Proposed working model for the OsFBK12 regulation of leaf senescence and seed size in rice. This model proposes that OsFBK12 was involved in 26S proteasome-mediated degradation by interacting with OSK and targeted the substrate OsSAMS1. When OsSAMS1 degraded, it caused a corresponding change in ethylene level and regulated leaf senescence. Meanwhile, OsFBK12 might target another substrate or might regulate the transcription of some genes to affect seed size. PPi, pyrophosphate; Pi, phosphate; MAT, 5'-methylothioadenosine.

Similar articles

Cited by

References

    1. Agarwal G, Choudhary D, Singh VP, Arora A. (2012) Role of ethylene receptors during senescence and ripening in horticultural crops. Plant Signal Behav 7: 827–846 - PMC - PubMed
    1. Barrôco RM, Peres A, Droual AM, De Veylder L, Nguyen SL, De Wolf J, Mironov V, Peerbolte R, Beemster GT, Inzé D, et al (2006) The cyclin-dependent kinase inhibitor Orysa;KRP1 plays an important role in seed development of rice. Plant Physiol 142: 1053–1064 - PMC - PubMed
    1. Bouvier F, Linka N, Isner JC, Mutterer J, Weber AP, Camara B. (2006) Arabidopsis SAMT1 defines a plastid transporter regulating plastid biogenesis and plant development. Plant Cell 18: 3088–3105 - PMC - PubMed
    1. Chen N, Xu Y, Wang X, Du C, Du J, Yuan M, Xu Z, Chong K. (2011) OsRAN2, essential for mitosis, enhances cold tolerance in rice by promoting export of intranuclear tubulin and maintaining cell division under cold stress. Plant Cell Environ 34: 52–64 - PubMed
    1. Comcepcion M, Lizada C, Yang SF. (1979) A simple and sensitive assay for 1-aminocyclopropane-1-carboxylic acid. Anal Biochem 100: 140–145 - PubMed

Publication types

MeSH terms

LinkOut - more resources