. 2013 Dec 15;591(24):6139-56.
doi: 10.1113/jphysiol.2013.262477. Epub 2013 Oct 21.

Motor unit recruitment by size does not provide functional advantages for motor performance

Affiliations

Motor unit recruitment by size does not provide functional advantages for motor performance

Jakob L Dideriksen et al. J Physiol. .

Abstract

It is commonly assumed that the orderly recruitment of motor units by size provides a functional advantage for the performance of movements compared with a random recruitment order. On the other hand, the excitability of a motor neuron depends on its size and this is intrinsically linked to its innervation number. A range of innervation numbers among motor neurons corresponds to a range of sizes and thus to a range of excitabilities ordered by size. Therefore, if the excitation drive is similar among motor neurons, the recruitment by size is inevitably due to the intrinsic properties of motor neurons and may not have arisen to meet functional demands. In this view, we tested the assumption that orderly recruitment is necessarily beneficial by determining if this type of recruitment produces optimal motor output. Using evolutionary algorithms and without any a priori assumptions, the parameters of neuromuscular models were optimized with respect to several criteria for motor performance. Interestingly, the optimized model parameters matched well known neuromuscular properties, but none of the optimization criteria determined a consistent recruitment order by size unless this was imposed by an association between motor neuron size and excitability. Further, when the association between size and excitability was imposed, the resultant model of recruitment did not improve the motor performance with respect to the absence of orderly recruitment. A consistent observation was that optimal solutions for a variety of criteria of motor performance always required a broad range of innervation numbers in the population of motor neurons, skewed towards the small values. These results indicate that orderly recruitment of motor units in itself does not provide substantial functional advantages for motor control. Rather, the reason for its near-universal presence in human movements is that motor functions are optimized by a broad range of innervation numbers.


Figures

Figure 1
Figure 1. The generation of new motor unit populations in the evolutionary optimization process
A and C, represent the two most functionally effective motor unit populations of the total number of 50 populations in each optimization. The three representative neurons from each population receive synaptic input (from left-hand side) and their axons innervate the muscle. The soma size indicates its recruitment threshold. The minimum motor unit discharge rate is represented as a 500 ms spike train above the axon, whereas the motor unit twitch is shown next to the muscle (duration: 500 ms). The twitch amplitude reflects the innervation number. As shown in the tables below the graphical representation of the neuromuscular system in each panel, each population consisted of 181 and 390 motor units respectively with random values assigned to the parameters of the neuron: recruitment threshold (RT, in arbitrary units of excitation), minimum discharge rate (MDR, in pps), peak discharge rate (PDR, in pps), innervation number [IN, expressed in percentage of the total number of fibres (bottom of this column)], and twitch contraction time (CT). B and D, two new motor unit populations defined as random combinations of the properties of the single motor units of the populations in (A) and (C), as indicated by the different shades of grey. For example, the new population in (B) adopts the properties of the first motor unit from the population in (A) and from the second and last motor unit from the population in (C). In the new populations, a subset of the parameter values (bold and underlined) are exposed to random variations (mutations). For example, the recruitment threshold of the first motor unit of the population in (B) (whose values were adopted from the population in A), was changed from 22 to 28.
Figure 2
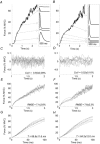
Figure 2. Evolutionary optimization scheme of the neuromuscular models
A, each square represents a motor unit population (members). In each column (representing each iteration of the optimization process), six of the 50 members are shown. The number within each square represents its estimated fitness value in per cent. Crossed squares indicate excluded members after each iteration (lowest numbers) and the arrows show how members are transferred to next iteration, including the generation of new members (two arrows merging from small circles). For example, in the first iteration (first column), the first and fourth member were excluded (as 18% and 20% were the lowest fitness values), to be replaced by ‘children’ of the second and sixth member (with highest fitness values; 28% and 30%) in the next iteration (second column). The average fitness of all members is shown on the graph below, illustrating how it increases progressively throughout the optimization process until convergence after 62 iterations. In this example, fitness criteria f1 (force precision) and f2 (rate of force development) were assigned the highest weights. B, examples of the performance (force steadiness and maximum rate of force generation) of two selected motor unit populations from (A). The grey lines indicates a motor unit population that was excluded in the first iteration (grey square, first line of first column with fitness 20%) and the black lines the best motor unit population of the last iteration (black square, first line of fourth column with fitness 82%). As indicated by the values of CoV of force and time to reach 50% MVC force, the optimized member provided the steadiest force and the fastest force generation. CoV, coefficient of variation; MVC, maximum voluntary contraction.
Figure 3
Figure 3. Optimized motor unit innervation numbers for one of the four simulations representing the leg muscle performed without a fixed association between innervation number and recruitment threshold
The optimized distributions of innervation numbers (expressed as a percentage of the maximum innervation number) were skewed toward low innervation numbers. The average fitness for all 50 members at the final iteration was 75.9 ± 1.8%.
Figure 4
Figure 4. Performance of three MU populations, each optimized with respect to one fitness criterion, and without an imposed association between MU IN and RT
Black lines/bar represents one MU population optimized with respect to force precision (w1= 1, w2= 0, w3= 0), whereas grey lines/bar represents optimized populations with respect to rate of force development (w1= 0, w2= 1, w3= 0) and black dashed lines represent optimizations with respect to fatigue resistance (w1= 0, w2= 0, w3= 1). A, performance of the population optimized with respect to force precision (black) is highlighted (bold line) and the average parameters of all 50 MU populations are reported (black box). Similarly, the performance of the two other populations are highlighted (with bold line in B and C) and their parameters (average ±s.d.) reported in (B) and (C). The level of force steadiness (A) was highest for the MU population optimized for this feature (black line). This was achieved with a high number of MUs (black box in A). Similarly the other MU populations (grey and black, dashed) were visibly better with respect to rate of force development (B) and fatigue resistance (C), and both had very low number of MUs (grey box in B and black, dashed-line box in C). IN ratio, lowest innervation numbers expressed as a percentage of the highest INs in the MU population; low IN MUs, the proportion of MUs with INs less than half of the maximum IN in the MU population; MU, number of motor units; MVC, maximum voluntary contraction; r, correlation coefficient between IN and MU twitch contraction time (CT) and recruitment threshold (RT), respectively.
Figure 5
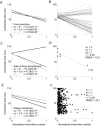
Figure 5. The relation between innervation number and recruitment threshold in the optimized models
Recruitment thresholds were expressed in units of excitation, normalized to the maximum recruitment threshold of the motor unit population. A, each of the three lines represents the average of simulations in which the weight of the force precision criteria was assigned either 0 (black), 0.5 (dark grey) or 1 (light grey). The lines represent the average regression lines for all optimized models with this fitness weight. The mean ±s.d. correlation coefficient of each line is reported (*correlations significantly different from zero). The average RMSE was between 0.28 and 0.31. A, strongest relation between innervation number and recruitment threshold (r= 0.16 ± 0.21) occurred at w1= 0. Similarly, (C) and (E) show the average regression lines for rate of force development and fatigue resistance, respectively. B, all average regression lines for the 52 simulations performed with different combinations of fitness weights. In this way, the three lines in (A) represent the average of three subgroups of the lines in (B), divided according to the value assigned to w1 (and similarly for w2 and w3 in C and E). D, data from the motor unit population (of the 50 populations optimized within each setting of the weights of the fitness criteria) with the highest correlation coefficient of the optimization setting that yielded the highest average correlation (w1= 0, w2= 0.5, w3= 0.5). Each dot represents one motor unit and the line represents the best linear fit. Maximum innervation number was 3555. A clear relation is seen in this case (r= 0.93, P < 0.001), but this model contained only 10 motor units. F, in contrast, represents the motor unit population with the largest correlation between innervation number and recruitment threshold for the populations containing more than 150 motor units (w1= 0.5, w2= 0.5, w3= 0.5). The maximum innervation number was 2080. In this case, the correlation was lower, but still significant (r= 0.12, P= 0.04). RMSE, root mean square error.
Figure 6
Figure 6. The relation between innervation number and recruitment threshold with different optimization criteria for force grading sensitivity
Here, the models were optimized with high emphasis on force precision (w1= 1, w2-5= 0.25). A, C and E, representative force trace in response to a linear increase in excitation (thick line) and the optimal relation (dashed line), which was either linear (A), or exponential (with a ratio of 0.4, B, and 0.2, C, between the gains for forces 0–10% MVC and 80–90% MVC) (see text for details). B, D and F, corresponding average linear relations (lines) between normalized values of innervation number and recruitment threshold across the two repetitions of each setting. The grey dots represent the single motor unit innervation number and recruitment threshold for one model realization in each setting with the highest correlation coefficient: (B) r= 0.06; (D) r= 0.22; (F) r= 0.29. MVC, maximum voluntary contraction; RMSE, root mean square error.
Figure 7
Figure 7. The performance of models optimized with (B, D, F, H) and without (A, C, E, G) the imposed association between innervation number and recruitment threshold
The weights of the optimization criteria were: w1= 1, w2= 1, w3= 0.5 (highest priority of force precision and rate of force development). A and B, representative force ramp with the recruitment threshold (grey circles) and twitch properties (grey box) of five motor units. A, motor units with high twitch amplitudes are recruited throughout the contraction, and not only at high contraction levels as in (B). Note the scale of force amplitude is different in the grey box compared to that in the force ramp. In the other panels the performance of the 10 members from each population with the highest fitness are shown concerning the criteria reflecting force precision (C–F) and rate of force development (G, H). The differences between the performance of the two conditions were small. For example, the force steadiness at 5% MVC (C, D) was slightly higher in the case with the imposed association (C), whereas the opposite trend was present for the force grading accuracy (E, F). CoV, coefficient of variation; MVC, maximum voluntary contraction; RMSE, root mean square error.
Figure 8
Figure 8. Optimized motor unit model parameters expressed as a function of the weight assigned to several fitness criteria with (black lines) and without (grey lines) an imposed association between innervation number and recruitment threshold
The parameters depicted are: the optimal number of motor units (A–C), the proportion of motor units with innervation numbers below 50% of the maximum value within that population (D–F) and the ratio between the innervation number of the 5% of the motor units with the lowest and highest innervation numbers respectively (G–I). Each point represents the mean (±s.d.) value over all the simulations in which the weight of one fitness criterion (indicated at the bottom of each column) was assigned one specific value. A, for example, the left-most point represents the 16 simulations in which w1 (weight of force precision criterion) was assigned the value 0.
Figure 9
Figure 9. The relation between innervation number and motor unit twitch contraction times in the optimized models with an imposed association between motor unit innervation number and recruitment threshold
A, each of the three lines represents the average regression lines calculated from all simulations in which the weight of the force precision criteria was assigned either 0 (black), 0.5 (dark grey) or 1 (light grey). The mean ±s.d. correlation coefficient of each line is reported (*correlations significantly different from zero). The average RMSE was between 29.5 and 33.7. In A, the strongest relation between innervation number and recruitment threshold (r=−0.31 ± 0.17) occurred at w1= 0. Similarly, C and E show the average regression lines for rate of force development and fatigue resistance, respectively. B, all average regression lines for the 52 simulations performed with different combinations of the fitness weights. In this way, the three lines in (A) represents the average of three subgroups of the lines in (B), divided according to the value assigned to w1 (and similarly for w2 and w3 in C and E). D, data from the motor unit population (of the 50 populations optimized within each setting) with the highest correlation coefficient of optimization setting that yielded the highest negative average correlation (w1= 0, w2= 1, w3= 1). Each dot represents one motor unit and the line represents the best linear fit. Maximum innervation number was 14,662. A strong negative relation is seen in this case (r=−0.95, P < 0.001), but this model contained only nine motor units. In contrast, (F) represents the motor unit population with the highest negative correlation between innervation number and recruitment threshold for the populations containing more than 150 motor units (w1= 1, w2= 1, w3= 1). The maximum innervation number was 2080. In this case, a strong correlation was still present (r=−0.36, P= 0.008). RMSE, root mean square error.

Similar articles

Cited by

References

    1. Barry BK, Pascoe MA, Jesunathadas M, Enoka RM. Rate coding is compressed but variability is unaltered for motor units in a hand muscle of old adults. J Neurophysiol. 2007;97:3206–3218. - PubMed
    1. Bolstad G, Ersland A. Energy metabolism in different human skeletal muscles during voluntary isometric contractions. Eur J Appl Physiol Occup Physiol. 1978;38:171–179. - PubMed
    1. Burke RE. Some unresolved issues in motor unit research. Adv Exp Med Biol. 2002;508:171–178. - PubMed
    1. Burke RE, Levine DN, Tsairis P, Zajac FE., 3rd Physiological types and histochemical profiles in motor units of the cat gastrocnemius. J Physiol. 1973;234:723–748. - PMC - PubMed
    1. Butler JE, Gandevia SC. The output from human inspiratory motoneurone pools. J Physiol. 2008;586:1257–1264. - PMC - PubMed

Publication types

LinkOut - more resources