. 2013 Dec 15;591(24):6193-208.
doi: 10.1113/jphysiol.2013.264747. Epub 2013 Oct 21.

Distribution and Ca(2+) signalling of fibroblast-like (PDGFR(+)) cells in the murine gastric fundus

Affiliations

Distribution and Ca(2+) signalling of fibroblast-like (PDGFR(+)) cells in the murine gastric fundus

Salah A Baker et al. J Physiol. .

Abstract

Platelet-derived growth factor receptor α positive (PDGFRα(+)) cells are suggested to mediate purinergic inputs in GI muscles, but the responsiveness of these cells to purines in situ has not been evaluated. We developed techniques to label and visualize PDGFRα(+) cells in murine gastric fundus, load cells with Ca(2+) indicators, and follow their activity via digital imaging. Immunolabelling demonstrated a high density of PDGFRα(+) cells in the fundus. Cells were isolated and purified by fluorescence-activated cell sorting (FACS) using endogenous expression of enhanced green fluorescent protein (eGFP) driven off the Pdgfra promoter. Quantitative PCR showed high levels of expression of purinergic P2Y1 receptors and SK3 K(+) channels in PDGFRα(+) cells. Ca(2+) imaging was used to characterize spontaneous Ca(2+) transients and responses to purines in PDGFRα(+) cells in situ. ATP, ADP, UTP and β-NAD elicited robust Ca(2+) transients in PDGFRα(+) cells. Ca(2+) transients were also elicited by the P2Y1-specific agonist (N)-methanocarba-2MeSADP (MRS-2365), and inhibited by MRS-2500, a P2Y1-specific antagonist. Responses to ADP, MRS-2365 and β-NAD were absent in PDGFRα(+) cells from P2ry1((-/-)) mice, but responses to ATP were retained. Purine-evoked Ca(2+) transients were mediated through Ca(2+) release mechanisms. Inhibitors of phospholipase C (U-73122), IP3 (2-APB), ryanodine receptors (Ryanodine) and SERCA pump (cyclopiazonic acid and thapsigargin) abolished Ca(2+) transients elicited by purines. This study provides a link between purine binding to P2Y1 receptors and activation of SK3 channels in PDGFRα(+) cells. Activation of Ca(2+) release is likely to be the signalling mechanism in PDGFRα(+) cells responsible for the transduction of purinergic enteric inhibitory input in gastric fundus muscles.


Figures

Figure 1
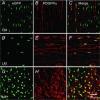
Figure 1. Distribution of PDGFRα+ cells in the fundus
Whole mount double immunolabelling for PDGFRα (green) and Kit (red) in circular muscle layer (CM; A–C), in the longitudinal muscle layer (LM; D–F) and in the region of the myenteric plexus (MY; G–I). No co-localization was observed between PDGFRα+ cells and Kit+ cells in any muscle layer (C, F and I). J–L, immunolabelling for PDGFRα (green) and SK3 (red) in MY region of gastric fundus. Expression of SK3 channels is observed in PDGFRα cells in the fundus. Scale bar in L is 50 μm and pertains to all panels.
Figure 2
Figure 2. Relation of PDGFRα+ cells to motor nerves in the fundus
Whole mount double immunolabelling for PDGFRα (green) and the pan neuronal marker PGP 9.5 (red) (A–C), double immunolabelling for PDGFRα (green) and nNOS (red) (D–F), double immunolabelling for PDGFRα (green) and vAChT (red) (G–I) in circular muscle layer (CM) of the fundus. PDGFRα+ cells track closely along the processes of enteric motor neurons in both muscle layers. Scale bar in I is 50 μm and pertains to all panels.
Figure 3
Figure 3. Nuclear eGFP driven off promoter for Pdgfra is an accurate reporter for PDGFRα+ cells
Whole mount immunolabelling for eGFP (green) and PDGFRα (red) in circular muscle layer (CM; A–C), in the longitudinal muscle layer (LM; D–F) and in the region of the myenteric plexus (MY; G–I) of murine gastric fundus. eGFP is confined to nuclei because it is fused to histone 2B, while PDGFRα is expressed in plasma membranes. Scale bar in I is 50 μm and pertains to all panels.
Figure 4
Figure 4. Expression of purinergic P2Y receptors and SK channels in PDGFRα+ cells
A, relative expression comparison of P2Y receptor transcripts (P2ry1, P2ry2, P2ry3, P2ry4, P2ry6, P2ry12, P2ry13 and P2ry14) in sorted PDGFRα+ cells vs. unsorted cells (i.e. dispersions of fundus muscles prior to sorting) revealed by qPCR. Note P2ry1 relative expression was 7.1-fold higher in PDGFRα+ cells (n= 6, P value = 0.002). B, qPCR comparison of SK1, SK2, SK3 and α-Slo expression (Kcnn1, Kcnn2, Kcnn3 and Kcnma1) in sorted-PDGFRα+ cells vs. unsorted cells. Note: Kcnn3 expression was 8.4-fold higher in sorted PDGFRα+ cells (n= 6, P value = 0.001). The relative expression of each gene was normalized to the house-keeping gene GAPDH.
Figure 5
Figure 5. Spontaneous Ca2+ transients in PDGFRα+ cells
A, PDGFRα+ cells in the myenteric region at high magnification (×100). B, An image of maximum Ca2+ fluorescence within eGFP-PDGFRα+ cells. Dotted lines demarcate the cell edges and the square (green) refers to the region of interest in which Ca2+ transients were measured (ROI). C, spontaneous Ca2+ transients in PDGFRα+ cells in the absence of any added drugs. D, spontaneous Ca2+ transients in PDGFRα+ cells before and after TTX (1 μm). E, summary of TTX effects on the frequency of spontaneous Ca2+ transients in PDGFRα+ cells (n= 6, c= 12; P value = 0.008). The bar graphs represent the average means from each experiment and n number represents each experiment.
Figure 6
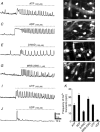
Figure 6. Responses of PDGFRα+ cells to purines (ATP, ADP, β-NAD, UTP and UDP) and P2Y1 agonist MRS-2365
A, Ca2+ transients in an ROI (square in B) in a PDGFRα+ cell elicited by ATP (100 μm) (n= 12, c= 24; P value = 0.0001). B, image of Ca2+ transients in eGFP-PDGFRα+ (eGFP nuclei) cells in response to ATP. The Ca2+ transients were recorded in ROI denoted by the square. C, an example of Ca2+ transients in an ROI (square in D) in a PDGFRα+ cell elicited by ADP (100 μm) (n= 12, c= 24; P value = 0.0001). D, image of Ca2+ transients in eGFP-PDGFRα+ cells in response to ADP. E, Ca2+ transients elicited in a PDGFRα+ cell (ROI: square in F) by β-NAD (100 μm) (n= 12, c= 22; P value = 0.02). F, image of Ca2+ transients in eGFP-PDGFRα+ (eGFP nuclei) in response to β-NAD. G, Ca2+ transients elicited in a PDGFRα+ cell (ROI: square in H) in response to MRS-2365 (1 μm). H, image of Ca2+ transients in eGFP-PDGFRα+ in response to MRS-2365 (n= 12, c= 22; P value = 0.0001). I, Ca2+ transients elicited in a PDGFRα+ cell in response to UTP (100 μm) (n= 6, c= 14; P value = 0.0001). J, Ca2+ transients elicited in a PDGFRα+ cell in response to UDP (100 μm) (n= 5, c= 10; P value = 0.0001). K, summary of changes in the frequency of Ca2+ transients in response to purines (each bar in the graph represents the average of the frequency of Ca2+ transients in response to a given purine and the n value represents the number tissues exposed to each purine). Scale bar in H is 20 μm and pertains to B, D and F panels.
Figure 7
Figure 7. Asynchronous Ca2+ waves in PDGFRα+ cells
A, representative time-sequence images of a spontaneous Ca2+ wave in a PDGFRα+ cell. The duration of the Ca2+ wave was 0.56 s. Images were background corrected and the green outlines in each image denote the cell boundary (n= 6, c= 37; scale bar is 10 μm). B-D, Ca2+ transients were monitored in PDGFRα+ cells before and after ADP. B, Ca2+ transients were recorded in arbitrary units from ROIs defined in several PDGFRα+ cells (coloured squares). Scale bar is 20 μm. C, cytosolic Ca2+ dynamics in 6 PDGFRα+ cells shown in coloured ROIs in C under control conditions and after ADP (D). Ca2+ transients were stochastic and non-propagating events in PDGFRα+ cells before and after stimulation with ADP (n= 6).
Figure 8
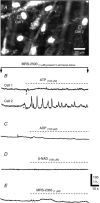
Figure 8. Role of P2Y1 receptors in mediating Ca2+ transients in PDGFRα+ cells
A–E, Ca2+ responses of PDGFRα+ cells in the presence of a P2Y1-receptor specific antagonist MRS-2500 (1 μm). A, example image of Ca2+ transients in eGFP-PDGFRα+ cells (eGFP nuclei) in response to ATP. B, example of Ca2+ transients in PDGFRα+ cells in response to ATP (100 μm). Cell 1 showed no response to ATP in the presence of MRS-2500 and Cell 2 showed an increase in Ca2+ transients (n= 6, c= 20; P value = 0.014). (ROIs of Cells 1 and 2 are marked by the squares in A) Ca2+ responses to ADP (C), β-NAD (D) and MRS-2365 (E) in PDGFRα+ cells were blocked by MRS-2500.
Figure 9
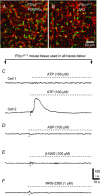
Figure 9. Effects of ATP, ADP, β-NAD and MRS-2365 in PDGFRα+ cells from P2ry1(/) mice
A, whole mount double immunolabelling for eGFP-PDGFRα (green eGFP nuclei) and PDGFRα (red, A) and SK3 (red, B) antibodies in PDGFRα+ cells from P2Y1(−/−) mice. C–F, Ca2+ transients in response to purines were attenuated in PDGFRα+ cells of P2Y1(−/−) mice. C, example of Ca2+ transients in PDGFRα+ cells in response to ATP (100 μm). No response was elicited in some cells (e.g. Cell 1), but others showed a rise in Ca2+ that gradually tapered off during the exposure (e.g. Cell 2; n= 5, c= 10). The other purines tested (ADP (D), β-NAD (E) and MRS-2365 (F)) failed to elicit Ca2+ transients in PDGFRα+ cells of P2Y1(−/−) mice. (For all C, D, E and F, n= 5).
Figure 10
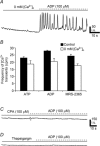
Figure 10. Contribution of extracellular [Ca2+]o and SERCA pump to purinergic Ca2+ transients in PDGFRα+ cells
A, Ca2+ responses in PDGFRα+ cells to ADP (100 μm) were not blocked after bathing cells in 0 mm[Ca2+]o for 20 min. B, summary of Ca2+ transient frequency in PDGFRα+ cells in the presence of 2.5 mm[Ca2+]o (black) vs. 0 mm[Ca2+]o (white) in response to ATP (n= 7, c= 14; P value = 0.02), ADP (n= 7, c= 14; P value = 0.0017) and MRS-2365 (n= 7, c= 14; P value = 0.01). (Each bar in the graph represents the average of the frequency of Ca2+ transients in response to a given purine and the n value represents the number of tissues exposed to each purine). C, the SERCA pump inhibitor CPA (10 μm) blocked Ca2+ transients in PDGFRα+ cells in response to ADP (100 μm). D, pretreatment of PDGFRα+ cells with thapsigargin (1 μm) inhibited Ca2+ transients in response to ADP (100 μm). All n= 5.
Figure 11
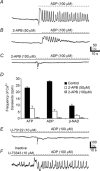
Figure 11. Role of IP3 receptor-operated stores and phospholipase C (PLC) in purinergic responses of PDGFRα+ cells
A, Ca2+ transients elicited in PDGFRα+ cells in response to ADP (100 μm). l-NNA (100 μm) and atropine (1 μm) present in all panels. B, 2-APB (50 μm) reduced Ca2+ transient frequency in PDGFRα+ cells (n= 5, c= 12; P value = 0.001). C, 2-APB (100 μm) blocked most of the response to ADP (n= 5, c= 12; P value = 0.001). D, summary of Ca2+ transient frequency in PDGFRα+ cells in response to purines (ATP, ADP and β-NAD) in control (black) and in the presence of 2-APB (50 μm; white) and 2-APB (100 μm; white with vertical lines) All n= 5. (Each bar in the graph represents the average of the frequency of Ca2+ transients in response to a given purine and the n value represents the number of tissues exposed to each purine). E, PLC inhibitor U-73122 (10 μm; n= 5) blocked responses to ADP in PDGFRα+ cells. However, the inactive analogue U-73343 (10 μm; n= 4) had no significant effect (F).
Figure 12
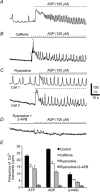
Figure 12. Role of ryanodine receptors in purinergic responses of PDGFRα+ cells
A, Ca2+ transients in PDGFRα+ cells after ADP (100 μm). All traces were recorded in the presence of l-NNA (100 μm) and atropine (1 μm). B, caffeine (10 mm) reduced the frequency of Ca2+ transients in PDGFRα+ cells elicited by ADP (n= 5, c= 12; P value = 0.001). C, ryanodine (50 μm) also reduced Ca2+ transients in PDGFRα+ cells (see Cell 1 and Cell 2; n= 5, c= 14; P value = 0.001). Some PDGFRα+ cells (e.g. Cell 1) displayed increased spontaneous Ca2+ transients in the presence of ryanodine. D, a combination of ryanodine (50 μm) and 2-APB (50 μm) blocked most of the Ca2+ transients in PDGFRα+ cells and responses to purines (n= 5, c= 12; P value = 0.001). E, summary of Ca2+ transient frequency in PDGFRα+ cells in response to purines (ATP and ADP and β-NAD, n= 15) control (black) and in the presence of caffeine (10 mm; white), ryanodine (50 μm; white with horizontal lines) and ryanodine and 2-APB together (50 μm; white cross hatched). Each bar in the graph represents the average of the frequency of Ca2+ transients in response to a given purine and the n value represents the number of tissues exposed to each purine.

Similar articles

Cited by

References

    1. Banks BE, Brown C, Burgess GM, Burnstock G, Claret M, Cocks TM, Jenkinson DH. Apamin blocks certain neurotransmitter-induced increases in potassium permeability. Nature. 1979;282:415–417. - PubMed
    1. Beckett EA, Horiguchi K, Khoyi M, Sanders KM, Ward SM. Loss of enteric motor neurotransmission in the gastric fundus of Sl/Sld mice. J Physiol. 2002;543:871–887. - PMC - PubMed
    1. Blair PJ, Bayguinov Y, Sanders KM, Ward SM. Relationship between enteric neurons and interstitial cells in the primate gastrointestinal tract. Neurogastroenterol Motil. 2012;24:e437–e449. - PMC - PubMed
    1. Bootman MD, Collins TJ, Mackenzie L, Roderick HL, Berridge MJ, Peppiatt CM. 2-Aminoethoxydiphenyl borate (2-APB) is a reliable blocker of store-operated Ca2+ entry but an inconsistent inhibitor of InsP3-induced Ca2+ release. FASEB J. 2002;16:1145–1150. - PubMed
    1. Burns AJ, Lomax AE, Torihashi S, Sanders KM, Ward SM. Interstitial cells of Cajal mediate inhibitory neurotransmission in the stomach. Proc Natl Acad Sci U S A. 1996;93:12008–12013. - PMC - PubMed

Publication types

MeSH terms

LinkOut - more resources