. 2014 Jan;34(1):16-29.
doi: 10.1128/MCB.00578-13. Epub 2013 Oct 21.

Microtubule dynamic instability controls podosome patterning in osteoclasts through EB1, cortactin, and Src

Affiliations

Microtubule dynamic instability controls podosome patterning in osteoclasts through EB1, cortactin, and Src

Martin Biosse Duplan et al. Mol Cell Biol. 2014 Jan.

Abstract

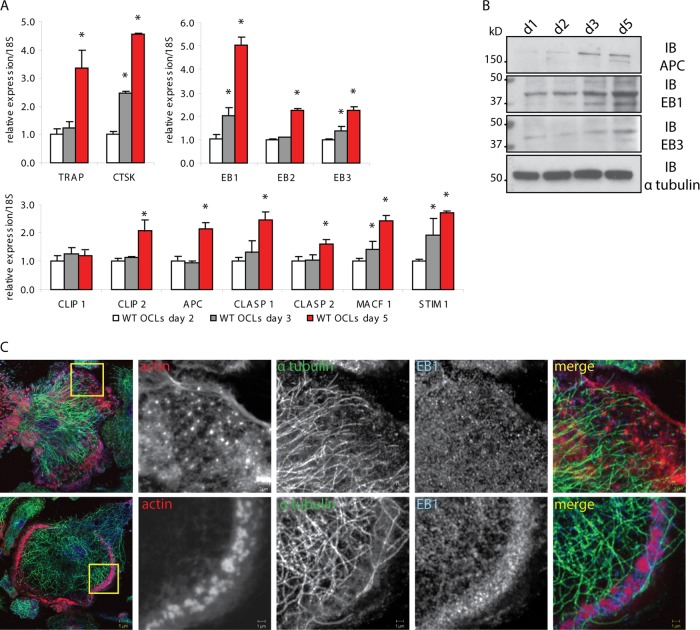
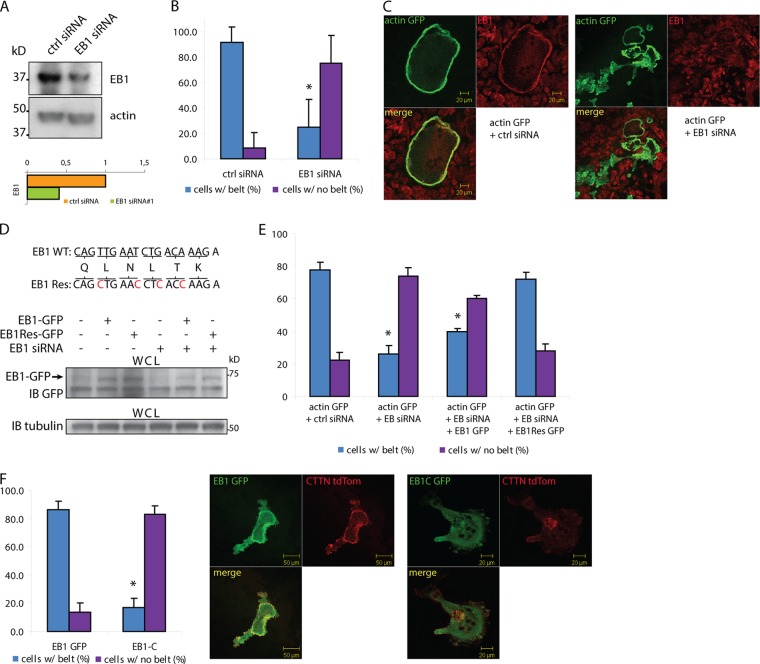
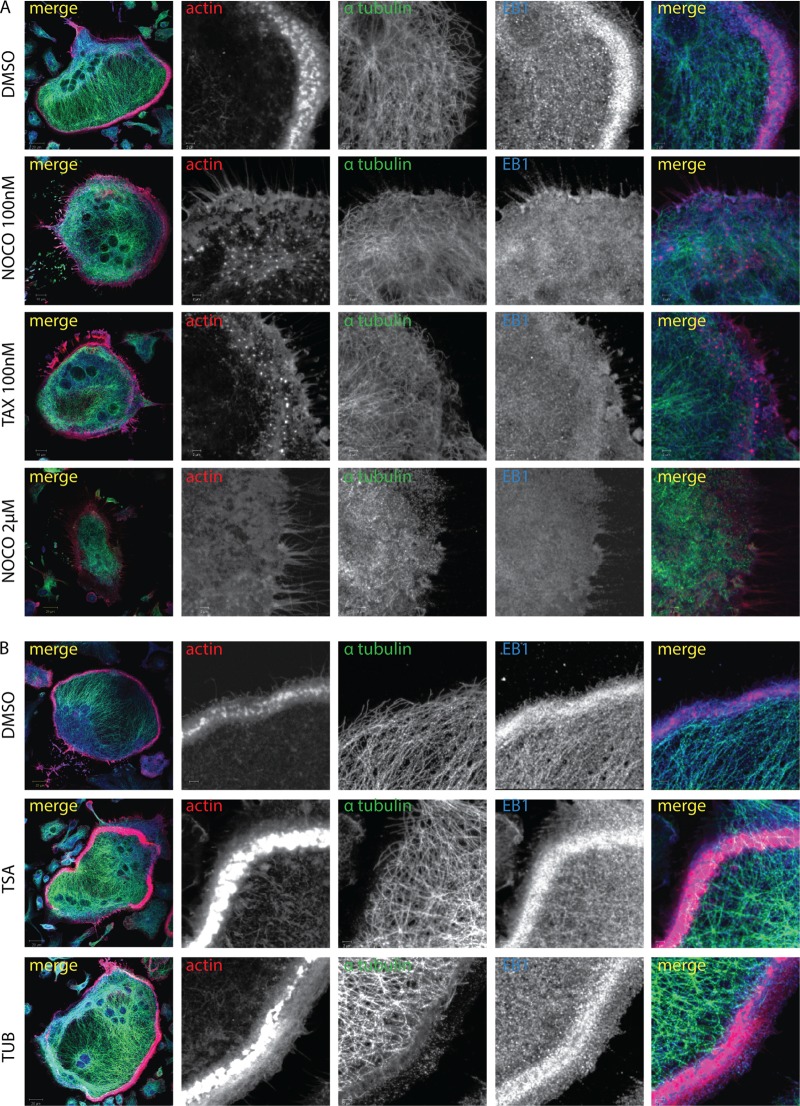
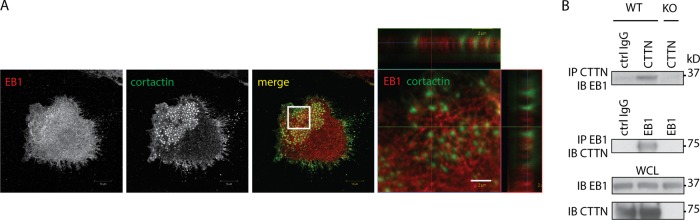
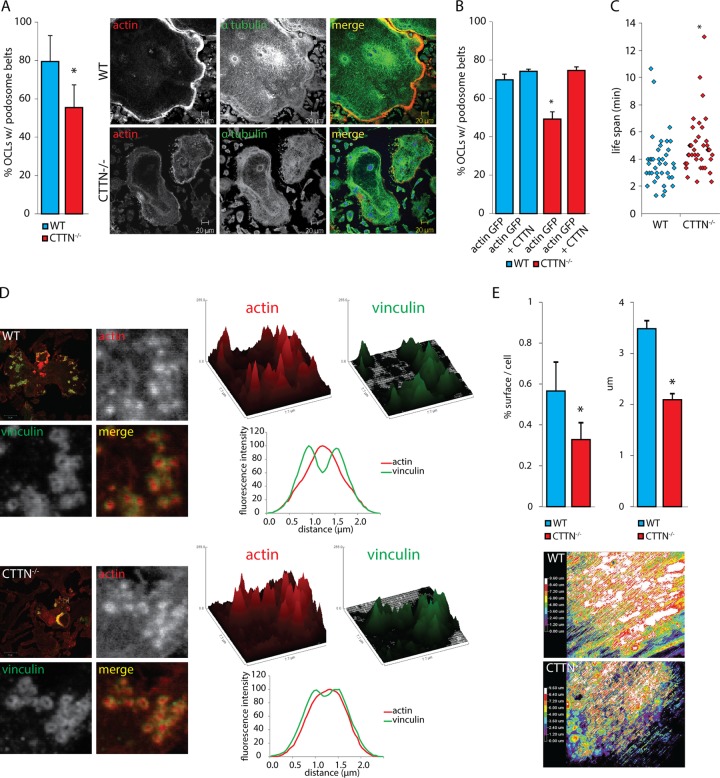
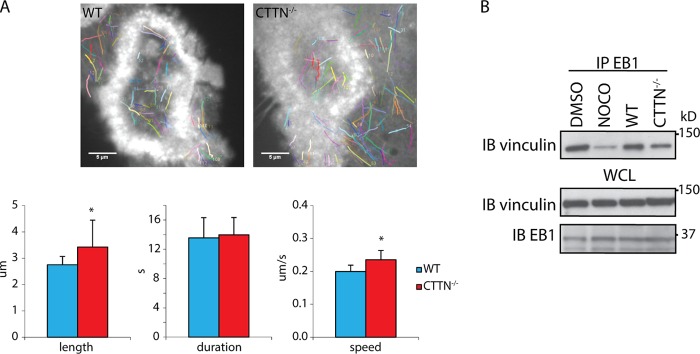
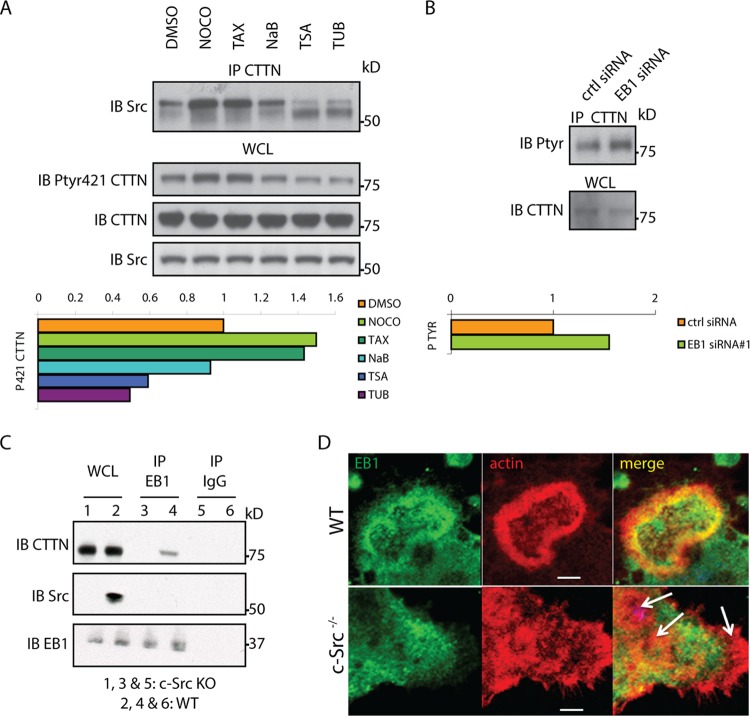
In osteoclasts (OCs) podosomes are organized in a belt, a feature critical for bone resorption. Although microtubules (MTs) promote the formation and stability of the belt, the MT and/or podosome molecules that mediate the interaction of the two systems are not identified. Because the growing "plus" ends of MTs point toward the podosome belt, plus-end tracking proteins (+TIPs) might regulate podosome patterning. Among the +TIPs, EB1 increased as OCs matured and was enriched in the podosome belt, and EB1-positive MTs targeted podosomes. Suppression of MT dynamic instability, displacement of EB1 from MT ends, or EB1 depletion resulted in the loss of the podosome belt. We identified cortactin as an Src-dependent interacting partner of EB1. Cortactin-deficient OCs presented a defective MT targeting to, and patterning of, podosomes and reduced bone resorption. Suppression of MT dynamic instability or EB1 depletion increased cortactin phosphorylation, decreasing its acetylation and affecting its interaction with EB1. Thus, dynamic MTs and podosomes interact to control bone resorption.


Figures

FIG 1
FIG 1
EB1 expression increases in mature osteoclasts and localizes around the podosomes. (A) The expression of OC differentiation markers and +TIPs during OC differentiation was measured by RT-qPCR in WT OCs, generated from bone marrow macrophages cultured with M-CSF and RANKL and stopped at the indicated time points. TRAP and cathepsin K (CTSK) were used as OC differentiation markers. The expression of several +TIPs, including EB1, increased during the differentiation in mature cells. (B) Expression of several +TIPs was detected by immunoblotting (IB) using WT OC lysates and specific antibodies against APC, EB1, and EB3. α-Tubulin was used to control equal loading. d, day. (C) Immunolocalization of actin, α-tubulin, and EB1 was analyzed by confocal microscopy in WT OCs fixed at day 3 (upper row) and day 5 (lower row). In differentiating OCs with clusters of individual podosomes, EB1 was present on MTs and frequently accumulated around individual podosomes. In mature OCs with podosome belts, EB1 colocalized with densely packed podosomes in the belt. Data are presented as means ± SD. *, P < 0.05, significant difference from the control (day 2). OCL, osteoclast lysate.
FIG 2
FIG 2
Depletion of EB1 strongly reduces podosome belt formation. (A) The effect of EB1 deletion on podosome belt formation was investigated by knocking down EB1 using siRNA. The functionality of the siRNA was first tested by transfecting RAW264.7 cells, and EB1 expression levels were assessed by Western blotting after 24 h. (B) The siRNA was microinjected along with a plasmid encoding actin-GFP in differentiating OCs that do not have a podosome belt. MISSION siRNA universal negative control was used as a control. The cells were allowed to differentiate for 24 h and fixed. The number of actin-GFP cells with podosome belts was quantified. More than 65 GFP-positive cells were counted for the presence or absence of podosome belts. (C) OCs were microinjected as described for panel B, fixed after 24 h, and stained for EB1 to assess the reduced expression of EB1 in cells microinjected with EB1 siRNA. (D) A mutant EB1-GFP was designed (EB1Res-GFP) that bears silent point mutations in the siRNA target sequence, preventing siRNA binding to the mRNA. Resistance of EB1Res to the siRNA was confirmed following transfection in RAW264.7 cells (compare lanes 2 and 5 with lanes 3 and 6). WCL, whole-cell lysate. (E) Microinjection of EB1Res-GFP along with EB1 siRNA strongly reduced the siRNA effect, whereas the siRNA still affected podosome belt formation when injected with EB1-GFP. More than 200 GFP-positive cells were counted for the presence or absence of a podosome belt. (F) OCs were microinjected with either EB1-GFP or EB1C-GFP, a mutant construct that lacks the N-terminal half necessary for MT binding. The number of actin-GFP cells with a podosome belt was counted 24 h after microinjection. EB1C-GFP induced a strong reduction in podosome belt formation. More than 65 GFP-positive cells were counted for the presence or absence of a podosome belt. Data are presented as means ± SD. *, P < 0.05, significant difference from control.
FIG 3
FIG 3
Suppression of microtubule dynamic instability and displacement of EB1 from microtubule ends disrupts the podosome belt. (A) Mature OCs generated from WT BMMs with RANKL/M-CSF were treated with DMSO, nocodazole (Noco; 100 nM or 2 μM for 30 min), or paclitaxel (Tax; 100 nM for 30 min) and fixed, and the immunolocalization of actin, tubulin (Tub), and EB1 was analyzed by confocal microscopy. Treatments with low doses of nocodazole (100 nM) and paclitaxel induced the loss of the podosome belt and EB1 concentration at the belt without inducing the collapse of the entire MT network, in contrast to results with a high dose of nocodazole (2 μM). (B) Mature OCs were generated as described for panel A and treated with DMSO, TSA (500 nM, 1 h), or tubacin (2 μM, 1 h). Inhibition of HDAC6 induced a wider and denser podosome belt, where EB1 accumulated.
FIG 4
FIG 4
EB1 and cortactin form a molecular complex in osteoclasts. (A) Colocalization of cortactin with EB1 in podosome clusters from WT OCs and an x-z series image of individual podosomes. (B) Co-IP experiments performed using lysates of OCs derived from BMMs of WT mice showed an interaction between EB1 and cortactin. The same experiment using irrelevant antibody or lysates from CTTN−/− OCs did not show any interaction.
FIG 5
FIG 5
Cortactin deletion alters the dynamics of podosomes. (A) Mature OCs (day 5) generated from BMMs of WT and CTTN−/− mice were fixed and stained for actin and α-tubulin, and the number of cells with a podosome belt was counted. More than 500 OCs per genotype were counted for the presence or absence of a podosome belt. (B) Differentiating OCs (day 4) generated from BMMs of WT and CTTN−/− mice were microinjected with actin-GFP alone or together with CTTN-tdTomato. After 24 h, cells were fixed, and the number of actin-GFP-positive OCs with a podosome belt was counted. More than 200 GFP-positive cells were counted. (C) Differentiating WT and CTTN−/− OCs were microinjected with expression vector for GFP-actin and observed by time-lapse microscopy. Individual podosomes in clusters were followed, and their life span (the overall time in which a fluorescently labeled podosome exists) was calculated and plotted. Eighty individual podosomes were analyzed. (D) WT and CTTN−/− OCs were fixed and stained for vinculin (green) and F-actin (red). Analysis of individual podosomes by processing the actin and vinculin images with the a three-dimensional surface plot plug-in revealed a larger actin cloud and disorganized vinculin ring. Fluorescence intensity profiles for actin and vinculin in individual podosomes from WT and CTTN−/− OCs were calculated from measurements of over 200 podosomes. (E) The average resorbed area was measured after toluidine blue staining of dentin slices plated with WT and CTTN−/− OCs and was normalized by the number of OCs on the slices, identified by TRAP staining. Pit depth was measured by confocal microscopy. OCs were plated on dentin slices and allowed to resorb for 12 h. OCs were then removed from the slices that were stained with rhodamine. A z series was acquired with a confocal microscope, and color-coded images of the depth of the pits were generated with ImageJ. Data are presented as means ± SD. *, P < 0.05, significant difference from control.
FIG 6
FIG 6
Microtubule targeting of podosomes is altered in CTTN−/− osteoclasts. (A) GFP-positive structures were manually tracked with the ImageJ plug-in MtrackJ in WT and CTTN−/− OCs microinjected with GFP-EB1 and mCherry-actin. The duration, length, and speed of the EB1-positive tracks were calculated. A total of 10 cells were analyzed for MT dynamics. (B) EB1 interaction with vinculin, a marker of podosomes, was assessed by co-IP in WT OCs treated with DMSO or nocodazole (100 nm, 30 min) and in nontreated CTTN−/− OCs.
FIG 7
FIG 7
Microtubules and EB1 regulate cortactin phosphorylation. (A) WT OCs with podosome belts were treated as described previously with DMSO, nocodazole, paclitaxel, TSA, or tubacin, and the level of cortactin phosphorylation was measured by Western blotting with a specific anticortactin phospho-Tyr421 antibody. The membrane was then stripped and reprobed with an anticortactin antibody. The ratio of phosphorylated to total cortactin was determined by densitometry using ImageJ. Cortactin interaction with Src was detected by co-IP in the same lysates. (B) Cortactin phosphorylation was measured in RAW264.7 cells following EB1 depletion by siRNA by immunoprecipitating cortactin and probing with a pan-phosphotyrosine antibody (4G10). The ratio of phosphorylated to total cortactin was determined by densitometry using ImageJ. (C) WT osteoclasts or c-Src-KO OCs were lysed at day 4, and equal amounts of proteins were immunoprecipitated with either IgG (control) or EB1 antibody. The immunoprecipitated protein was blotted with CTTN, c-Src, and EB1 antibodies. (D) OCs from WT (upper panel) and c-Src−/− (lower panel) mice were generated and cultured on dentin. At day 5, the cells were fixed and stained for EB1 and actin. Arrows indicate clusters of podosomes in c-Src KO OCs. Scale bar, 5 μm.

References

    1. Baron R, Neff L, Brown W, Courtoy PJ, Louvard D, Farquhar MG. 1988. Polarized secretion of lysosomal enzymes: co-distribution of cation-independent mannose-6-phosphate receptors and lysosomal enzymes along the osteoclast exocytic pathway. J. Cell Biol. 106:1863–1872. 10.1083/jcb.106.6.1863 - DOI - PMC - PubMed
    1. Teitelbaum SL, Ross FP. 2003. Genetic regulation of osteoclast development and function. Nat. Rev. Genet. 4:638–649. 10.1038/nrg1122 - DOI - PubMed
    1. Saftig P, Hunziker E, Wehmeyer O, Jones S, Boyde A, Rommerskirch W, Moritz JD, Schu P, von Figura K. 1998. Impaired osteoclastic bone resorption leads to osteopetrosis in cathepsin-K-deficient mice. Proc. Natl. Acad. Sci. U. S. A. 95:13453–13458. 10.1073/pnas.95.23.13453 - DOI - PMC - PubMed
    1. Linder S, Aepfelbacher M. 2003. Podosomes: adhesion hot-spots of invasive cells. Trends Cell Biol. 13:376–385. 10.1016/S0962-8924(03)00128-4 - DOI - PubMed
    1. Linder S, Kopp P. 2005. Podosomes at a glance. J. Cell Sci. 118:2079–2082. 10.1242/jcs.02390 - DOI - PubMed

Publication types

MeSH terms

LinkOut - more resources