

The liver is populated by a broad spectrum of markers for macrophages. In alcoholic hepatitis the macrophages are M1 and M2
- PMID: 24145004
- PMCID: PMC3944995
- DOI: 10.1016/j.yexmp.2013.09.004
The liver is populated by a broad spectrum of markers for macrophages. In alcoholic hepatitis the macrophages are M1 and M2
Abstract
Background: Liver cell injury in alcoholic hepatitis (AH) is in part, due to macrophage generated proinflammatory cytokines i.e., M1, M2a, M2b, and M2c might be involved in ALD. The T cell response to chemokines and cytokines differs not only when M1 and M2 macrophages are compared but even when individual M2 subtypes are profiled.
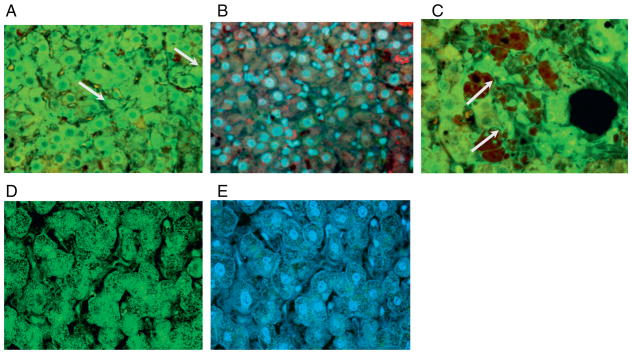
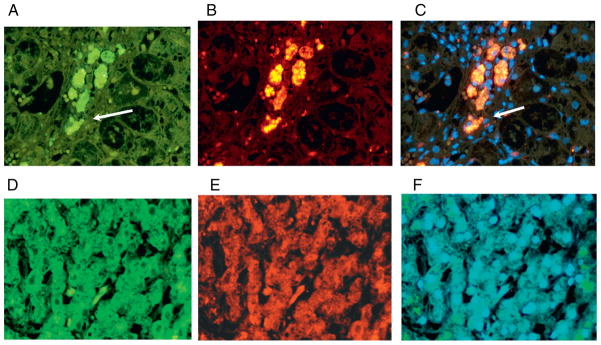
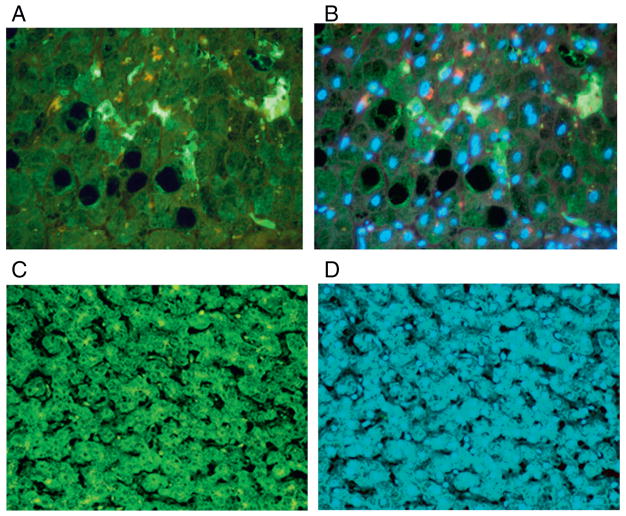
Purpose: In AH, M1 monocytes in the blood show increased sensitivity in the TNF-α response to LPS. Immunohistochemistry (IHC) studies showed that the liver sinusoids in ALD are abundantly populated by CD163 expressing type 2 macrophages. In this report, we profile many of the molecules associated with M1 and M2 macrophages in livers with AH using IHC.
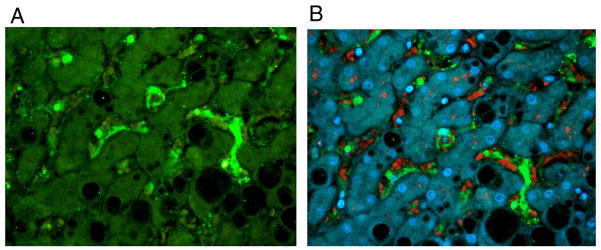
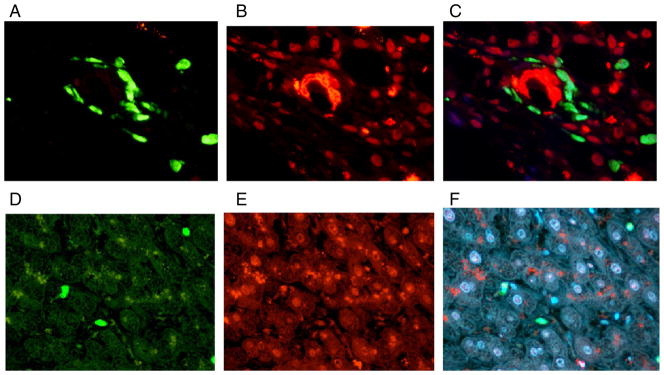
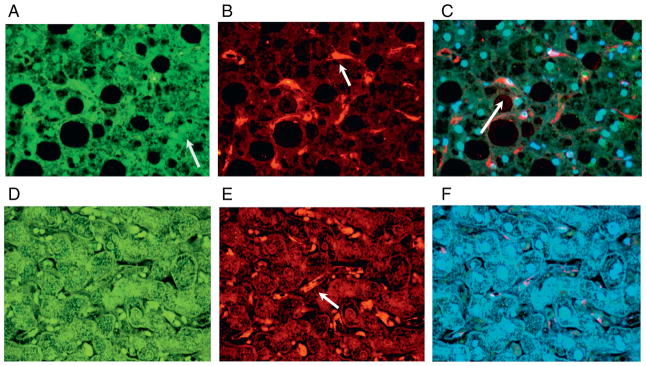
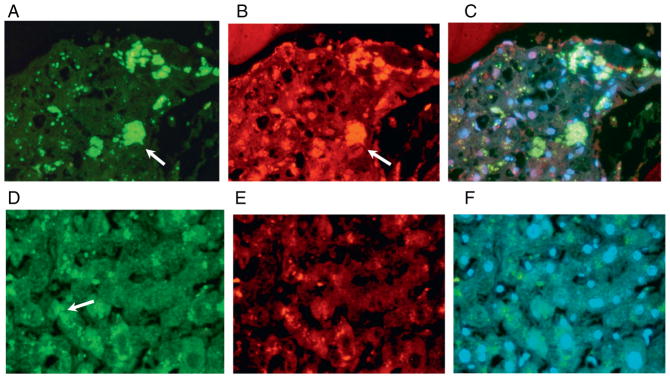
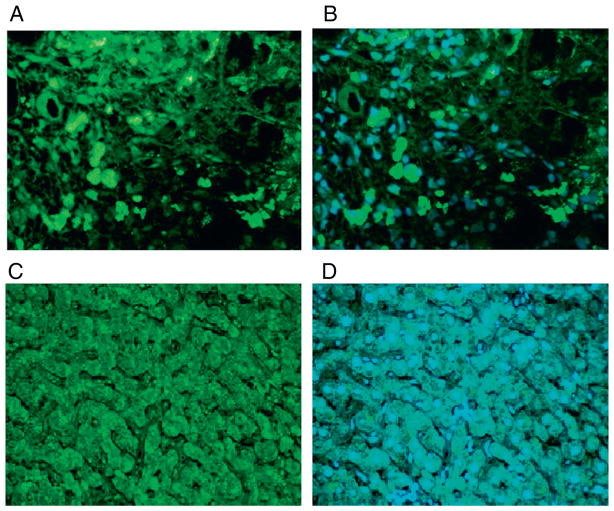
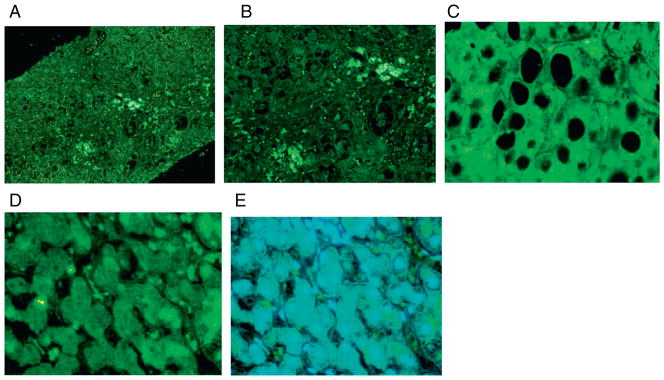
Methods: Using immunofluorescent antibody-labeling, we profiled the receptors, cytokines and chemokines observed in M1, M2a, M2b, and M2c macrophages in liver biopsies from patients with AH.
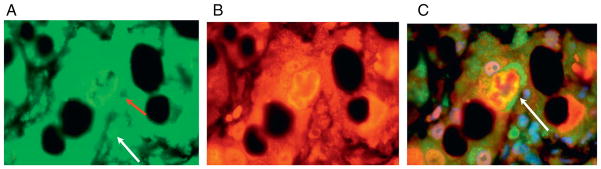
Results: The increased CD 163 expression found in previous studies was confirmed as well an additional macrophage phenotypic marker CD206, suggesting that AH pathogenesis at least partially involves M2a and M2c macrophages. TGF-β was found to be robustly over expressed by liver sinusoidal macrophages. Macrophage expression of the phenotypic markers TLR-2, TLR-4 and TLR-8 - found in both M1 and M2 macrophages - as well as the chemokines CCL-1 and CCL-18 was found. However, IRF-4, which is related to IL-4 production and M2a polarization as well as the cytokines CCL-1 and Il-1β and the chemokine CXCL-1 were also observed, suggesting that M2a and M2b also play a role in AH pathogenesis.
Conclusion: Livers with AH show robust macrophage over expression of TGF-β, a growth factor more commonly associated with M2 type macrophages and mostly known for its fibrogenetic properties. However, our immunoprofiling of macrophage over expression also shows that AH is driven by receptors, interferons, and cytokines that are commonly associated not just with M2 macrophages, but with M1 as well. Thus, a complex interplay between different types of macrophages expressing a diverse array of molecules and receptors is involved in AH.
Keywords: Alcoholic hepatitis; CD163; Macrophages; TLR-4.
© 2013. Published by Elsevier Inc. All rights reserved.
Figures
Similar articles
-
miRNAs Involved in M1/M2 Hyperpolarization Are Clustered and Coordinately Expressed in Alcoholic Hepatitis.Front Immunol. 2019 Jun 7;10:1295. doi: 10.3389/fimmu.2019.01295. eCollection 2019. Front Immunol. 2019. PMID: 31231396 Free PMC article.
-
HCV inhibits M2a, M2b and M2c macrophage polarization via HCV core protein engagement with Toll-like receptor 2.Exp Ther Med. 2022 Jun 16;24(2):522. doi: 10.3892/etm.2022.11448. eCollection 2022 Aug. Exp Ther Med. 2022. PMID: 35837038 Free PMC article.
-
Transcriptomic analysis of human polarized macrophages: more than one role of alternative activation?PLoS One. 2015 Mar 23;10(3):e0119751. doi: 10.1371/journal.pone.0119751. eCollection 2015. PLoS One. 2015. PMID: 25799240 Free PMC article.
-
The Role of M1/M2 Macrophage Polarization in Rheumatoid Arthritis Synovitis.Front Immunol. 2022 May 19;13:867260. doi: 10.3389/fimmu.2022.867260. eCollection 2022. Front Immunol. 2022. PMID: 35663975 Free PMC article. Review.
-
Regulation of macrophage polarization by targeted metabolic reprogramming for the treatment of lupus nephritis.Mol Med. 2024 Jun 25;30(1):96. doi: 10.1186/s10020-024-00866-z. Mol Med. 2024. PMID: 38914953 Free PMC article. Review.
Cited by
-
TLR3/4 signaling is mediated via the NFκB-CXCR4/7 pathway in human alcoholic hepatitis and non-alcoholic steatohepatitis which formed Mallory-Denk bodies.Exp Mol Pathol. 2014 Oct;97(2):234-40. doi: 10.1016/j.yexmp.2014.07.001. Epub 2014 Jul 2. Exp Mol Pathol. 2014. PMID: 24997224 Free PMC article.
-
Spatial, Temporal, and Functional Aspects of Macrophages during "The Good, the Bad, and the Ugly" Phases of Inflammation.Front Immunol. 2014 Dec 3;5:612. doi: 10.3389/fimmu.2014.00612. eCollection 2014. Front Immunol. 2014. PMID: 25520719 Free PMC article. Review. No abstract available.
-
Macrophage Polarization and Its Role in Liver Disease.Front Immunol. 2021 Dec 14;12:803037. doi: 10.3389/fimmu.2021.803037. eCollection 2021. Front Immunol. 2021. PMID: 34970275 Free PMC article. Review.
-
Macrophages and Alcohol-Related Liver Inflammation.Alcohol Res. 2015;37(2):251-62. Alcohol Res. 2015. PMID: 26717583 Free PMC article. Review.
-
Telomerase reverse transcriptase acts in a feedback loop with NF-κB pathway to regulate macrophage polarization in alcoholic liver disease.Sci Rep. 2016 Jan 4;6:18685. doi: 10.1038/srep18685. Sci Rep. 2016. PMID: 26725521 Free PMC article.
References
-
- Benoit M, Desnues B, Mege JL. Macrophage polarization in bacterial infections. J Immunol. 2008;181:3733–3739. - PubMed
-
- Bleesing J, Prada A, Siegel DM, Olson J, Ilowite NT, Brunner HI, Griffin T, Graham TB, Sherry DD, Passo MH, Ramanan AV, Filipovich A, Grom AA. The diagnostic significance of soluble CD163 and soluble interleukin-2 receptor alpha-chain in macrophage activation syndrome and untreated new-onset systemic juvenile idiopathic arthritis. Arthritis Rheum. 2007;56:965–971. - PubMed
-
- Branton MH, Kopp JB. TGF-β and fibrosis. Microbes Infect. 1999;1 (15):1349–1365. - PubMed
-
- Chen CL, Tsukamoto H, Liu JC, Kashiwabara C, Feldman D, Sher L, Dooley S, French SW, Mishra L, Petrovic L, Jeong JH, Machida K. Reciprocal regulation by TLR4 and TGF-β in tumor-initiating stem-like cells. J Clin Invest. 2013;123 (7):2832–2849. http://dx.doi.org/10.1172/JCI65859. - DOI - PMC - PubMed
-
- Dobrovolskaia MA, Vogel SN. Toll receptors, CD14, and macrophage activation and deactivation by LPS. Microbes Infect. 2002;4 (9):903–914. - PubMed
Publication types
MeSH terms
Substances
Grants and funding
LinkOut - more resources
Full Text Sources
Other Literature Sources
Research Materials
Miscellaneous
