. 2013 Dec:250:321-32.
doi: 10.1016/j.expneurol.2013.10.010. Epub 2013 Oct 18.

TRPV1 antagonist capsazepine suppresses 4-AP-induced epileptiform activity in vitro and electrographic seizures in vivo

Affiliations

TRPV1 antagonist capsazepine suppresses 4-AP-induced epileptiform activity in vitro and electrographic seizures in vivo

Luis E Gonzalez-Reyes et al. Exp Neurol. 2013 Dec.

Abstract

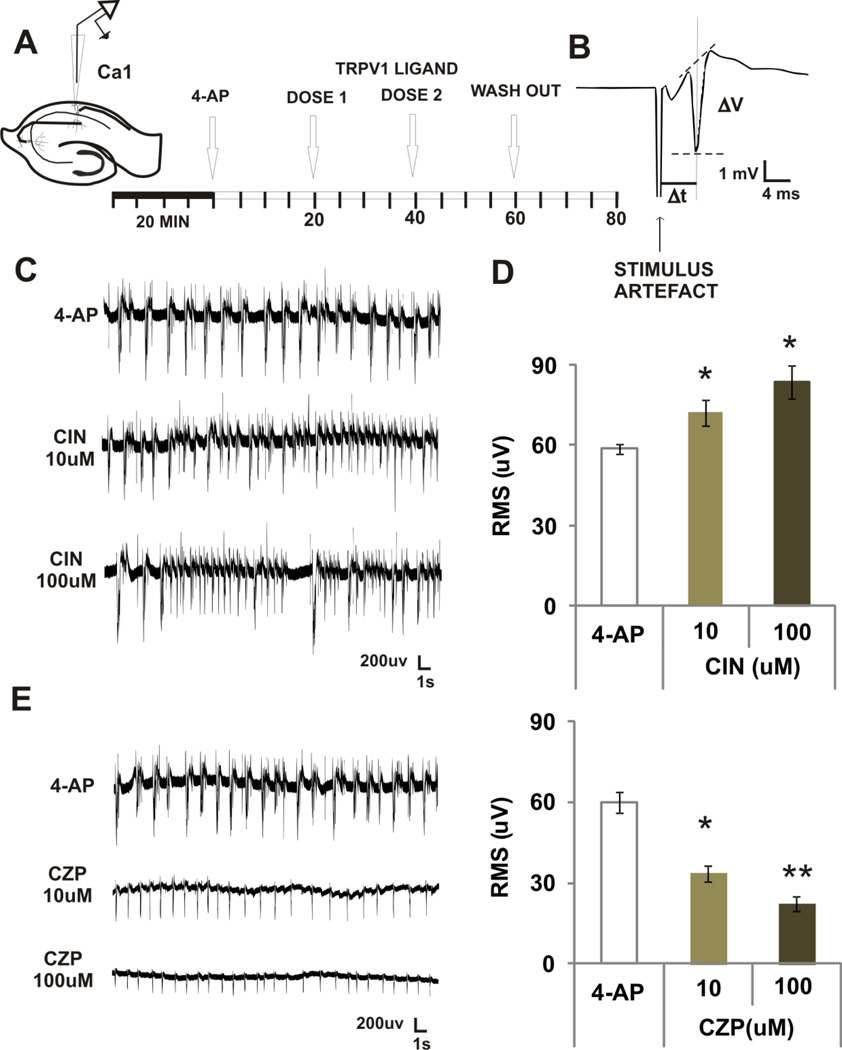
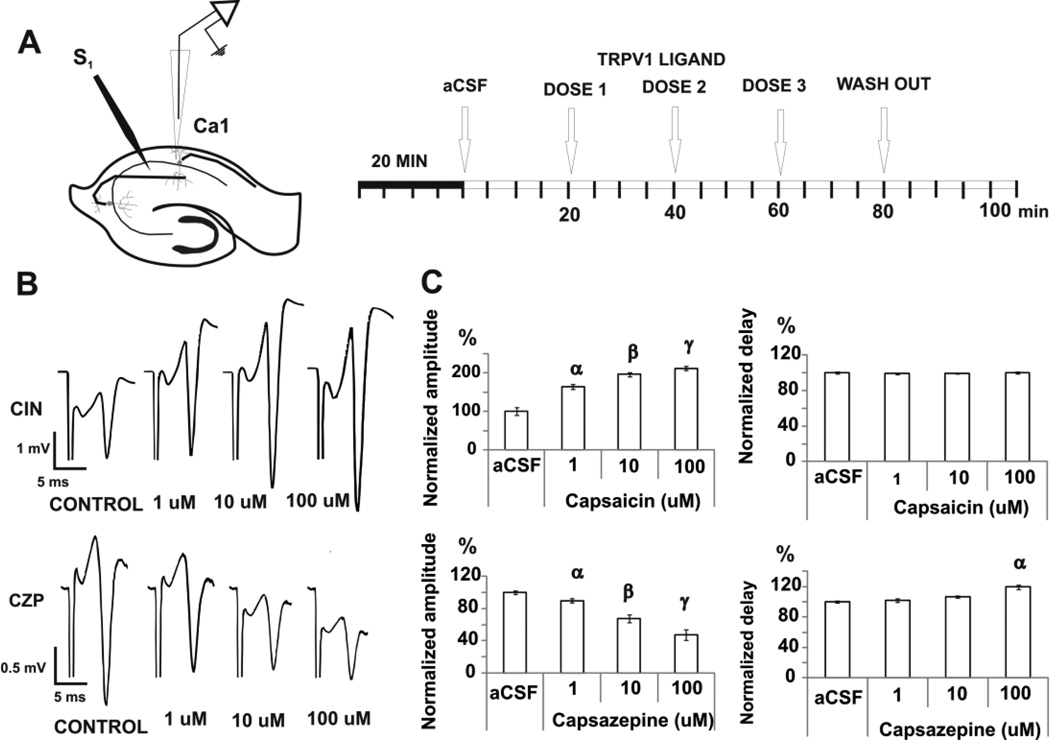
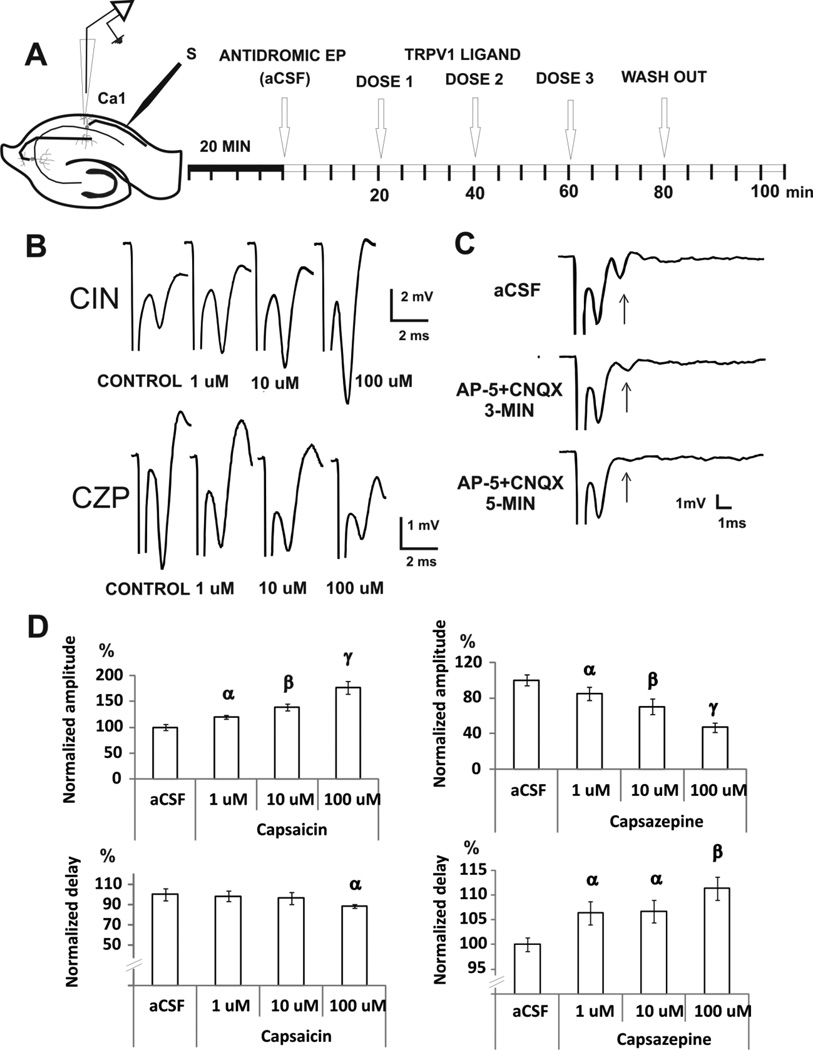
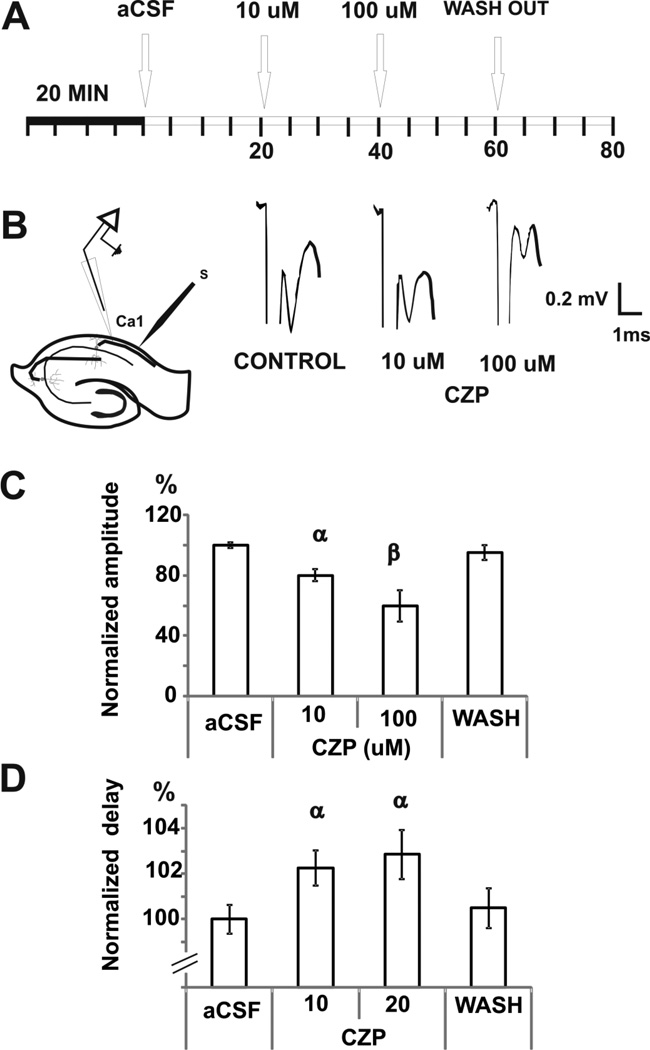
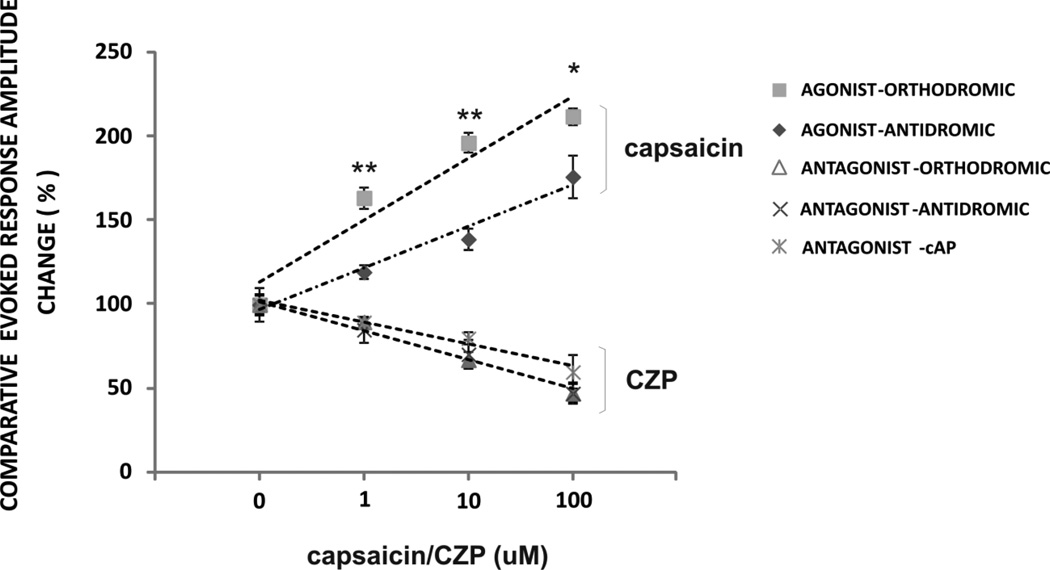
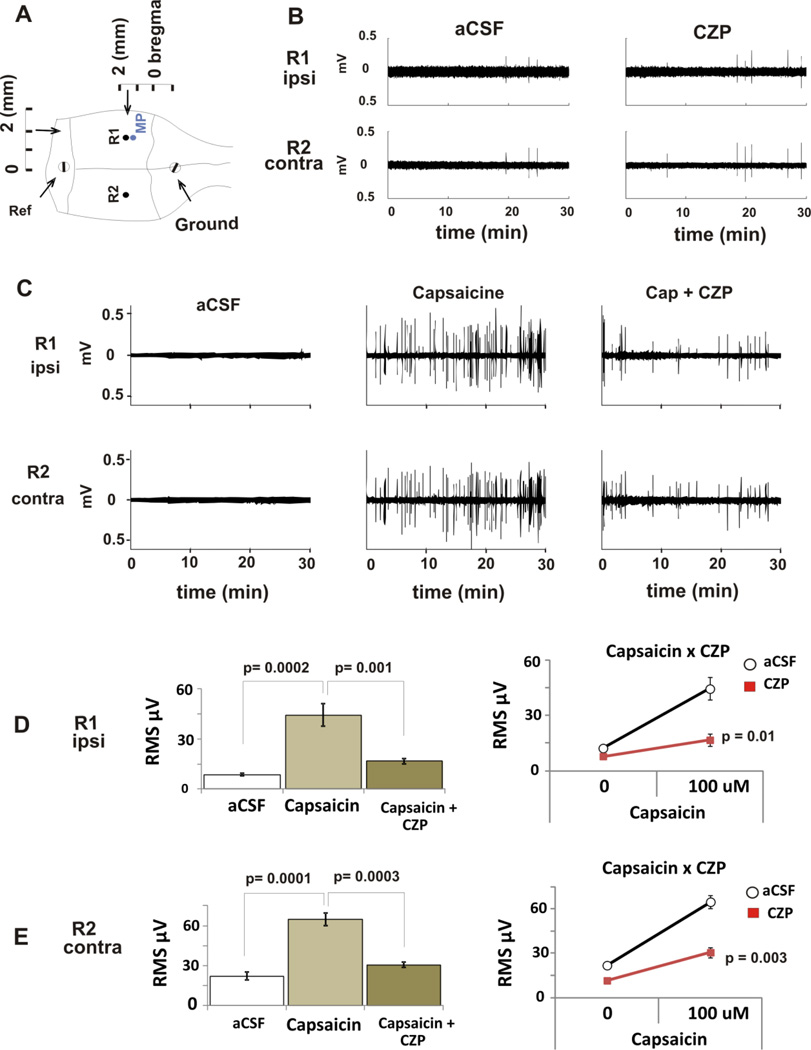
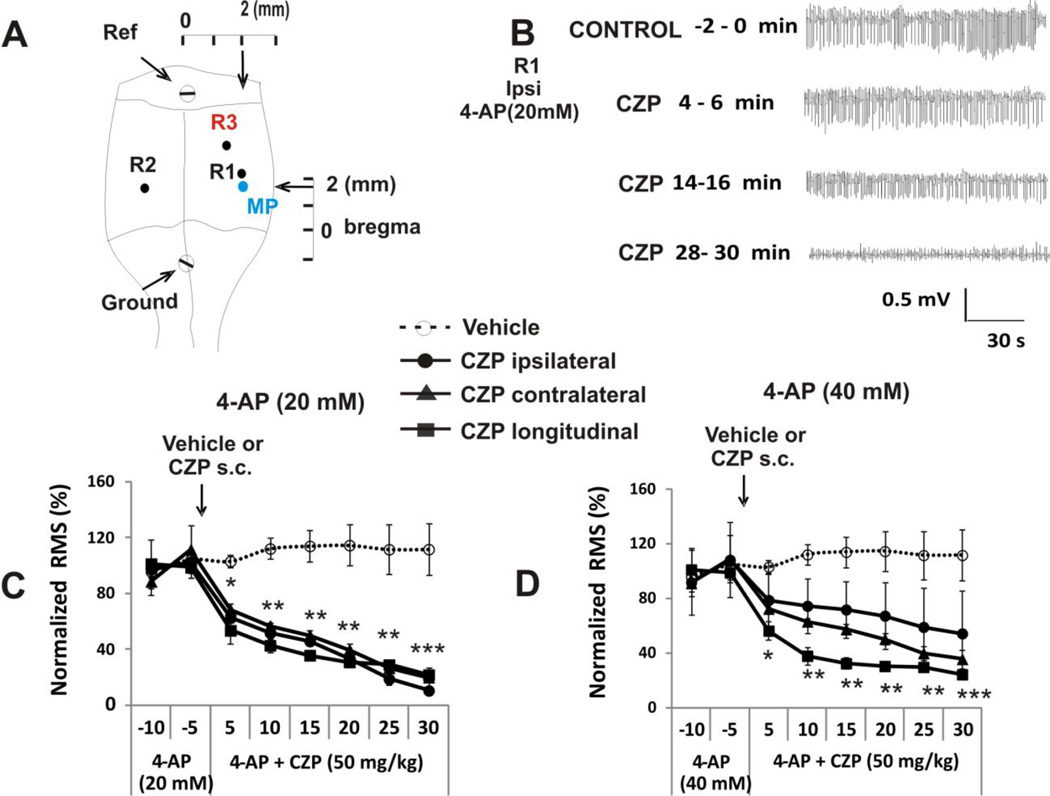
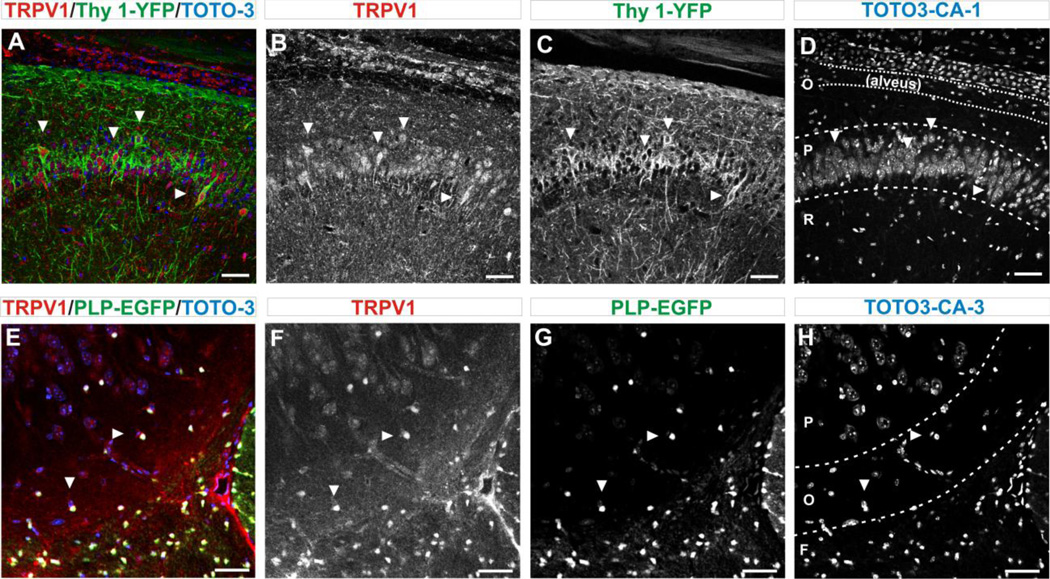
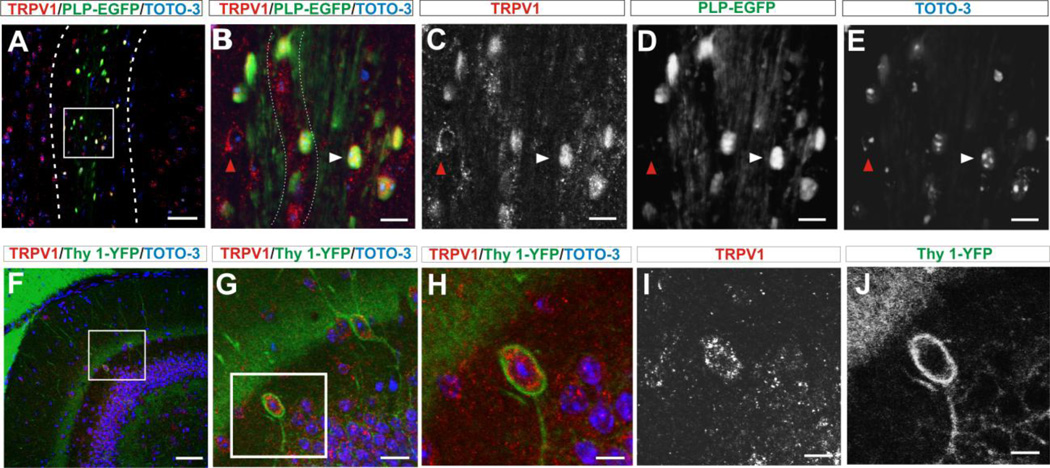
Transient receptor potential vanilloid 1 (TRPV1) is a cation-permeable ion channel found in the peripheral and central nervous systems. The membrane surface expression of TRPV1 is known to occur in neuronal cell bodies and sensory neuron axons. TRPV1 receptors are also expressed in the hippocampus, the main epileptogenic region in the brain. Although, previous studies implicate TRPV1 channels in the generation of epilepsy, suppression of ongoing seizures by TRPV1 antagonists has not yet been attempted. Here, we evaluate the role of TRPV1 channels in the modulation of epileptiform activity as well as the anti-convulsant properties of capsazepine (CZP), an established TRPV1 competitive antagonist, using in vitro and in vivo models. To this end, we used 4-aminopyridine (4-AP) to trigger seizure-like activity. We found that CZP suppressed 4-AP induced epileptiform activity in vitro (10-100μM) and in vivo (50mg/kg s.c.). In contrast, capsaicin enhanced 4-AP induced epileptiform activity in vitro (1-100μM) and triggered bursting activity in vivo (100μM dialysis perfusion), which was abolished by the TRPV1 antagonist CZP. To further investigate the mechanisms of TRPV1 modulation, we studied the effect of capsaicin and CZP on evoked potentials. Capsaicin (1-100μM) and CZP (10-100μM) increased and decreased, respectively, the amplitude of extracellular field evoked potentials in a concentration-dependent manner. Additional in vitro studies showed that the effect of the TRPV1 blocker on evoked potentials was similar whether the response was orthodromic or antidromic, suggesting that the effect involves interference with membrane depolarization on cell bodies and axons. The fact that CZP could act directly on axons was confirmed by decreased amplitude of the compound action potential and by an increased delay of both the antidromic potentials and the axonal response. Histological studies using transgenic mice also show that, in addition to the known neural expression, TRPV1 channels are widely expressed in alvear oligodendrocytes in the hippocampus. Taken together, these results indicate that activation of TRPV1 channels leads to enhanced excitability, while their inhibition can effectively suppress ongoing electrographic seizures. These results support a role for TRPV1 channels in the suppression of convulsive activity, indicating that antagonism of TRPV1 channels particularly in axons may possibly be a novel target for effective acute suppression of seizures.

Keywords: 4-AP; Capsaicin; Capsazepine; Electrophysiology; Epilepsy; Oligodendrocytes; TRPV1 channels.


Figures

FIGURE 1
FIGURE 1. EFFECTS OF TWO VANILLOIDS ON 4-AP INDUCED EPIEPTIFORM ACTIVITY IN VITRO
A. For recording population spikes induced by 4-AP. A recording electrode was positioned in CA1 pyramidal cell layer. The orthodromic response was first evoked to test the integrity of the slice. After 20 min of acclimatization in the interface chamber under 4-AP superfusion, we started recording baseline levels (4-AP). Next, two doses of either drug were administered subsequently at 20 min intervals. B. Example of an orthodromic evoked potential. The arrow indicates the position of the stimulus artifact and the references used to calculate the evoked potential amplitude (ΔV) and delay (Δt) are also shown. C. Examples of epileptiform discharges induced by 4-AP and increase in population spikes after superfusion of capsaicin (CIN) D. Mean ± SEM RMS µV showing a dose related increase in power induce by CIN. * p < 0.05, repeated measures ANOVA followed by post-hoc tests. E. Examples of epileptiform discharges induced by 4-AP and decrease in population spikes after superfusion of capsazepine (CZP). F. Mean ± SEM RMS µV showing a dose related decrease in power induced by CZP. ** p < 0.001 * p < 0.05, compared with control or other doses, repeated measures ANOVA followed by post-hoc tests.
FIGURE 2
FIGURE 2. EFFECTS OF TRPV1 MODULATION ON THE ORTHODROMIC RESPONSE
A. After 20 min of acclimatization in the interface chamber, cathodic stimuli pulse (100 µs, 50–350 µA, 0.05–0.1 Hz) were delivered to the Schaffer Collaterals by a tungsten electrode to reach a stable evoked response and recorded in the pyramidal cell layer of CA1 for 20 min. Three doses of either drug were administered subsequently at 20 min intervals. B. For orthodromic evoked potentials, the stimulating electrode was positioned in the Shaffer collaterals and the recording electrode in the pyramidal cell layer of CA1. Examples of orthodromic potentials in each pharmacologic condition for capsaicin (CIN) and capsazepine (CZP) are shown. C. Mean ± SEM of normalized amplitude and delay of the evoked response show bidirectional modulation, with capsaicin increasing and capsazepine reducing the amplitude of the response. α p < 0.05 compared with control, β p < 0.05 compared with control or 1 uM group. γ p<0.005 compared with control, 1 uM or 10 uM group; repeated measures ANOVA followed by post-hoc test.
FIGURE 3
FIGURE 3. EFFECTS OF TRPV1 MODULATION ON THE ANTIDROMIC RESPONSE
A. For the antidromic evoked potentials, the stimulating electrode was positioned in the alveus and the recording electrode in the pyramidal cell layer of CA1. After 20 min of acclimatization in the interface chamber, we start recording antidromic potentials control levels (aCSF). Next, three doses of the drug were administered subsequently at 20 min intervals. B. Examples of antidromic potential traces are shown for capsaicin (CIN) and capsazepine (CZP) experiments. C. The antidromic evoked potential was confirmed by blocking excitatory synaptic transmission using AP5 and CNQX, which abolished the orthodromic (arrow) but not the antidromic component of the response. D. Mean ± SEM of normalized amplitude and delay of the evoked response, show bidirectional modulation with capsaicin increasing and capsazepine reducing the amplitude of the response. α p < 0.05 compared with control, β p < 0.05 compared with control or 1 uM group. γ p<0.005 compared with control, 1 uM or 10 uM group; repeated measures ANOVA followed by post-hoc test.
FIGURE 4
FIGURE 4. EFFECTS OF CZP ON THE cAP
A. For the cAP, both the stimulating and recording electrodes were positioned in the alveus 2–4 mm away from each other. After 20 min of acclimatization in the interface chamber to reach a stable cAP, we started recording control levels (aCSF). After that, two doses of CZP were administered subsequently at 20 min intervals. B. Examples of the compound action potential (cAP) are shown that reflect changes in the cAP amplitude elicited by CZP. C. Mean ± SEM of normalized amplitude of cAP, showing that CZP reduced the amplitude of the evoked response. α p < 0.001, β p < 0.05 compared with control or 10 uM dose; repeated measures ANOVA followed by post-hoc test. D. Mean ± SEM of normalized delay show that CZP increases the delay of the cAP. α p < 0.05 compared with control, repeated measures ANOVA followed by post-hoc test.
FIGURE 5
FIGURE 5. EVOKED REPONSE COMPARATIVE ANALYSIS
The effect on mean ± SEM normalized amplitude trend line of evoked potentials was separately analyzed for capsaicin and CZP. Direct comparison between orthodromic and antidromic relative amplitude change shows that the agonist capsaicin increased both the orthodromic and antidromic potentials, but its effect was significantly greater on the orthodromic potential. In contrast, the suppressive effect of CZP was equivalent for the antidromic response, orthodromic response, and compound action potential. This suggests that although activation of TRPV1 channels may modulate synaptic activity, the blockage of the endogenous tone on TRPV1 channels could modulates membrane excitability in cell bodies and axons independently of synaptic transmission. ** p < 0.001 * p < 0.01, between orthodromic and antidromic changes induced by capsaicin, two-way ANOVA interaction evoked potential X drug, followed by post-hoc tests.
FIGURE 6
FIGURE 6. EFFECTS OF TRPV1 LIGANDS ON BASAL HIPPOCAMPAL EEG RECORDING IN MICE
A. For in vivo recording of hippocampal activity, two tungsten recording electrodes (R1 and R2) were positioned in the dorsal hippocampus and two screw electrodes served as reference and ground. A microdialysis (MP) probe was positioned near the left (ipsilateral) recording electrode. B. After a 1-h equilibration period, baseline activity was recorded for 30 min. Next, CZP (50 mg/kg) was perfused for 30 min. There was no different on RMS between both periods (see D and E). Representative traces for 30 min periods are shown. C. Pharmacological Interaction: after a 1-h equilibration period, baseline activity was recorded for 30 min. Next, capsaicin (100 µM) was perfused continually to the end of the experiment. After 30 min of capsaicin administration, CZP (50 mg/kg) was subcutaneously administered. Representative traces from each of these periods are shown. D. Mean ± SEM RMS (µV) for consecutive 30 min periods with aCSF (control), capsaicin, and capsaicin + CZP are shown. Capsaicin induced a significant increase in power in the ipsilateral hippocampus that was reversed by CZP * p-values on bars refer to repeated measures ANOVA followed by post-hoc tests, and p-values on the lines chart refer to two-way ANOVA (Capsaicin×CZP) factor showing significant interaction. E. Mean ± SEM RMS (µV) for consecutive 30 min period with aCSF, capsaicin, and capsaicin + CZP are shown. Capsaicin induced a significant increase in power in the contralateral hippocampus that was reversed by CZP. * p-values on bars refer to repeated measures ANOVA followed by post-hoc tests, and p-values on the lines chart to two-way ANOVA (Capsaicin×CZP) factor showing significant interaction.
FIGURE 7
FIGURE 7. EFFECT OF TWO VANILLOIDS ON 4-AP INDUCED ELECTROGRAPHIC SEIZURES IN VIVO
A. For in vivo recording of hippocampal activity, two tungsten recording electrodes were positioned in the right (contralateral) and left (ipsilateral) sides of the septal hippocampus and an additional electrode was positioned in the left temporal hippocampus, which is connected to the septal region by the longitudinal pathway (longitudinal). Two screws served as reference and ground. A microdialysis probe (MP) was positioned near the left (ipsilateral) recording electrode. B. Representative 2 min traces for the ipsilateral sides during administration of 4-AP (20 mM) and after administration of CZP. After normalization the change in RMS for the three recording electrodes was the same (see C below). C. Signal RMS after CZP administration normalized to activity induced by 20 mM 4-AP showing ongoing seizure activity for either vehicle or CZP in the three electrode locations. CZP significantly decreased seizures in the three locations. **p < 0.001, *p < 0.01, repeated measures ANOVA followed by post-hoc tests for the ipsi-lateral, contra-lateral and longitudinal recording regions. D. Normalized RMS data activity induced by 40 mM 4-AP showing ongoing seizure activity for either vehicle or CZP in the three electrode locations. CZP significantly decreased seizures in contralateral and longitudinal electrodes but failed to modify seizure activity in the ipsilateral side. **p < 0.001, *p < 0.01, repeated measures ANOVA followed by post-hoc tests for only contra-lateral and longitudinal groups.
FIGURE 8
FIGURE 8. OVERALL EXPRESSION OF TRPV1 CHANNELS IN NEURONS AND OLIGODENDROCYTES (ODC)
A. Immuno-labelling for TRPV1 in CA1 pyramidal cell layer of the hippocampus in the Thy1-YFP transgenic mouse show co-expression of neural marker Thy-1-YFP (green) and TRPV1 channels (red). Arrows indicate examples of cells in which co-expression is clear. Sub-regions of hippocampus CA1 are demarcated in D. Confocal images are 25X magnification/ 0.7X field. Scale bar = 50 µm. B. Immuno-labelling for TRPV1 channels with anti-TRPV1 antibody show expression in the pyramidal layer. Arrows indicate examples of cells in which expression is clear. Scale bar = 50 µm. C. The Thy1-YFP tracer showing positive neurons along the pyramidal cell layer. Scale bar = 50 µm. D. Staining with the nuclear marker TOTO3 show the pattern of cell distribution. The organization of the hippocampus was demarcated: (O) stratum oriens containing the alveus, (P) stratum pyramidal and (R) stratum radiatum. Arrows indicate nuclei from cells that co-express Thy1-YFP and TRPV1 markers. Scale bar = 50 µm. E. Co-expression of TRPV1 channels (red) and the ODC tracer PLP-EGFP (green) in the fornix and CA3 region, using a transgenic reporter mouse (Mallon et al., 2002). Arrows indicate examples of cells in which co-expression is clear. Sub-regions of the hippocampus CA3 are delineated in H. Confocal images are 25X magnification/ 0.7X field. Scale bar = 50 µm. F. Immuno-labeled for TRPV1 channels with anti-TRPV1 antibody show greater channel expression in small round ODC and a large blood vessel. Arrows indicate examples of cells in which expression is clear. G. Typical pattern of expression of ODC with greater number of ODC in the fornix and with few ODC that can be seen in both the stratum oriens and pyramidale. Arrows indicate examples of cells in which expression is clear. H. The nuclear marker (TOTO3) for corresponding area of the hippocampus. CA3 structural elements were demarcated: (F) fornix, (O) stratum oriens and (P) stratum pyramidale. Arrows indicate examples of nuclei from cells in which co-expression is indicated in E, F and G.
FIGURE 9
FIGURE 9. DETAILED EXPRESSION OF TRPV1 CHANNELS IN GLIAL AND NEURAL ELEMENTS
A. Low magnification view of the CA1 region to indicate the area within the alveus where the magnified images (B-D) were taken. (O) stratum oriens and (P) stratum pyramidale. (Scale bar = 50 µm) B. Higher magnification view of ODC immuno-labeled for TRPV1 channels with anti-TRPV1 and coexpressing the ODC specific tracer PLP-EGFP. The white arrow shows a cell that co-expresses both markers, while the red arrow shows an example of a cell expressing only TRPV1 but not PLP-EGFP. Fine lines indicate a nerve fiber in the alveus stained by TRPV1. Scale bar = 10µm. C. Immuno-labeled for TRPV1 channels with anti-TRPV1 antibody show clear expression in the ODC. Arrow shows two cells expressing TRPV1. Scale bar = 10 µm. D. The PLP-EGFP tracer showed abundant ODCs along the alveus. Red arrow shows spot of cell that expresses the TRPV1 but not the PLP marker, while white arrow show a PLP+ cell. Scale bar = 10µm. E. Staining for cell nuclei with the nuclear marker TOTO3, show typical nuclear morphology of the ODC nuclei contain finely granular chromatin and small halos. Arrows track nuclei corresponded to cells in B, C and D. Scale bar = 10µm. F. Panoramic view of the dentate gyrus (DG) to show the area in the granular layer border where closed up images (panels G and H) were taken. Scale bar = 100 µm. G. Magnified view of two small neurons located off the granular cell layer in the dentate gyrus. Scale bar = 20 µm. H. Magnified view of one neuron compatible with Cajal-Reitzus neurons (Cavanaugh et al., 2011). Scale bar= 10 µm I. Immunolabeled for TRPV1 channels with anti-TRPV1 antibody (red) showing abundant expression in the cytoplasm. Scale bar = 10 µm. J. Immunolabeled for Thy1-YFP confirming neural expression. Scale bar = 10 µm.

References

    1. Afrah AW, Stiller CO, Olgart L, Brodin E, Gustafsson H. Involvement of spinal N-methyl-Daspartate receptors in capsaicin-induced in vivo release of substance P in the rat dorsal horn. Neurosci Lett. 2001;316:83–86. - PubMed
    1. Avoli M, Barbarosie M, Lücke A, Nagao T, Lopantsev V, Köhling R. Synchronous GABA-mediated potentials and epileptiform discharges in the rat limbic system in vitro. J Neurosci. 1996;16:3912–3924. - PMC - PubMed
    1. Bhaskaran MD, Smith BN. Effects of TRPV1 activation on synaptic excitation in the dentate gyrus of a mouse model of temporal lobe epilepsy. Exp Neurol. 2010;223:529–536. - PMC - PubMed
    1. Canetta SE, Luca E, Pertot E, Role LW, Talmage DA. Type III Nrg1 back signaling enhances functional TRPV1 along sensory axons contributing to basal and inflammatory thermal pain sensation. PLoS One. 2011;6(9):e25108. 2011; - PMC - PubMed
    1. Cavanaugh DJ, Chesler AT, Jackson AC, Sigal YM, Yamanaka H, Grant R, O'Donnell D, Nicoll RA, Shah NM, Julius D, Basbaum AI. Trpv1 reporter mice reveal highly restricted brain distribution and functional expression in arteriolar smooth muscle cells. J Neurosci. 2011;31:5067–5077. - PMC - PubMed

Publication types