

In vivo time-serial multi-modality optical imaging in a mouse model of ovarian tumorigenesis
- PMID: 24145178
- PMCID: PMC3938523
- DOI: 10.4161/cbt.26605
In vivo time-serial multi-modality optical imaging in a mouse model of ovarian tumorigenesis
Abstract
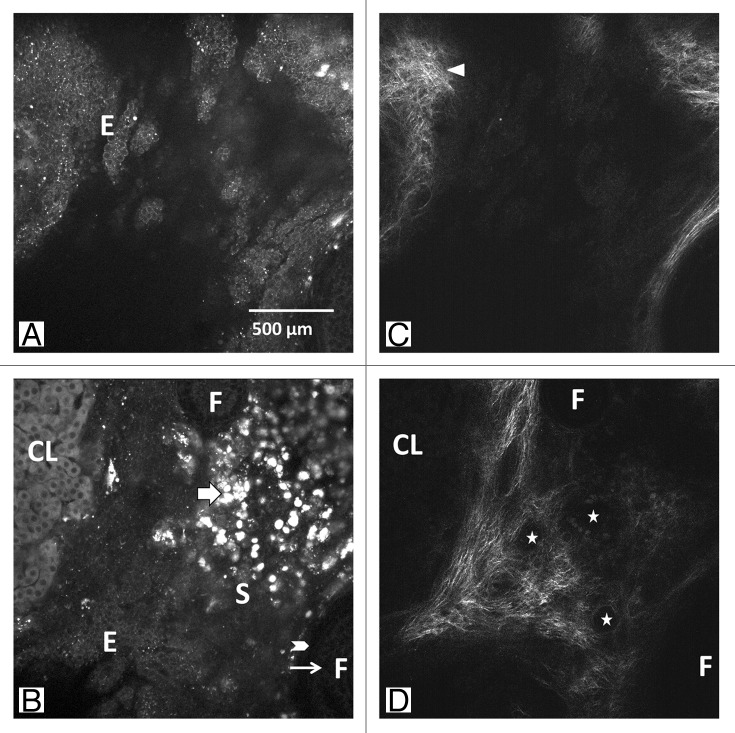
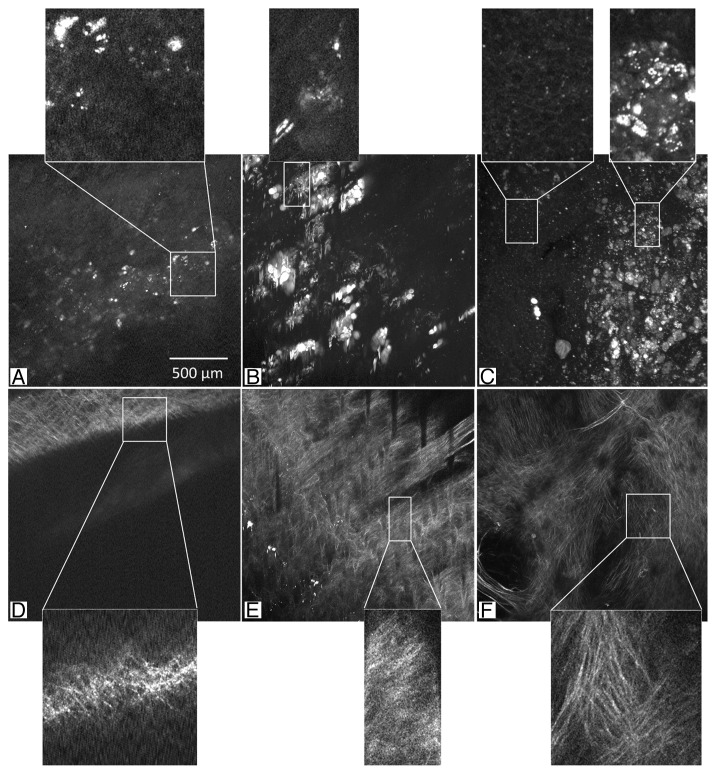
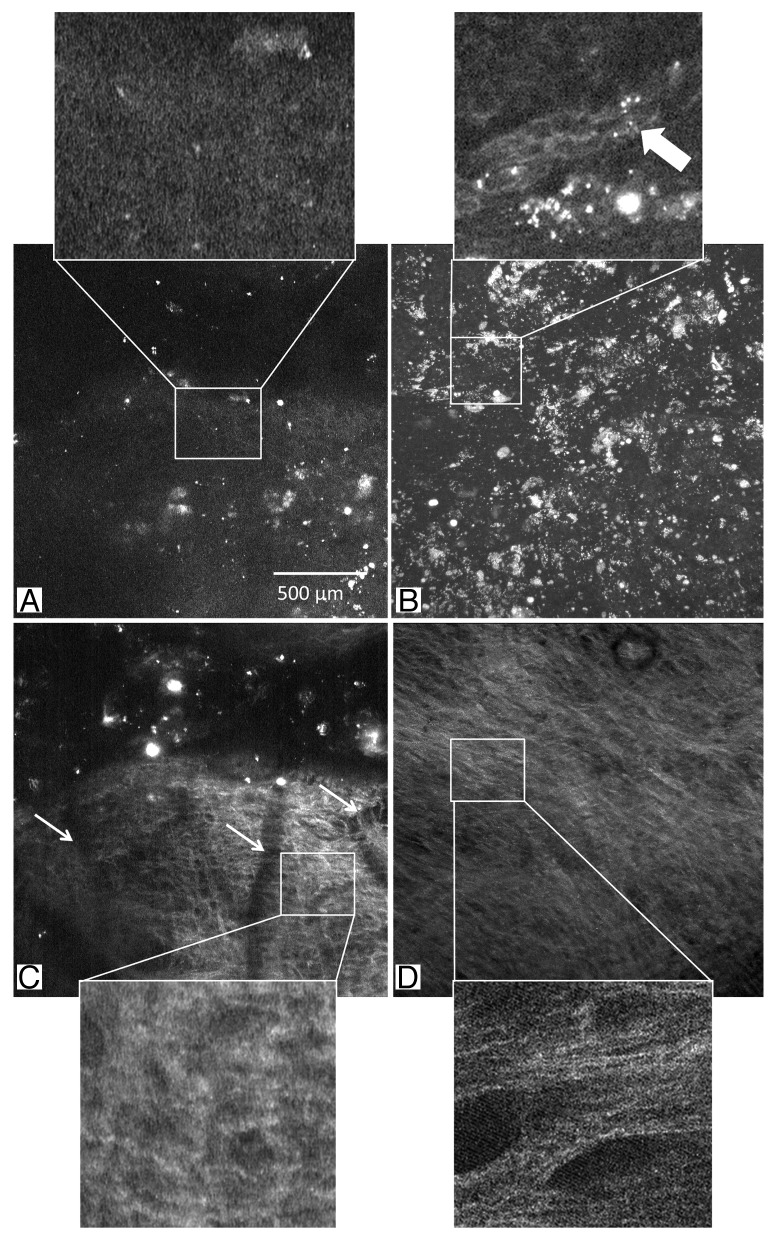
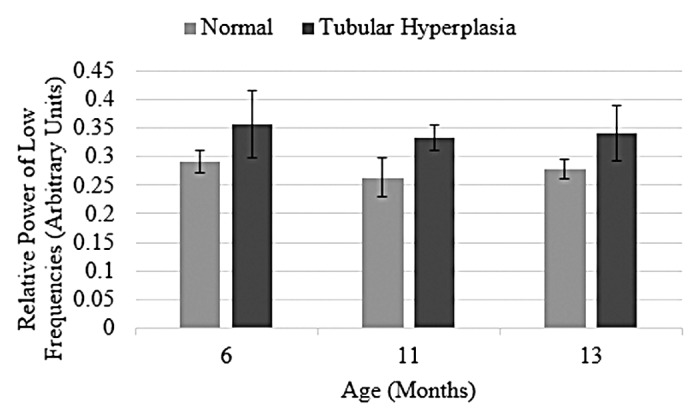
Identification of the early microscopic changes associated with ovarian cancer may lead to development of a diagnostic test for high-risk women. In this study we use optical coherence tomography (OCT) and multiphoton microscopy (MPM) (collecting both two photon excited fluorescence [TPEF] and second harmonic generation [SHG]) to image mouse ovaries in vivo at multiple time points. We demonstrate the feasibility of imaging mouse ovaries in vivo during a long-term survival study and identify microscopic changes associated with early tumor development. These changes include alterations in tissue microstructure, as seen by OCT, alterations in cellular fluorescence and morphology, as seen by TPEF, and remodeling of collagen structure, as seen by SHG. These results suggest that a combined OCT-MPM system may be useful for early detection of ovarian cancer.
Keywords: autofluorescence; cancer; multiphoton; non-linear microscopy; optical biopsy; optical coherence tomography; two-photon.
Figures


Similar articles
-
An overview of optical coherence tomography for ovarian tissue imaging and characterization.Wiley Interdiscip Rev Nanomed Nanobiotechnol. 2015 Jan-Feb;7(1):1-16. doi: 10.1002/wnan.1306. Epub 2014 Oct 20. Wiley Interdiscip Rev Nanomed Nanobiotechnol. 2015. PMID: 25329515 Free PMC article. Review.
-
Diagnostic potential of multimodal imaging of ovarian tissue using optical coherence tomography and second-harmonic generation microscopy.J Med Imaging (Bellingham). 2014 Jul 18;1(2):025501. doi: 10.1117/1.JMI.1.2.025501. J Med Imaging (Bellingham). 2014. PMID: 25798444 Free PMC article.
-
Multimodal optical imaging with multiphoton microscopy and optical coherence tomography.J Biophotonics. 2012 May;5(5-6):396-403. doi: 10.1002/jbio.201100138. Epub 2012 Mar 28. J Biophotonics. 2012. PMID: 22461146 Review.
-
Simultaneous optical coherence tomography and laser induced fluorescence imaging in rat model of ovarian carcinogenesis.Cancer Biol Ther. 2010 Sep 1;10(5):438-47. doi: 10.4161/cbt.10.5.12531. Cancer Biol Ther. 2010. PMID: 21108515 Free PMC article.
-
Optical biomarkers of serous and mucinous human ovarian tumor assessed with nonlinear optics microscopies.PLoS One. 2012;7(10):e47007. doi: 10.1371/journal.pone.0047007. Epub 2012 Oct 8. PLoS One. 2012. PMID: 23056557 Free PMC article.
Cited by
-
Time-serial Assessment of Drug Combination Interventions in a Mouse Model of Colorectal Carcinogenesis Using Optical Coherence Tomography.Cancer Growth Metastasis. 2015 Sep 7;8(Suppl 1):63-80. doi: 10.4137/CGM.S21216. eCollection 2015. Cancer Growth Metastasis. 2015. PMID: 26396545 Free PMC article.
-
An overview of optical coherence tomography for ovarian tissue imaging and characterization.Wiley Interdiscip Rev Nanomed Nanobiotechnol. 2015 Jan-Feb;7(1):1-16. doi: 10.1002/wnan.1306. Epub 2014 Oct 20. Wiley Interdiscip Rev Nanomed Nanobiotechnol. 2015. PMID: 25329515 Free PMC article. Review.
-
Diagnostic potential of multimodal imaging of ovarian tissue using optical coherence tomography and second-harmonic generation microscopy.J Med Imaging (Bellingham). 2014 Jul 18;1(2):025501. doi: 10.1117/1.JMI.1.2.025501. J Med Imaging (Bellingham). 2014. PMID: 25798444 Free PMC article.
-
Accurate evaluation of the treatment effects of immunotherapy on subcutaneous ovarian cancer in mice with nonlinear optical imaging and algorithmic analysis.Biomed Opt Express. 2022 Mar 21;13(4):2266-2277. doi: 10.1364/BOE.452569. eCollection 2022 Apr 1. Biomed Opt Express. 2022. PMID: 35519272 Free PMC article.
-
Applications of second-harmonic generation imaging microscopy in ovarian and breast cancer.Perspect Medicin Chem. 2015 Apr 16;7:21-32. doi: 10.4137/PMC.S13214. eCollection 2015. Perspect Medicin Chem. 2015. PMID: 25987830 Free PMC article.
References
-
- Brewer MA, Utzinger U, Barton JK, Hoying JB, Kirkpatrick ND, Brands WR, Davis JR, Hunt K, Stevens SJ, Gmitro AF. Imaging of the ovary. Technol Cancer Res Treat. 2004;3:617–27. - PubMed
Publication types
MeSH terms
Grants and funding
LinkOut - more resources
Full Text Sources
Other Literature Sources
Medical