

Pupil response as a predictor of blindsight in hemianopia
- PMID: 24145420
- PMCID: PMC3831461
- DOI: 10.1073/pnas.1318395110
Pupil response as a predictor of blindsight in hemianopia
Abstract
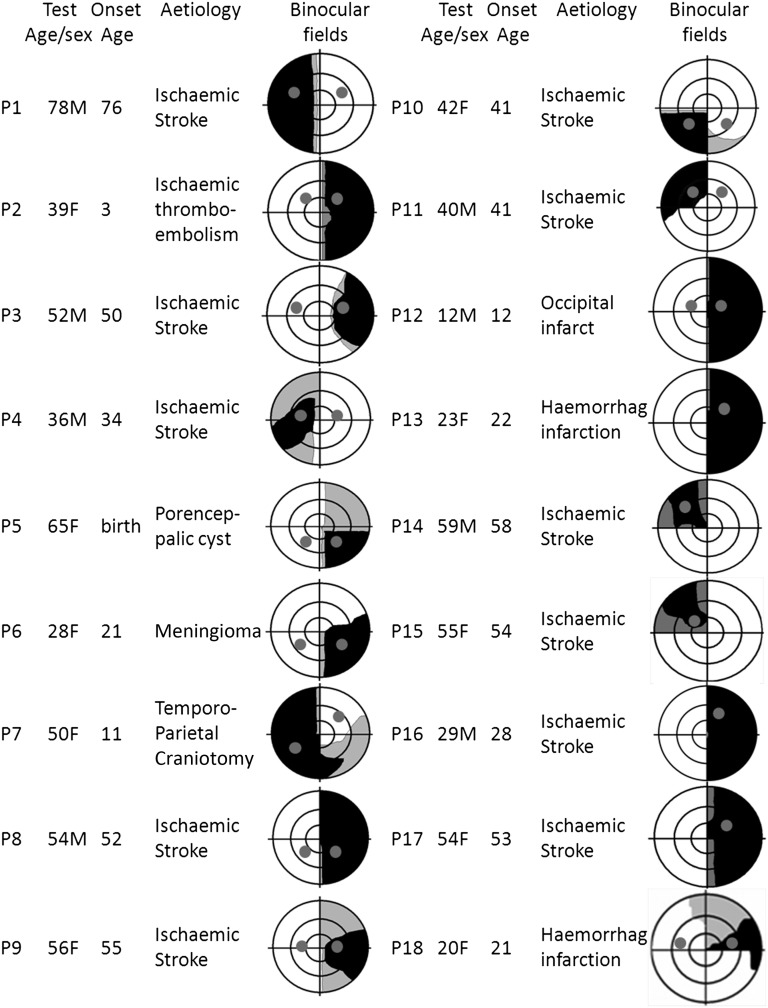
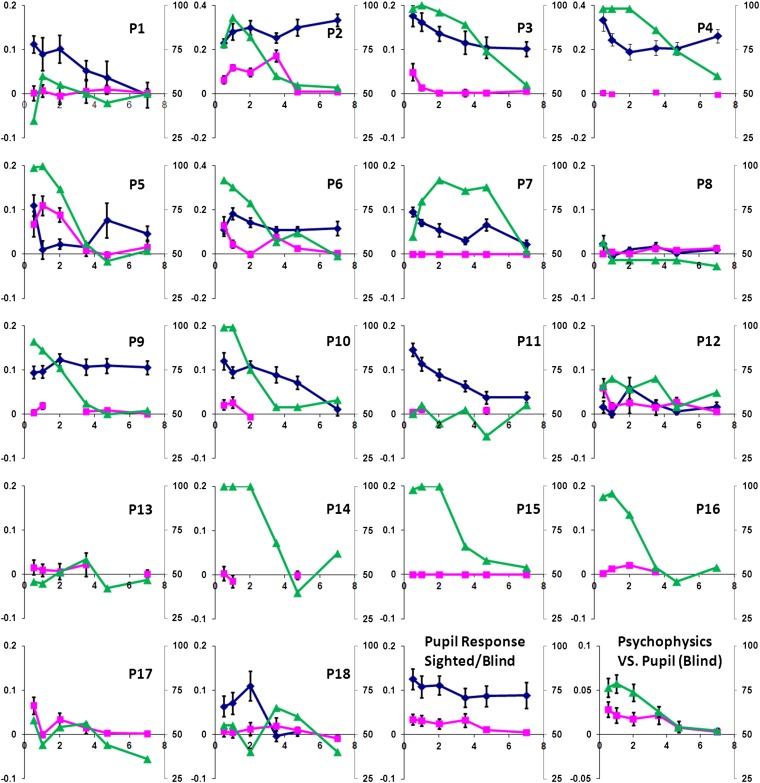
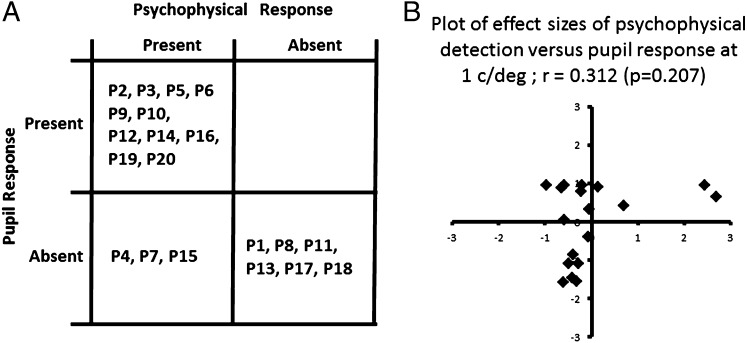
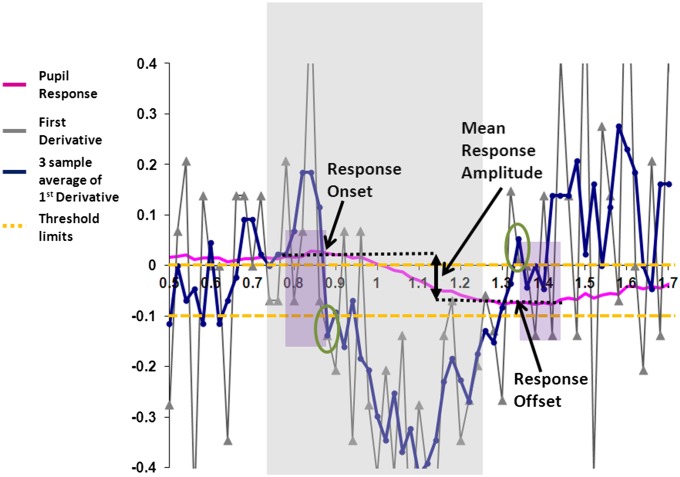
Significantly above-chance detection of stimuli presented within the field defect of patients with postgeniculate lesions is termed "blindsight." It has been proposed that those with blindsight are more likely to benefit from visual rehabilitation by repeated stimulation, leading to increased visual sensitivity within their field defect. Establishing the incidence of blindsight and developing an objective and reliable method for its detection are of great interest. Sudden onsets of a grating pattern in the absence of any change in light flux result in a transient constriction of the pupil, termed "pupil grating response." The existence of pupil grating responses for stimuli presented within the blindfield has previously been reported in a hemianopic patient and two monkeys with removal of the primary visual cortex unilaterally. Here, we have systematically investigated the presence of a spatial channel of processing at a range of spatial frequencies using a psychophysical forced-choice technique and obtained the corresponding pupil responses in the blindfield of 19 hemianopic patients. In addition, in 13 cases we determined the pupil responses in a sighted field location that matched the blindfield eccentricities. Our findings demonstrate that blindfield pupil responses are similar to those for the sighted field, but attenuated in amplitude. Pupillometry correctly characterized the presence or absence of a significant psychophysical response and thus is worth measuring in the cortically blindfields as a predictor of intact psychophysical capacity. The incidence of blindsight where detection performance had been investigated psychophysically over a range of spatial frequencies was 70%.
Keywords: incidence; screening; spatial vision.
Conflict of interest statement
The authors declare no conflict of interest.
Figures
Similar articles
-
The continuum of detection and awareness of visual stimuli within the blindfield: from blindsight to the sighted-sight.Invest Ophthalmol Vis Sci. 2013 May 1;54(5):3579-85. doi: 10.1167/iovs.12-11231. Invest Ophthalmol Vis Sci. 2013. PMID: 23633654
-
Temporal properties of spatial channel of processing in hemianopia.Neuropsychologia. 2008 Feb 12;46(3):879-85. doi: 10.1016/j.neuropsychologia.2007.11.008. Epub 2007 Nov 19. Neuropsychologia. 2008. PMID: 18158164
-
Learning from the pupil: a spatial visual channel in the absence of V1 in monkey and human.Brain. 1998 Jun;121 ( Pt 6):1065-72. doi: 10.1093/brain/121.6.1065. Brain. 1998. PMID: 9648542
-
Visual restoration in cortical blindness: insights from natural and TMS-induced blindsight.Neuropsychol Rehabil. 2006 Aug;16(4):377-96. doi: 10.1080/09602010500435989. Neuropsychol Rehabil. 2006. PMID: 16864478 Review.
-
Blindsight revisited.Curr Opin Neurobiol. 1996 Apr;6(2):215-20. doi: 10.1016/s0959-4388(96)80075-4. Curr Opin Neurobiol. 1996. PMID: 8725963 Review.
Cited by
-
Chromatic Pupillometry Methods for Assessing Photoreceptor Health in Retinal and Optic Nerve Diseases.Front Neurol. 2019 Feb 12;10:76. doi: 10.3389/fneur.2019.00076. eCollection 2019. Front Neurol. 2019. PMID: 30809186 Free PMC article. Review.
-
No evidence for a cortical origin of pupil constriction responses to isoluminant stimuli.J Vis. 2025 Aug 1;25(10):7. doi: 10.1167/jov.25.10.7. J Vis. 2025. PMID: 40793844 Free PMC article.
-
Eye metrics are a marker of visual conscious awareness and neural processing in cerebral blindness.bioRxiv [Preprint]. 2025 Jan 8:2025.01.06.631506. doi: 10.1101/2025.01.06.631506. bioRxiv. 2025. PMID: 39829811 Free PMC article. Preprint.
-
Pupil Size Is Sensitive to Low-Level Stimulus Features, Independent of Arousal-Related Modulation.eNeuro. 2023 Oct 18;10(10):ENEURO.0005-23.2023. doi: 10.1523/ENEURO.0005-23.2023. Print 2023 Oct. eNeuro. 2023. PMID: 37699706 Free PMC article.
-
From blindsight to blindsmell: a mini review.Transl Neurosci. 2014 Nov 7;6(1):8-12. doi: 10.1515/tnsci-2015-0002. eCollection 2015. Transl Neurosci. 2014. PMID: 28123786 Free PMC article. Review.
References
-
- Loewenfeld IE. The Pupil: Anatomy, Physiology, and Clinical Applications. Oxford: Butterworth-Heinemann; 1999.
-
- Al Razi (903) translated as Liber ad Ammansorem (1187), referenced at US National Library of Medicine. Available at www.nlm.nih.gov/exhibition/islamic_medical/islamic_06.html. Accessed May 28, 2013.
-
- Zinn KM. The Pupil. Springfield, IL: Charles C Thomas Publisher; 1972.
-
- Bell RA, Thompson HS. Relative afferent pupillary defect in optic tract hemianopias. Am J Ophthalmol. 1978;85(4):538–540. - PubMed
Publication types
MeSH terms
Grants and funding
LinkOut - more resources
Full Text Sources
Other Literature Sources
