. 2013 Nov 18;210(12):2523-38.
doi: 10.1084/jem.20130566. Epub 2013 Oct 21.

CD36-specific antibodies block release of HIV-1 from infected primary macrophages and its transmission to T cells

Affiliations

CD36-specific antibodies block release of HIV-1 from infected primary macrophages and its transmission to T cells

Stefano Berre et al. J Exp Med. .

Abstract

HIV-1-infected macrophages likely represent viral reservoirs, as they accumulate newly formed virions in internal virus-containing compartments (VCCs). However, the nature and biogenesis of VCCs remain poorly defined. We show that upon HIV-1 infection of primary human macrophages, Gag is recruited to preexisting compartments containing the scavenger receptor CD36, which then become VCCs. Silencing of CD36 in HIV-1-infected macrophages decreases the amount of virions released. Strikingly, soluble anti-CD36 antibodies, but not the natural ligands of CD36, inhibit release of virions from HIV-1-infected macrophages and the transmission of virus to CD4(+) T cells. The effect of the antibodies is potent, rapid, and induces the retention of virions within VCCs. Ectopic expression of CD36 in HeLa cells renders them susceptible to the inhibitory effect of the anti-CD36 mAb upon HIV-1 infection. We show that the anti-CD36 mAb inhibits HIV-1 release by clustering newly formed virions at their site of budding, and that signaling via CD36 is not required. Thus, HIV-1 reservoirs in macrophages may be tackled therapeutically using anti-CD36 antibodies to prevent viral dissemination.


Figures
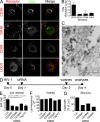
Figure 1.
Figure 1.
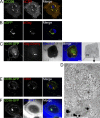
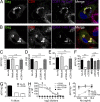
CD36 is present in the VCC and is required for efficient HIV-1 release by primary macrophages. (A) Confocal sections of macrophages infected with HIV-1 NLAD8 for 7 d and stained for the indicated markers. Merge images include DAPI staining in blue. Bars, 10 µm. (B) Quantification of the codistribution of Gag with the receptors imaged in A. For each cell, mean Pearson’s coefficient was calculated and for each group (n > 15), data are presented as geometric mean with 95% C.I. (C) Immuno-EM of HIV-1–infected macrophages. Ultrathin cryosections were double labeled for p17 Gag with PAG 10 (Protein A coupled to gold particles of 10 nm diameter) and for CD36 with PAG15. The arrow indicates a viral particle stained with both anti-CD36 and anti-p17 Gag antibodies. (D) Schematic representation of the experimental design. (E) Measurement of p24 Gag released in the supernatant of macrophages that had been infected with HIV-1 and transfected with the indicated siRNA. Washes were performed at day 3. Supernatants were collected 24 h after and analyzed by ELISA for their p24 Gag content. Data are presented as mean ± SEM of four replicates. One-way ANOVA with Tukey’s Multiple Comparison Test was used as statistic test (**, P ≤ 0.01; ***, P ≤ 0.001). (F) Cell viability determined at the end of the experiments using CellTiter-Glo is expressed in arbitrary units of luminescence and presented as mean ± SEM of four replicates. (G) Silencing efficiency was estimated by flow cytometry analysis of the various cell populations that were fixed and stained for CD36. MFI is expressed as percentage of the control (cells transfected with siRNA specific for luciferase). Images are representative of at least two independent experiments. Experiments depicted in E and F have been repeated at least three times with different donors, and twice for the one in G.
Figure 2.
Figure 2.
Plasma membrane–connected CD36+ compartments are present in infected and uninfected macrophages. (A) Confocal micrographs of uninfected macrophages stained for the indicated antibodies. (B) Confocal sections of primary macrophages co-infected with HIV-1 Gag-iCherry ΔEnv and CD36-GFP lentiviral vector for 7 d, fixed, and stained for the indicated markers. In B and E anti-GFP antibodies were used to enhance the GFP signal. (C) Macrophages grown on fluorodishes with coordinates were infected with a lentiviral vector encoding CD36-GFP, together with SIV-VLP and, 5 d later, with HIV-1 Gag-iCherry ΔEnv. On day 7 p.i., cells were exposed to a 10 kD dextran–Alexa Fluor 647 and then immediately imaged by spinning disk microscopy to follow the indicated markers. The same fluorodishes were then embedded in epon resin and processed for EM. An overview of the macrophage imaged by EM is presented on the right. N = nucleus. (D) Magnification of the region boxed on the right, with viral budding profiles visible at the limiting membrane and both mature and immature viral particles. (E) Macrophages infected with the lentiviral vector encoding CD36-GFP for 7 d were fixed and stained for the VCC marker CD81. (F) Macrophages infected with the lentiviral vector encoding CD36-GFP for 12 d were exposed as in C to dextran–Alexa Fluor 647 and then immediately imaged by spinning disk microscopy. In A, B, and E merge images include DAPI staining in blue. Data shown are representative of at least two independent experiments. Bars: (A–C, E, and F) 10 µM; (D) 2 µM.
Figure 3.
Figure 3.
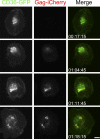
Upon HIV-1 infection, Gag is recruited to preexisting CD36+ compartments in macrophages. Macrophages were first transduced with a lentivector encoding CD36-GFP and, 4 d later, infected with HIV-1 Gag-iCherry ΔEnv. After another 8 h, cells were washed and then live imaged during 2 d (see Video S1). The presented images were acquired at the indicated time (days:hours:minutes). Bar, 10 µM.
Figure 4.
Figure 4.
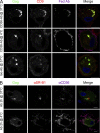
Exogenously added antibodies specific for CD36 are transported into the VCC. (A) Confocal micrographs of HIV-1 Gag-iGFP–infected primary macrophages are presented. Cells were exposed for 2 h at 37 or 4°C with the indicated mAb, then fixed and stained for CD9, whereas isotype control mAbs as well as CD36-specific mAbs were revealed with appropriate secondary antibodies (Bars, 10 µM). (B) Confocal micrographs of HIV-1 Gag-iGFP–infected macrophages simultaneously exposed to antibodies specific for SR-BI (rabbit antibodies) and CD36 (mouse mAb) for 2 h. Both types of antibodies are internalized at 37°C (not at 4°C), but only the CD36-specific mAb colocalizes with Gag+ compartments. Merge images include DAPI staining in blue. Data shown are representative of two independent experiments. Bars, 10 µM.
Figure 5.
Figure 5.
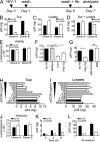
CD36-specific antibodies induce a potent, rapid, and long-lasting inhibition of HIV-1 release from macrophages. (A) Schematic representation of the experimental design. (B and C) Quantification of p24 Gag present in the overnight culture supernatant harvested as indicated in A (B), and in the corresponding cell lysates (C). (D) Total p24 Gag found in the supernatant + the cell lysates. (E) Cell viability was measured at the end of the experiment with the CellTiter-Glo kit. (F and G) Quantification of p24 Gag released from primary macrophages treated overnight with the indicated Abs. In F, all antibodies were used at 1 µg/ml. In G, the IgM specific for CD36 (SMΦ) was used, like its isotype control, at 20 µg/ml, while the FA6-156 and its isotype control were used at 10 µg/ml. (H and I) Titration of the effect of CD36-specific mAb (clone IVC7) on HIV-1–infected macrophages on the amounts of secreted (H) and cell-associated (I) p24 Gag. (J) Infectivity of the virions on the reporter cell line TZM-bl produced by the macrophages subjected to the anti-CD36 mAb treatment was evaluated using the same amount of p24 Gag (10 ng/ml; see Materials and methods). (K) Quantification of p24 Gag in the supernatant of HIV-1 NLAD8-infected macrophages treated at 7 d p.i. with an anti-CD36 mAb (FA6-152) or its isotype control for the indicated time. (L) Quantification of the p24 Gag produced by HIV-1 NLAD8–infected macrophages in a 24-h time window before (–) or after (+) antibody washout. 6-d-infected macrophages were washed and exposed to the indicated antibodies for 24 h. Then cells were washed out and incubated in compete medium for another 24 h. Supernatant collected before and after antibody washout were stored at −20°C for at least 1 d before p24 Gag quantification. Representative experiments are presented in B–L. All the experiment have been reproduced at least three times with three different donors, except for H and I, which have been performed once (similar results are shown in Fig. 6 I). Data are shown as mean ± SEM of triplicates. One-way ANOVA with Tukey’s multiple comparison test was used as a statistical test (*, P ≤ 0.05; **, P ≤ 0.01; ***, P ≤ 0.001).
Figure 6.
Figure 6.
The anti-CD36-mediated inhibition of HIV-1 release is specific and requires bivalent binding. (A and B) Exogenous CD81 and ICAM-1–specific antibodies are transported to the VCC. Macrophages were infected with HIV NLAD8 for 3 d, washed, and incubated for 2 h with a CD81-specific mAb (A) or an ICAM-1–specific mAb (B). mAbs were used at a final concentration of 5 µg/ml. Cells were then washed, fixed, permeabilized, and stained for Gag and CD9 to identify VCCs. Bars, 10 µm. Merge images include DAPI staining in blue. (C–F) Quantification of p24 Gag released from macrophages treated overnight with the indicated antibodies. Of note, other antibodies transported to the VCC (C and D), antibodies specific for markers of the VCC (C, D and E), and antibodies specific for other LDLRs (F) did not modulate HIV-1 release from macrophages. (G) Quantification of the p24 Gag produced by HIV-1–infected primary macrophages treated (as indicated in Fig. 5 A) with the FA6-152 antibody in the presence or not of Fc-blocking antibodies. (H) Flow cytometry titration of the anti-CD36 mAb CLB-IVC7 and its Fab fragment. HeLa-CD36 (open symbols) and HeLa cells (black symbols) were stained with serial dilutions of the anti-CD36 mAb and its Fab revealed by appropriate secondary antibodies. MFIs are plotted as a function of the Ab dilutions. (I) Quantification of p24 Gag released from macrophages treated overnight with the anti-CD36 mAb, its Fab fragment, or the isotype control. Cells were exposed to the three dilutions indicated by arrows in H. Data are shown as mean ± SEM of triplicates. In C–I, representative experiments are shown. All the experiments have been reproduced at least two times with different donors. One-way ANOVA with Tukey’s multiple comparison test was used as a statistical test (*, P ≤ 0.05; **, P ≤ 0.01; ***, P ≤ 0.001).
Figure 7.
Figure 7.
Exposure to CD36-specific antibodies induces intracellular accumulation of virions in VCCs. (A) Immunoblot analysis of Gag polypeptides present in lysates of infected macrophages exposed to the CD36 mAb (36) or its isotype control (Iso). Bands corresponding to p55 Gag (p55), p24 Gag (p24), and tubulin (Tub) are indicated. The molecular weight corresponding to the closest band of the ladder is indicated. (B–D) Quantifications of the intensity of the various Gag polypeptides present in cell lysates were performed by immunoblot analysis as in A. The experiments were repeated with cells from seven donors. p55 Gag and p24 Gag signals were normalized for α-tubulin. Statistical analyses were performed using the Wilcoxon matched pairs test (*, P ≤ 0.05). (E) Examples of 3D reconstructions obtained before and after segmentation of image stacks acquired by confocal microscopy of macrophages infected with HIV-1 Gag-iGFP for 7 d, and exposed from days 5 to 7 to the anti-CD36 mAb or its isotype control. Bars, 7 µm. Segmented reconstructions, as seen in E, were quantified using Imaris software. Graphs illustrating the variation of the total Gag intensity per cell (F) and the total volume of VCC per cell (G) are presented. Effect of the anti-CD36 on p24 Gag release was estimated in parallel by Elisa in the three donors used for these experiments. The mean inhibition of p24 Gag release was 90%. Data are presented with the median in red. Each square corresponds to a cell. Statistical analyses were performed using the Mann-Whitney test (***, P ≤ 0.001). (H) HIV-1 NLAD8–infected macrophages at 6 d p.i. were washed and treated with anti-CD36 mAbs or with its isotype control for 48 h. Cells were then fixed, embedded in epon, and processed for EM. Bar, 200 nm. (I) HIV-1–infected macrophages treated as in H were prepared for immuno-EM. mAbs present in internal compartments were detected with appropriate secondary antibodies revealed by PAG10. Bars, 200 nm. Representative images are shown in H and I. Data were reproduced with three different donors.
Figure 8.
Figure 8.
Modulation of HIV-1 release by anti-CD36 antibody exposure is not related to CD36 interaction with MOxLDL, TSP-1, or type-I collagen. (A) Immunoblot analysis of the phosphorylation of JNK after different stimuli. HIV-1 NLAD8-infected macrophages starved for 2 h in serum-free medium were treated with anti-CD36 mAb, its isotype control (1 µg/ml), or MOxLDL (at 50 µg/ml) for the indicated period of time. α-Tubulin contents on the same immunoblot are presented for control of loading. The molecular weight corresponding to the closest band of the ladder is indicated. (B) Macrophages infected with HIV-1 NLAD8 for 7 d were washed and pretreated for 30 min with medium supplemented or not with FA6-152 mAb or its isotype control at 2 µg/ml. Then medium with or without MOxLDL was added directly onto the cells to obtain the indicated final concentration of MOxLDL and to keep mAb final concentration at 1 µg/ml. Measure of the p24 Gag released during overnight treatment are presented. (C) Cell viability at the end of the experiment shown in B was measured with the CellTiter-Glo kit. (D) Macrophages at 7 d p.i. starved for 2 h in serum-free medium were treated with the anti-CD36 or with the isotype control mAb in complete medium (control), medium supplemented with lipoprotein deficient serum (LPDS), or serum-free medium (no serum). (E) Quantification of the p24 Gag released from HIV-1–infected macrophages treated overnight with the anti-CD36 antibody (FA6-152 at 2 µg/ml), its isotype control, or thrombospondin-1 (TSP-1) and type-I collagen (COL1) at the indicated concentrations. Representative experiments are shown. Except for D, which was performed twice, results were obtained at least three times with different donors. Data are presented as mean ± SEM of triplicates.
Figure 9.
Figure 9.
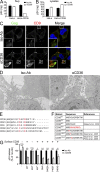
Anti-CD36 antibody treatment induces HIV-1 tethering at the plasma membrane of HeLa cells expressing CD36. Quantification of p24 Gag in the supernatant (A) and lysates (B) of HeLa and HeLa-CD36 cells treated with the FA6-152 mAb or with the IgG1 control overnight. A representative experiment is shown. The data shown are the means and SEM of triplicates. (C) Confocal sections of HeLa and HeLa-CD36 cells infected with HIV-1 Gag-iGFP, treated with the anti-CD36 mAb or its isotype control (Iso-Ab) for 48 h, and stained for CD9. Insets are enlargements of the boxed regions. Bars, 10 µm. Merge images include DAPI staining in blue. (D) Electron micrographs of HIV-1 NLAD8-infected HeLa-CD36 cells treated with FA6-152 mAb or its isotype control. Bar, 10 µm. (E) Multiple alignment illustrating the conserved residues present in the cytoplasmic tails of the proteins indicated. The figure was adapted from Primo et al. (2005). (F) Table showing the CD36 mutants produced with the corresponding changes in the C-tail sequence. The mutated amino acids are shown in red. The CD36467* and the CD36Y463F mutants are impaired for binding and capture of MOxLDL (Malaud et al., 2002) and for Staphylococcus aureus internalization (Stuart et al., 2005), respectively, whereas the CD36C464S mutant is impaired for S. aureus internalization (Stuart et al., 2005) and for loss of TSP-1–dependent VEGF-A165–induced migration (Primo et al., 2005). (G) Quantification of p24 Gag in the supernatant of HeLa cell lines stably expressing the indicated CD36 mutants, treated with the anti-CD36 mAb or its isotype control. CD36 cell surface expression was assessed by FACS (indicated by + or –). Data are presented as the means and SEM of three independent experiments performed on three different preparations of transduced cell lines, with the exception of the experiments with the 467* and C464S mutants which were independently repeated twice. Statistical analysis was performed by two-way ANOVA with Bonferroni’s post hoc test (*, P ≤ 0.05; **, P ≤ 0.01; ***, P ≤ 0.001).
Figure 10.
Figure 10.
Effect of anti-CD36 antibody exposure on macrophages infected with a primary isolate and on macrophage–to–T cell transmission. (A and B) Macrophages from two donors were infected with the primary HIV-1 isolate 132W and treated at day 7 p.i. with anti-CD36 mAb or isotype control as in Fig. 5 (A–C). p24 Gag contents were measured in culture supernatant (A) and in corresponding cell lysates (B). (C) Cell viability measured at the end of the experiment with the CellTiter-Glo kit. Data are presented as mean ± SEM of triplicates. (D) Macrophage–to–T cell HIV-1-transmission after co-culture of heterologous, activated primary CD4+ T cells with HIV-1–infected macrophages in the indicated conditions. Percentage of infected CD4+ T cells after co-culture was measured by intracellular FACS staining of Gag. Data presented were obtained from three independent experiments performed on cells from three different donors and are shown as Geo Mean with 95% CI. One-way ANOVA with Tukey’s multiple comparison test was used as statistic test (***, P ≤ 0.001).

Similar articles

Cited by

References

    1. Areschoug T., Gordon S. 2009. Scavenger receptors: role in innate immunity and microbial pathogenesis. Cell. Microbiol. 11:1160–1169 10.1111/j.1462-5822.2009.01326.x - DOI - PubMed
    1. Asch A.S., Barnwell J., Silverstein R.L., Nachman R.L. 1987. Isolation of the thrombospondin membrane receptor. J. Clin. Invest. 79:1054–1061 10.1172/JCI112918 - DOI - PMC - PubMed
    1. Benaroch P., Billard E., Gaudin R., Schindler M., Jouve M. 2010. HIV-1 assembly in macrophages. Retrovirology. 7:29 10.1186/1742-4690-7-29 - DOI - PMC - PubMed
    1. Bennett A.E., Narayan K., Shi D., Hartnell L.M., Gousset K., He H., Lowekamp B.C., Yoo T.S., Bliss D., Freed E.O., Subramaniam S. 2009. Ion-abrasion scanning electron microscopy reveals surface-connected tubular conduits in HIV-infected macrophages. PLoS Pathog. 5:e1000591 10.1371/journal.ppat.1000591 - DOI - PMC - PubMed
    1. Chen P., Hübner W., Spinelli M.A., Chen B.K. 2007. Predominant mode of human immunodeficiency virus transfer between T cells is mediated by sustained Env-dependent neutralization-resistant virological synapses. J. Virol. 81:12582–12595 10.1128/JVI.00381-07 - DOI - PMC - PubMed

Publication types

MeSH terms