. 2013 Nov 18;210(12):2773-89.
doi: 10.1084/jem.20122798. Epub 2013 Oct 21.

Overexpression of TLR7 promotes cell-intrinsic expansion and autoantibody production by transitional T1 B cells

Affiliations

Overexpression of TLR7 promotes cell-intrinsic expansion and autoantibody production by transitional T1 B cells

Natalia V Giltiay et al. J Exp Med. .

Abstract

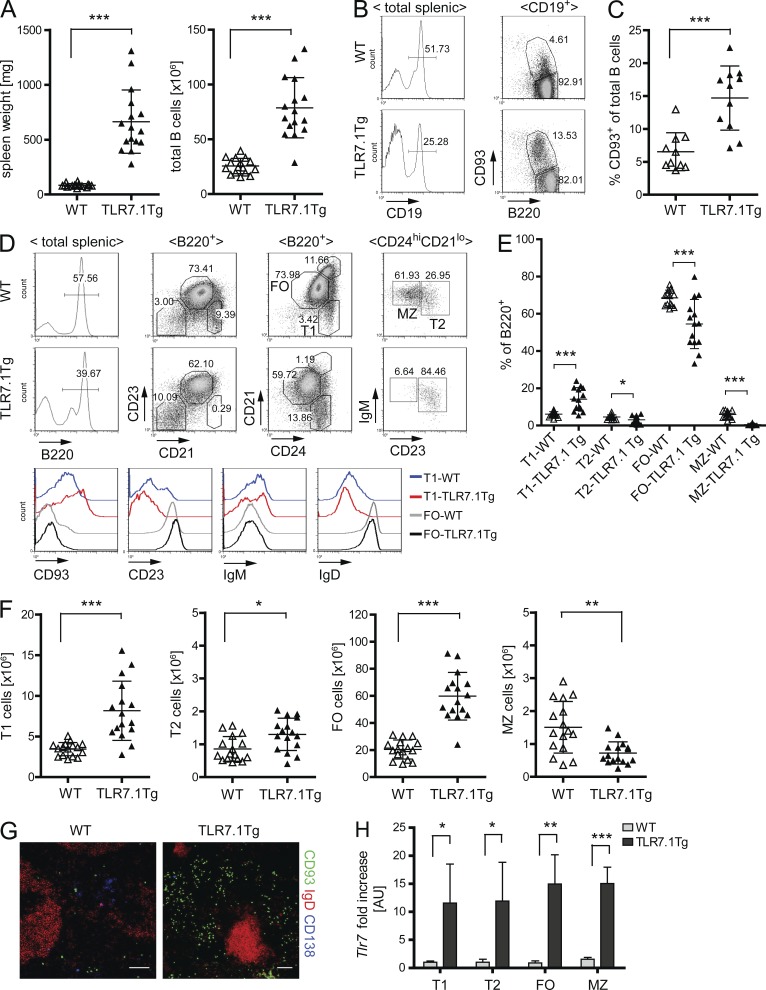
Toll-like receptor (TLR), a ligand for single-stranded RNA, has been implicated in the development of pathogenic anti-RNA autoantibodies both in systemic lupus erythematous (SLE) patients and in murine models of lupus. It is still unclear, however, where and how TLR7-mediated interactions affect the development of autoreactive B cells. We found that overexpression of TLR7 in transgenic mice (TLR7.1Tg) leads to marked alterations of transitional (T1) B cells, associated with their expansion and proliferation within the splenic red pulp (RP). This phenotype was intrinsic to the T1 subset of B cells and occurred independently of type 1 IFN signals. Overexpression of RNase in TLR7.1Tg mice significantly limited the expansion and proliferation of T1 cells, indicating that endogenous RNA complexes are driving their activation. TLR7.1Tg T1 cells were hyper-responsive to anti-IgM and TLR7 ligand stimulation in vitro and produced high concentrations of class-switched IgG2b and IgG2c, including anti-RNA antibodies. Our results demonstrate that initial TLR7 stimulation of B cells occurs at the T1 stage of differentiation in the splenic RP and suggest that dysregulation of TLR7 expression in T1 cells can result in production of autoantibodies.


Figures

Figure 1.
Figure 1.
TLR7 overexpression promotes the expansion of T1 and FO B cell subsets. (A) Spleens from 8–14-wk-old WT and TLR7.1Tg mice were analyzed for splenomegaly and the frequencies of B220+ cells B cells were assessed by flow cytometry. Cell numbers were calculated based on the total cell number per spleen. (B and C) Splenocytes from WT and TLR7.1Tg mice were gated on CD19+ B cells and the frequencies of immature (B220+CD93+) B cells were assessed by flow cytometry. (D) Representative flow cytometric plots and gating strategy used to identify splenic B cell subsets. The following markers were used to discriminate T1 (B220+CD24hiCD21lo), T2 (B220+CD24hiCD21int/hiCD23hi), FO (B220+CD24intCD21int), and MZ (B220+CD24hiCD23CD21hi) B cell subsets. Histograms below show the expression of CD93, CD23, IgM, and IgD of T1 and FO B cells from WT and TLR7.1Tg mice. (E and F) The frequencies of different splenic B cell subsets were assessed by flow cytometry and cell numbers were calculated based on the total cell number per spleen. In A, C, E, and F, each dot represents an individual animal with the mean indicated for each group (horizontal bars). Presented data are from five or more independent experiments. (G) Splenic sections were prepared from frozen spleens of WT and TLR7.1Tg mice and stained with CD93, IgD, and CD138 antibodies. Data show an accumulation of (CD93brigthIgDlowCD138neg) T1 cells in the splenic RP of TLR7.1Tg mice and are representative of more than six sections analyzed from two mice per genotype. Bars, 100 µm. (H) T1, T2, FO, and MZ cell subsets from WT and TLR7.1Tg mice were sorted and the expression of Tlr7 mRNA was quantified by RT-PCR. Data are presented as fold change of mRNA levels relative to WT T1 cells. Data are from an average of four mice per genotype (8–12 wk old). *, P < 0.05; **, P < 0.01; ***, P < 0.001, as determined by two-tailed, unpaired Student’s t test.
Figure 2.
Figure 2.
Increased proliferation and increased apoptosis of T1 B cells in TLR7.1Tg mice. (A and B) 8–12-wk-old WT and TLR7.Tg mice were injected with 1 mg BrdU 1 h before sacrifice, and BrdU incorporation in different B cell subsets was analyzed by flow cytometry. Representative histograms in A show the percentage of BrdU+ cells in each B cell subset. (B) Summarized data from individual mice as in A. Each dot represents an individual animal with the mean indicated for each group (horizontal bars). Presented data are from three independent experiments. (C) Splenic sections were prepared from frozen spleens of WT and TLR7.1Tg mice injected with BrdU 1 h before sacrifice and stained with anti-IgD and anti-BrdU Abs. Data show the presence of proliferating BrdU+ cells (green) outside of IgD+ B cell follicles (red). Data are representative data of more than six sections analyzed from three mice per genotype. Bars, 100 µm. (D–F) Lethally irradiated B6 mice were reconstituted with an equal mix of congenic-labeled WT (Ly5.1+) and TLR7.1Tg (Ly5.2+) BM cells. Mice were injected with BrdU 1 h before sacrifice and the percentages of T1, FO, and T2/MZ B cell populations within gated Ly5.1+B220+ or Ly5.2+B220+ cells and the frequency of BrdU+ cells within each subset were analyzed by flow cytometry. (D) Gating strategy for detecting BdrU+ B cells and representative flow cytometric plots. (E and F) Summarized data from three independent experiments showing the percentage of Ly5.1+ or Ly5.2+ cells with the T1 cells (E) or the percentages of BdrU+ T1, T2/MZ, or FO cells (F) in WT:WT or TLR7.1Tg:WT chimeric mice. Each dot represents an individual animal with the mean indicated for each group (horizontal bars). (G and H) TLR7.1Tg × HEL mice were injected with BrdU 1 h before sacrifice and the percentages of T1 cells (defined as CD24hi CD21lo CD23lo) and the frequencies of BrdU+ T1 cells within the HEL+ and HEL cell population were analyzed by flow cytometry. HEL+ B cells were identified using biotinylated HEL. (G) Gating strategy and representative flow cytometric plots. (H) Summarized data showing the percentage of BrdU+ T1 cells within gated HEL+ and HEL cell populations in TLR7.1Tg × HELTg mice. (I) Annexin V binding within individual B cell subsets from WT and TLR7.1Tg mice was assessed by flow cytometry. Presented data are from three independent experiments. Each dot represents an individual animal with the mean indicated for each group (horizontal bars). *, P < 0.05; **, P < 0.01; ***, P < 0.001, as determined by two-tailed, unpaired Student’s t test or one-way ANOVA with Tukey’s post-test, where appropriate.
Figure 3.
Figure 3.
TLR7.1Tg T1 B cells are hyper-responsive to in vitro TLR7 ligand stimulation. (A and B) Spleens from 8–14-wk-old WT and TLR7.1Tg mice were analyzed for the frequencies of CD44brightCD138+ cells within gated T1 or FO B cell subsets by flow cytometry. (A) Gating strategy and representative flow cytometric plots. (B) Summarized data from individual WT and TLR7.1Tg mice. Purified T1 cells (C) or FO cells (D) from WT or TLR7.1Tg mice were loaded with CFSE and cultured for 72 h in RPMI medium or stimulated with anti-IgM (10 µg/ml), R848 (50 ng/ml), a combination of anti-IgM plus R848, or SmRNP (10 ng/ml). Representative histograms show the percentage of proliferating (CFSElo) cells after the indicated treatments. Bar graphs summarize the percentage of live cells (defined based on FSC/SSC gating) and the percentage of proliferating cells. Shown are the combined means ± SD from three independent experiments. *, P < 0.05; **, P < 0.01; ***, P < 0.001, as determined by two-tailed, unpaired Student’s t test or one-way ANOVA with Tukey’s post-test, where appropriate.
Figure 4.
Figure 4.
TLR7.1Tg T1 B cells produce class-switched IgG. (A and B) Sorted T1 and FO B cells from WT and TLR7.1Tg mice were cultured for 72 h in RPMI medium or stimulated with anti-IgM (10 µg/ml), R848 (50 ng/ml), or a combination of anti-IgM plus R848 or SmRNP (10 ng/ml). Ab production in cell culture supernatants were analyzed by ELISA. (A) Bar graphs show quantities of total IgM and IgG produced by T1 and FO B cells in response to different stimuli. (B) Bar graphs show quantities of IgG1, IgG2b, and IgG2c produced by T1 B cells in response to different stimuli. The data are presented as mean ± SD from three independent experiments. (C) Splenic sections were prepared from frozen spleens from 5-mo-old WT and TLR7.1Tg mice and stained with anti-B220 and anti-IgG2b and anti-IgG2c Abs. Data show presence of IgG2b+ and IgG2c+ cells in the splenic RP of TLR7.1Tg mice and are representative of more than four sections analyzed from two mice per genotype. Bars, 100 µm. (D) Sorted T1 B cells from WT and TLR7.1Tg mice were cultured for 72 h in RPMI medium or stimulated with anti-IgM (10 µg/ml), R848 (50 ng/ml), or a combination of anti-IgM plus R848 or SmRNP (10 ng/ml). Anti-RNA IgG titers in cell culture supernatants were analyzed by ELISA. Individual dots represent data from two independent experiments. (E) Representative Hep-2 ANA staining of undiluted culture supernatants from WT or TLR7Tg T1 cells cultured for 72 h in RPMI medium or stimulated with R848, or a combination of anti-IgM plus R848. Data are representative of three independent experiments. Bars, 50 µm. (F and G) T1, T2, FO, and MZ cell subsets from WT and TLR7.1Tg mice were isolated by cell sorting and the expression of Aicda (F) and Tbx21 (G) mRNA were quantified by RT-PCR. Data are presented as fold change of mRNA levels relative to WT T1 cells. Data are average of four mice per genotype (8–12 wk old) and show mean ± SEM. *, P < 0.05; **, P < 0.01; ***, P < 0.001, as determined by two-tailed, unpaired Student’s t test.
Figure 5.
Figure 5.
Overexpression of RNase limits the expansion of T1 cells in TLR7.1Tg mice. (A–C) 4–6-mo-old WT, RNase Tg, TLR7.1Tg, and TLR7.1 × RNase Tg mice were analyzed for splenomegaly (A) and the frequencies of B220+, T1, T2, FO, and MZ B cells were assessed by flow cytometry. (B) Representative flow cytometric plots showing the frequencies of T1, T2/MZ, and FO B cells of gated B220+ cells. Cell numbers were calculated based on the total cell number per spleen. (C) Summarized data showing the number of T1, T2, FO, and MZ B cells. Data in A–C are from three independent experiments. (D and E) Mice were injected with 1 mg BrdU 1 h before sacrifice, and BrdU incorporation in gated T1 cells was analyzed flow cytometry. Representative histograms in D show the percentages of BrdU+ T1 cells in different mice genotypes. Data from two independent experiments are summarized in E. (F and G) Splenocytes from WT, RNase Tg, TLR7.1Tg, and TLR7.1 × RNase Tg mice were stained with anti-B220, anti-CD138, and anti-CD44 mAb to assess the frequencies of plasma cells. (F) Representative flow cytometry plots show the gating strategy and frequency of plasma cells (CD138+CD44+) within total splenic cells from mice with different genotypes. Data from three independent experiments are summarized in G. In A, C, E, and G, each dot represents an individual animal with the mean indicated for each group (horizontal bars). *, P < 0.05; **, P < 0.01; ***, P < 0.001, as determined by two-tailed, unpaired Student’s t test or one-way ANOVA with Tukey’s post-test, where appropriate.
Figure 6.
Figure 6.
Type I IFN signaling is not required for the expansion of T1 and FO B cells but is required for depletion of the MZ B cell population in TLR7.1Tg mice. (A) Spleens from 3–6-mo-old WT, IFNαR-KO, TLR7.1Tg, and TLR7.1Tg × IFNαR-KO mice were analyzed by flow cytometry to assess the frequencies of total B cells, T1, T2, and FO B cells. Cell numbers were calculated based on the total cell number per spleen. Each dot represents an individual animal with the mean indicated (horizontal bars). (B) Purified T1 cells or FO B cells from IFNαR-KO and TLR7.1Tg × IFNαR-KO mice were loaded with CFSE and cultured for 72 h in RPMI medium or stimulated with 50 ng/ml R848. Histograms show the percentage of proliferating (CFSElo) cells after the indicated treatments. (C and D) MZ B cells populations in WT, IFNαR-KO, TLR7.1Tg, and TLR7.1Tg × IFNαR-KO mice were analyzed by flow cytometry. (C) Representative flow plots showing the frequencies of MZ B cells, defined as B220+CD21brightCD1dbright cells. (D) Summary of the flow cytometric data showing the number of MZ B cells in mice of the indicated genotypes. Data in A, C, and D are the summary of three independent experiments, and data presented in B are representative of two independent experiments. In A and D, each dot represents an individual animal with the mean indicated for each group (horizontal bars). *, P < 0.05; **, P < 0.01; ***, P < 0.001, as determined by one-way ANOVA with Tukey’s post-test.
Figure 7.
Figure 7.
Anti-RNA–specific B cells in H564i Tg mice display an immature phenotype and produce class-switched IgG Abs. (A–D) Splenocytes from 6-mo-old WT and H564Igi+/− mice were analyzed by flow cytometry to assess the frequencies and phenotype of H564Id+ B cells. (A) Representative flow plots show staining with anti-H564 Id Ab, used to define Id+ cells (right). The middle shows the frequencies of T1, T2, FO, and MZ B cell subsets, as determined by anti-CD24 and anti-CD21 staining. The right shows overlap between Id and Id+ cells (shown in blue). (B) Summarized data from individual WT and H564Igi+/− mice showing the frequencies of CD24hiCD21lo cells of gated B220+ cells. (C) Data show the distribution of Id+ cells within individual B cell populations in H564Igi+/− mice. (D) Histograms show the expression of CD93, CD23, IgM, and IgD on gated Id+ (blue) and Id (black) B cells in H564Igi+/− mice. (A–D) Data presented are from four independent experiments. In B and C, each dot represents an individual animal with the mean indicated for each group (horizontal bars). (E) Splenic sections were prepared from frozen spleens of WT and H564Igi+/− mice and stained with B220 (red), CD169 (blue), and H564Id (green). Data are representative of more than six sections analyzed from two mice per genotype. Bars, 100 µm. (F) Serum levels of Id IgG2a and IgG2b in individual WT and H564Igi+/− mice (6–12 mo old) were determined by ELISA. Sera dilutions: 1:15,000 (IgG2a) and 1:3,000 (IgG2b). Each dot represents an individual animal with the mean indicated for each group (horizontal bars). (G and H) Purified Id+CD93hi and Id+CD93lo cells from H564Igi+/− mice were cultured for 72 h in RPMI medium or stimulated with 50 ng/ml R848, and the production of antibodies in culture supernatants was measured by ELISA. (G) Gating strategy used for purification of Id+CD93hi and Id+CD93lo cells. (H) Bar graphs show the mean titers of IgM, IgG1, IgG2a, and IgG2b in culture supernatants produced by Id+CD93hi and Id+CD93lo cells. Data are representative of two independent experiments using four individual mice and presented as mean ± SD. Error bars indicate variation between the individual mice. **, P < 0.01; ***, P < 0.001, as determined by two-tailed, unpaired Student’s t test or one-way ANOVA with Tukey’s post-test, where appropriate.

Similar articles

Cited by

References

    1. Amano H., Amano E., Moll T., Marinkovic D., Ibnou-Zekri N., Martinez-Soría E., Semac I., Wirth T., Nitschke L., Izui S. 2003. The Yaa mutation promoting murine lupus causes defective development of marginal zone B cells. J. Immunol. 170:2293–2301 - PubMed
    1. Andrews S.F., Zhang Q., Lim S., Li L., Lee J.H., Zheng N.Y., Huang M., Taylor W.M., Farris A.D., Ni D., et al. 2013. Global analysis of B cell selection using an immunoglobulin light chain-mediated model of autoreactivity. J. Exp. Med. 210:125–142 10.1084/jem.20120525 - DOI - PMC - PubMed
    1. Aranburu A., Ceccarelli S., Giorda E., Lasorella R., Ballatore G., Carsetti R. 2010. TLR ligation triggers somatic hypermutation in transitional B cells inducing the generation of IgM memory B cells. J. Immunol. 185:7293–7301 10.4049/jimmunol.1002722 - DOI - PubMed
    1. Beisner D.R., Langerak P., Parker A.E., Dahlberg C., Otero F.J., Sutton S.E., Poirot L., Barnes W., Young M.A., Niessen S., et al. 2013. The intramembrane protease Sppl2a is required for B cell and DC development and survival via cleavage of the invariant chain. J. Exp. Med. 210:23–30 10.1084/jem.20121072 - DOI - PMC - PubMed
    1. Bekeredjian-Ding I.B., Wagner M., Hornung V., Giese T., Schnurr M., Endres S., Hartmann G. 2005. Plasmacytoid dendritic cells control TLR7 sensitivity of naive B cells via type I IFN. J. Immunol. 174:4043–4050 - PubMed

Publication types

MeSH terms